Electricity suppliers and energy companies manage numerous contracts with businesses, industries, and government organizations. These contracts involve complex financial structures including revenue agreements, operational costs, risk levels, and payment schedules. However, managing these contracts manually often leads to data confusion and poor decision-making.
Therefore, organizations require a powerful analytical system that converts electricity contract data into clear business insights. This is exactly where the Electricity Contract Dashboard in Power BI becomes extremely valuable.
The Electricity Contract Dashboard in Power BI is a ready-to-use analytics dashboard designed to track electricity contract performance, monitor financial metrics, evaluate risk levels, and analyze operational trends. Because Power BI provides interactive data visualization and advanced analytics, organizations can quickly explore large contract datasets and identify important patterns.
In this comprehensive guide, we will explain everything about the Electricity Contract Dashboard in Power BI, including its dashboard pages, features, benefits, best practices, and how energy companies can use it to improve contract management.
Click to Purchases Electricity Contract Dashboard in Power BI
What is an Electricity Contract Dashboard in Power BI?
An Electricity Contract Dashboard in Power BI is a data visualization and analytics tool that helps organizations monitor electricity supply contracts and financial performance.
Instead of reviewing scattered reports, managers can analyze contract performance through a centralized dashboard.
This dashboard helps organizations track:
-
Total contract revenue
-
Operational costs
-
Profit margins
-
Payment delays
-
High-risk contracts
-
Regional contract performance
-
Monthly financial trends
Because Power BI allows interactive filtering and drill-down analysis, decision-makers can quickly understand contract performance and take action when necessary.
Why Do Energy Companies Need an Electricity Contract Dashboard?
Electricity companies often manage hundreds or thousands of contracts across different sectors and regions. Monitoring these contracts manually can be extremely challenging.
Without a proper dashboard, companies may face several issues:
-
Limited visibility into contract profitability
-
Difficulty identifying payment delays
-
Lack of insights into regional performance
-
Poor monitoring of high-risk contracts
-
Slow financial decision-making
However, when companies implement the Electricity Contract Dashboard in Power BI, they gain a centralized analytics platform that simplifies contract management.
As a result, organizations can monitor financial performance more effectively.
Click to Purchases Electricity Contract Dashboard in Power BI
Key Features of the Electricity Contract Dashboard in Power BI
The Electricity Contract Dashboard in Power BI contains multiple analytical pages that provide deep insights into electricity contract performance.
The dashboard includes five interactive pages in the Power BI Desktop file.
Each page focuses on a specific dimension of electricity contract analytics.
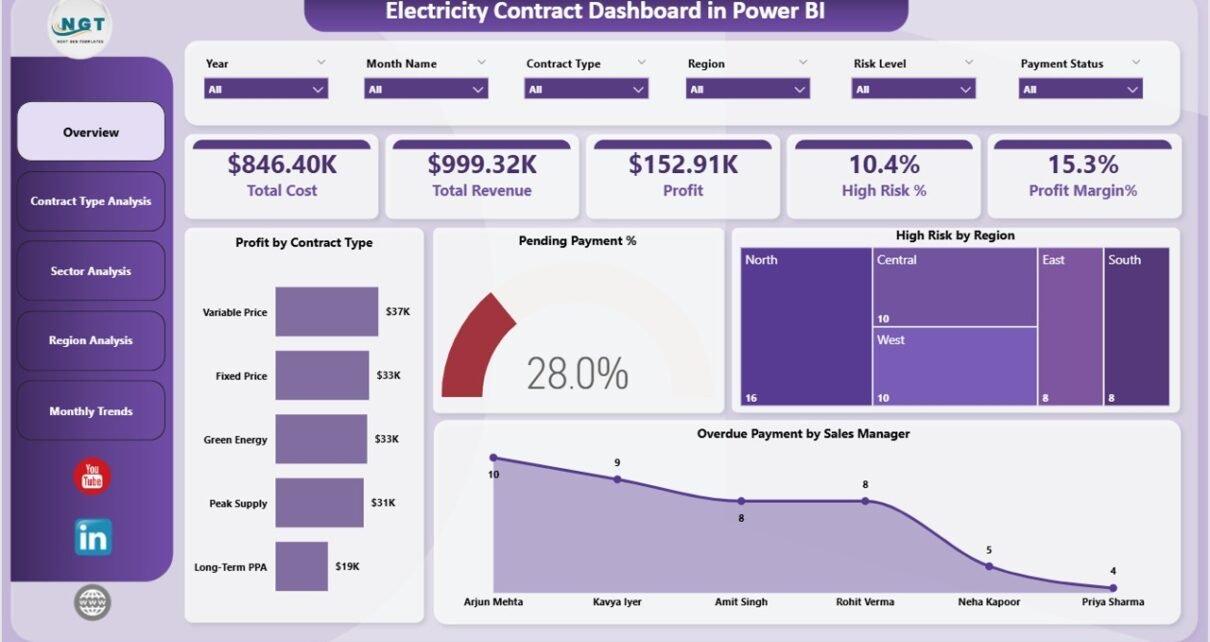
1. Overview Page – Central Contract Performance Monitoring
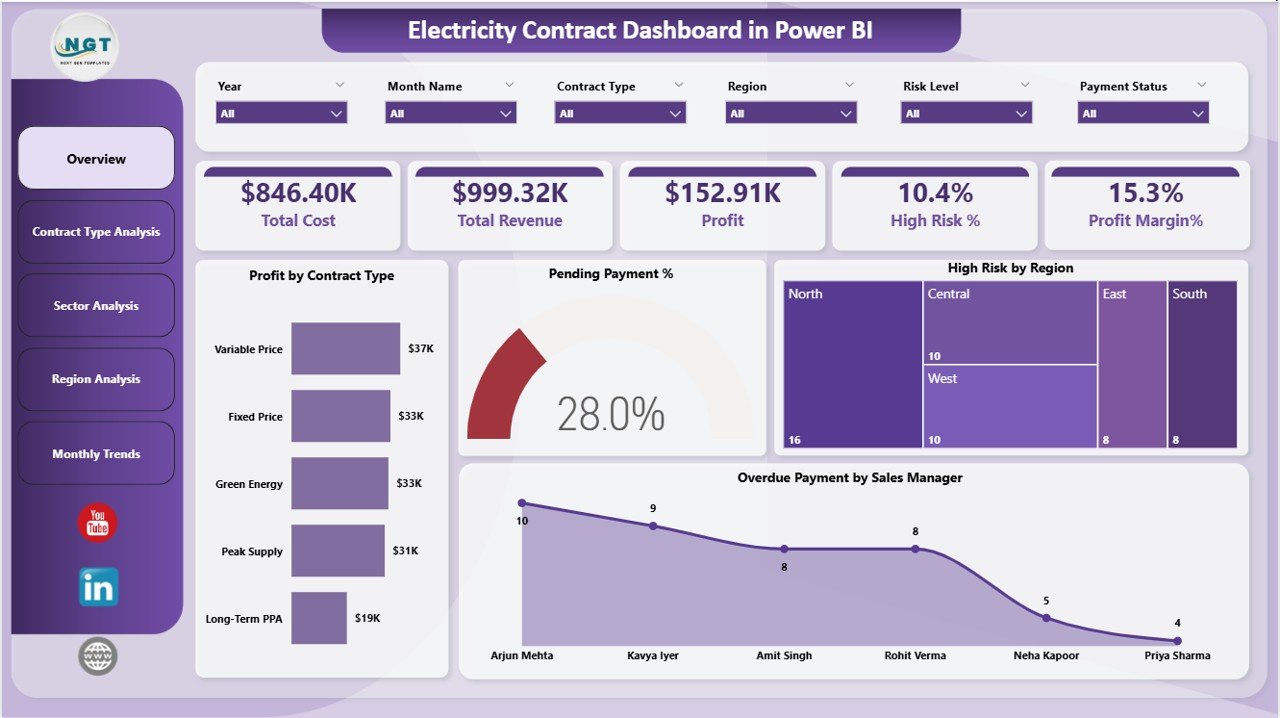
The Overview Page serves as the main dashboard where users can view a summary of electricity contract performance.
This page includes slicers (filters) that allow users to analyze data based on different criteria such as contract type, sector, region, or sales manager.
KPI Cards on the Overview Page
The dashboard displays five important KPI cards:
-
Total Cost – Displays the overall cost associated with electricity contracts
-
Total Revenue – Shows the total revenue generated from contracts
-
Profit – Calculates revenue minus cost
-
High Risk % – Displays the percentage of high-risk contracts
-
Profit Margin % – Shows overall contract profitability
These KPI indicators provide an instant snapshot of financial performance.
Click to Purchases Electricity Contract Dashboard in Power BI
Charts Included in the Overview Page
The overview dashboard includes four analytical charts:
-
Profit by Contract Type – Shows profitability across different contract categories
-
Pending Payment % – Highlights outstanding payments across contracts
-
High Risk by Region – Displays regions with higher contract risk levels
-
Overdue Payment by Sales Manager – Shows delayed payments associated with sales managers
Because of these visuals, managers can quickly identify financial risks and operational issues.
2. Contract Type Analysis – Which Contract Types Are Most Profitable?
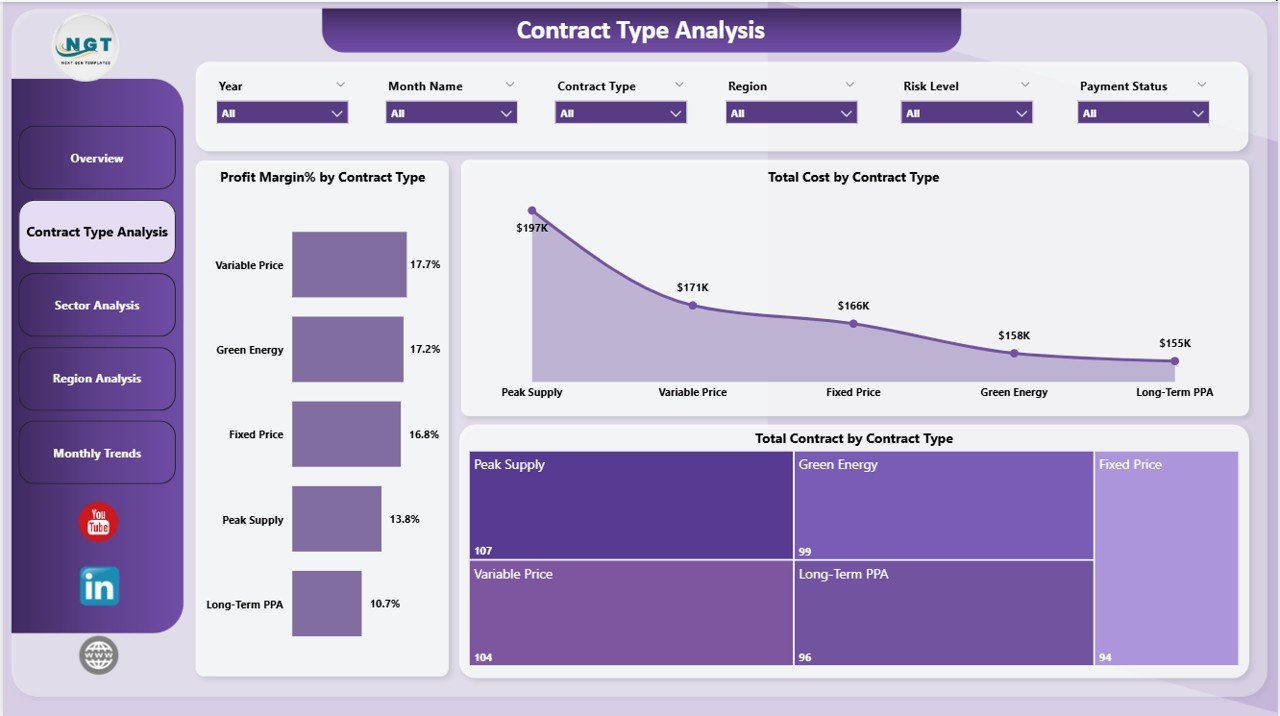
Electricity companies often offer multiple contract types such as fixed-rate contracts, long-term supply agreements, or variable pricing contracts.
The Contract Type Analysis Page helps organizations analyze how each contract category performs.
Users can apply slicers to filter data by specific contract types.
Click to Purchases Electricity Contract Dashboard in Power BI
Charts Included in Contract Type Analysis
This page contains three charts:
-
Profit Margin % by Contract Type – Displays profitability levels for each contract category
-
Total Cost by Contract Type – Shows operational costs associated with each contract type
-
Total Contracts by Contract Type – Displays the number of contracts under each category
Because of this analysis, companies can identify which contract structures deliver better returns.
3. Sector Analysis – Which Industry Sectors Generate the Most Revenue?
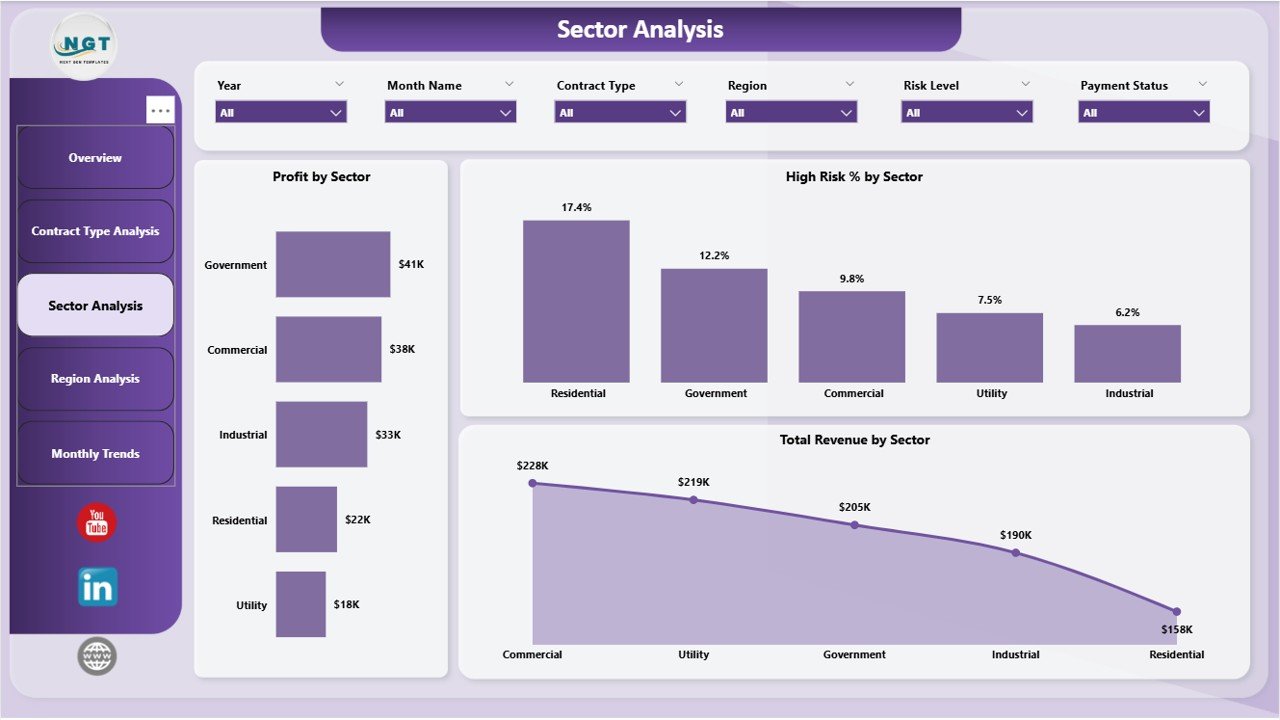
Electricity suppliers serve multiple sectors including manufacturing, commercial organizations, government agencies, and residential markets.
The Sector Analysis Page helps organizations evaluate contract performance across different sectors.
Charts Included in Sector Analysis
The page includes three charts:
-
Profit by Sector – Displays profit contribution from each industry sector
-
High Risk % by Sector – Highlights sectors with higher contract risk
-
Total Revenue by Sector – Shows revenue generated from each sector
With this information, companies can focus on sectors that provide higher profitability and lower risk.
Click to Purchases Electricity Contract Dashboard in Power BI
4. Region Analysis – How Do Electricity Contracts Perform Across Regions?
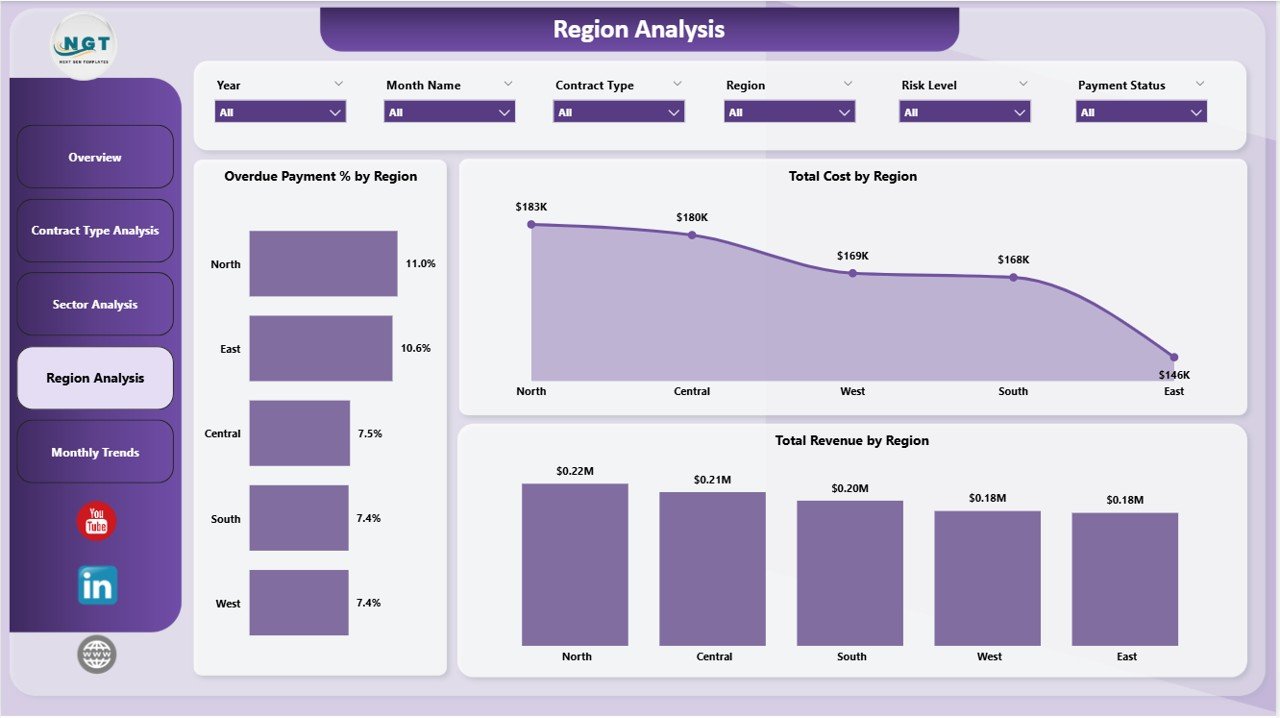
Electricity demand and contract performance often vary across regions due to infrastructure, regulations, and energy consumption patterns.
The Region Analysis Page helps organizations evaluate geographical performance.
Charts Included in Region Analysis
This page contains three charts:
-
Overdue Payment % by Region – Displays payment delays across regions
-
Total Cost by Region – Shows operational costs for each region
-
Total Revenue by Region – Displays revenue contribution by region
As a result, companies can easily identify regions that perform better financially.
5. Monthly Trends – How Do Contract Metrics Change Over Time?
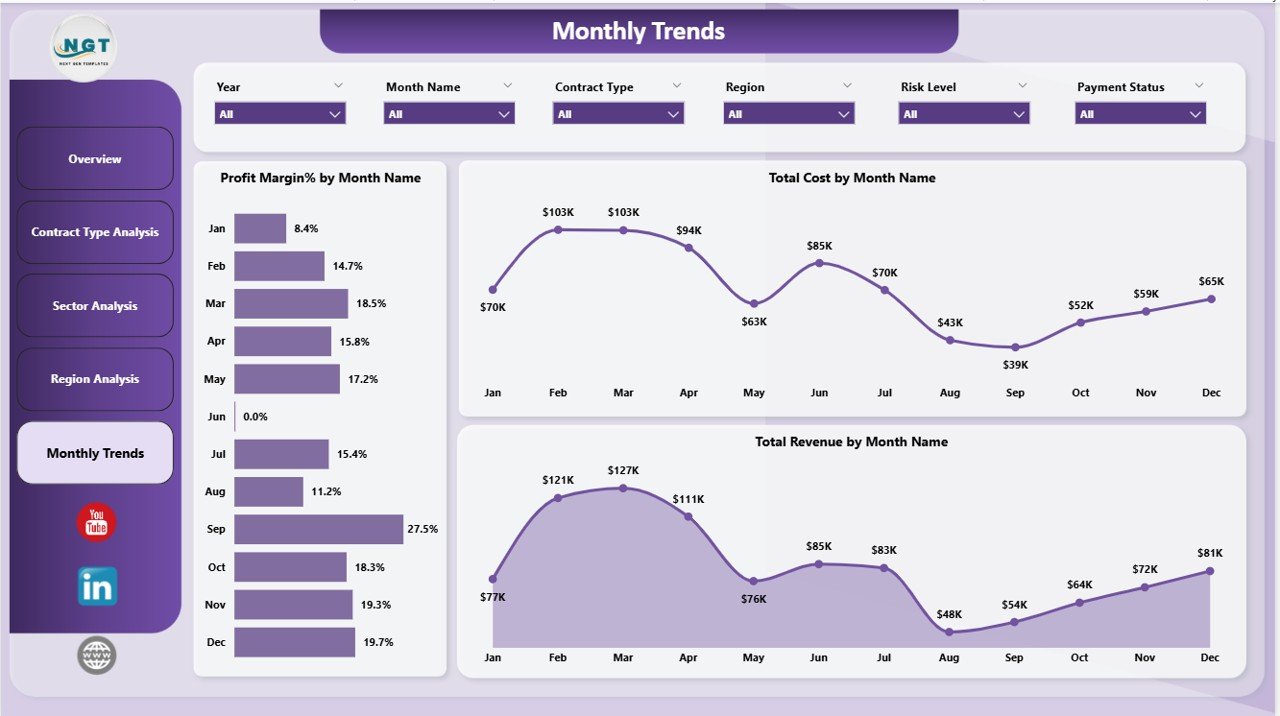
Electricity contracts generate financial activity throughout the year. Therefore, organizations must analyze monthly performance trends.
The Monthly Trends Page provides time-based analysis of financial performance.
Charts Included in Monthly Trends
This section includes three charts:
-
Profit Margin % by Month Name – Shows monthly profitability trends
-
Total Cost by Month Name – Displays operational cost patterns across months
-
Total Revenue by Month Name – Tracks monthly revenue growth
Because of this analysis, companies can identify seasonal trends and adjust their strategies accordingly.
Click to Purchases Electricity Contract Dashboard in Power BI
Advantages of the Electricity Contract Dashboard in Power BI
Organizations gain several benefits by using this dashboard.
Centralized Contract Analytics
The dashboard consolidates all electricity contract data into one analytical platform.
Better Financial Visibility
Managers can easily track revenue, cost, and profitability.
Improved Risk Monitoring
High-risk contract indicators help identify potential issues early.
Faster Decision Making
Interactive Power BI visuals enable quick insights.
Regional Performance Insights
Companies can analyze contract performance by location.
Payment Tracking
Overdue payment charts help finance teams monitor outstanding payments.
Opportunities for Improvement in Electricity Contract Analytics
Although the dashboard provides powerful insights, organizations can enhance analytics capabilities further.
Integration with Energy Management Systems
Connecting the dashboard with operational energy systems can provide real-time contract insights.
Predictive Analytics
Machine learning models can forecast contract profitability and payment delays.
Customer Risk Scoring
Companies can implement risk scoring models to identify unreliable customers.
Best Practices for Using the Electricity Contract Dashboard in Power BI
Organizations should follow these best practices to maximize dashboard effectiveness.
Maintain Clean Data
Ensure that contract data remains accurate and structured.
Update Data Regularly
Organizations should refresh data frequently to keep insights current.
Standardize Contract Categories
Use consistent naming conventions for contract types and sectors.
Monitor High-Risk Contracts
Regularly review risk indicators to prevent financial losses.
Train Team Members
Employees should understand how to use Power BI filters and dashboards effectively.
Why Power BI is Ideal for Electricity Contract Analytics
Power BI provides powerful analytics capabilities that make it ideal for contract performance monitoring.
Key advantages include:
-
Interactive dashboards
-
Real-time analytics
-
Dynamic filtering
-
Drill-down analysis
-
Integration with multiple data sources
Because of these features, Power BI transforms complex contract data into easy-to-understand visual insights.
Click to Purchases Electricity Contract Dashboard in Power BI
How Does This Dashboard Improve Electricity Contract Management?
The Electricity Contract Dashboard in Power BI helps organizations monitor contract performance in real time.
It allows companies to analyze revenue, cost, risk levels, and payment performance.
As a result, decision-makers can quickly identify opportunities for improvement and optimize contract strategies.
Conclusion
Electricity contract management requires constant monitoring of financial performance, payment status, and risk levels. Without a structured analytical system, organizations may struggle to manage large volumes of contract data.
The Electricity Contract Dashboard in Power BI provides a powerful solution by converting contract data into clear visual insights. With multiple analytical pages covering contract types, sectors, regions, and monthly trends, this dashboard allows energy companies to monitor contract performance effectively.
Therefore, electricity providers, energy suppliers, and contract managers should consider implementing this Power BI electricity contract dashboard to improve financial visibility and operational efficiency.
Click to Purchases Electricity Contract Dashboard in Power BI
Frequently Asked Questions (FAQs)
What is an Electricity Contract Dashboard in Power BI?
It is an analytical dashboard used to monitor electricity contract performance, financial metrics, and risk levels.
Who should use this dashboard?
This dashboard is useful for:
-
Electricity suppliers
-
Energy trading companies
-
Utility companies
-
Contract managers
-
Financial analysts
What metrics can be tracked in this dashboard?
The dashboard tracks metrics such as:
-
Total revenue
-
Total cost
-
Profit margin
-
High-risk contracts
-
Payment delays
Can the dashboard be customized?
Yes. Since it is built in Power BI, users can customize visuals, metrics, and filters based on business needs.
Why is Power BI useful for contract analytics?
Power BI provides interactive visualizations and advanced analytics that simplify complex contract data analysis.
Click to Purchases Electricity Contract Dashboard in Power BI
Visit our YouTube channel to learn step-by-step video tutorials