Introduction
The Knowledge Hubs KPI Dashboard is a comprehensive, ready-to-use template designed specifically for Outsourced Accounting KPIs. This dashboard helps streamline KPI tracking, analysis, and reporting by providing an interactive and visually appealing interface. Whether you are managing client accounts, monitoring team performance, or comparing monthly progress, the Knowledge Hubs KPI Dashboard offers all the tools you need to stay on top of your key performance indicators.
Click to Purchases Knowledge Hubs KPI Dashboard in Excel
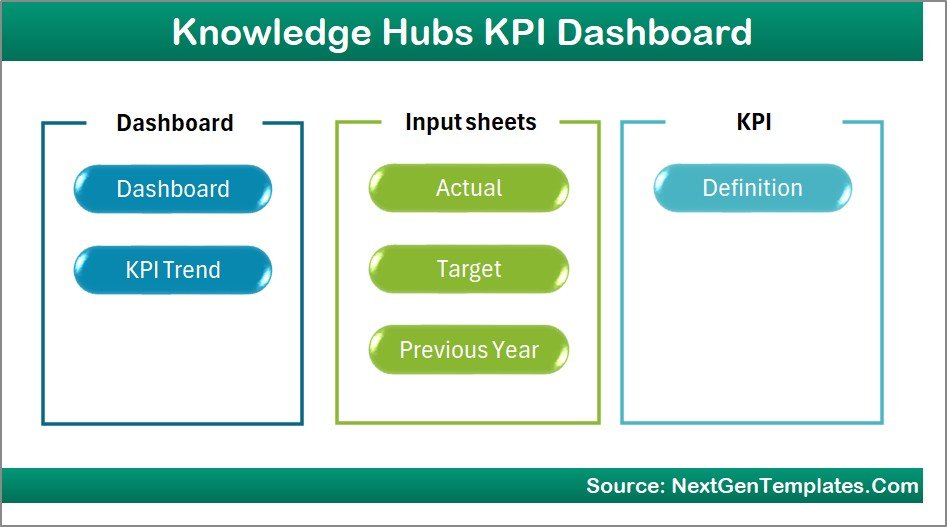
Key Features of Knowledge Hubs KPI Dashboard
- Seven well-structured worksheets for easy navigation and data input.
- Dynamic month selection to view month-to-date (MTD) and year-to-date (YTD) data.
- Conditional formatting with up/down arrows for quick visual insights on performance versus targets and previous year data.
- Interactive trend charts for monitoring KPI progress and identifying patterns.
- Dedicated sheets for Actuals, Targets, Previous Year data, and KPI definitions ensuring organized data management.
- User-friendly dropdowns for KPI selections and month navigation to customize your dashboard view.
- Clear KPI definitions including units, formulas, and types (Lower the Better or Upper the Better), enhancing KPI clarity.
Dashboard Pages Explanation
1. Home Sheet
This acts as the index, providing six easy-to-use buttons that jump straight to the respective sheets within the workbook, making navigation effortless and intuitive.
Home Page
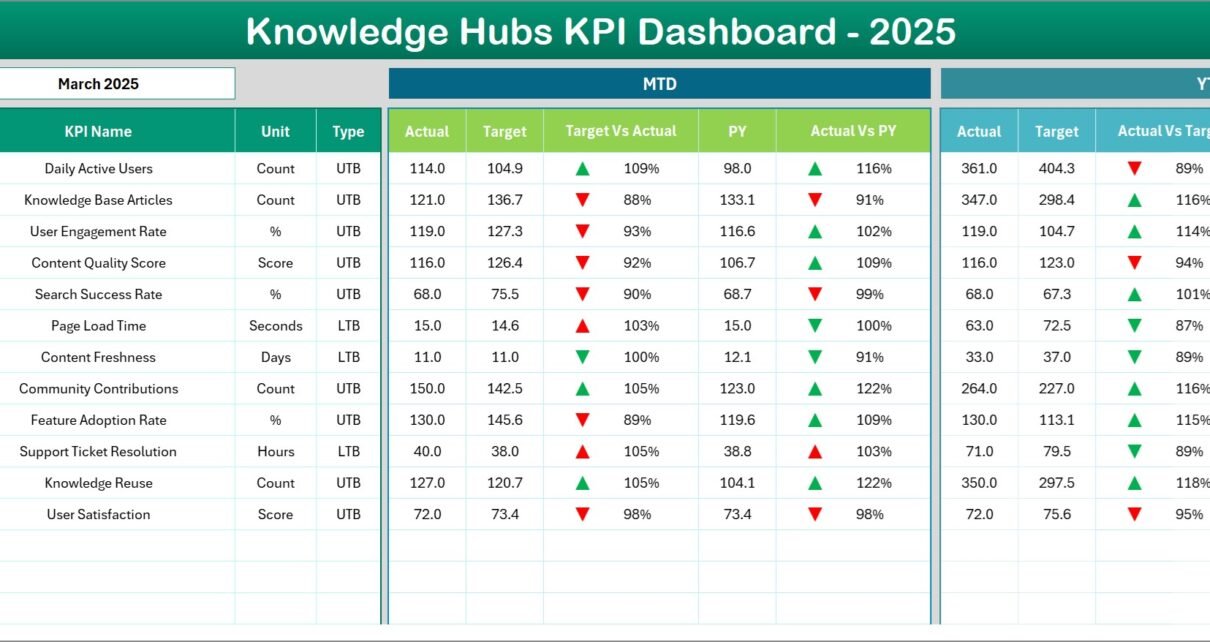
2. Dashboard Sheet Tab
This is the heart of the dashboard where all KPIs are displayed. Users can select the month via a dropdown (located at range D3), resulting in an instant update of dashboard numbers reflecting that month.
- Displays MTD Actual, Target, Previous Year data.
- Shows Target vs Actual and Previous Year vs Actual with conditional formatting featuring up/down arrows.
- Includes the YTD figures with the same comparative indicators.
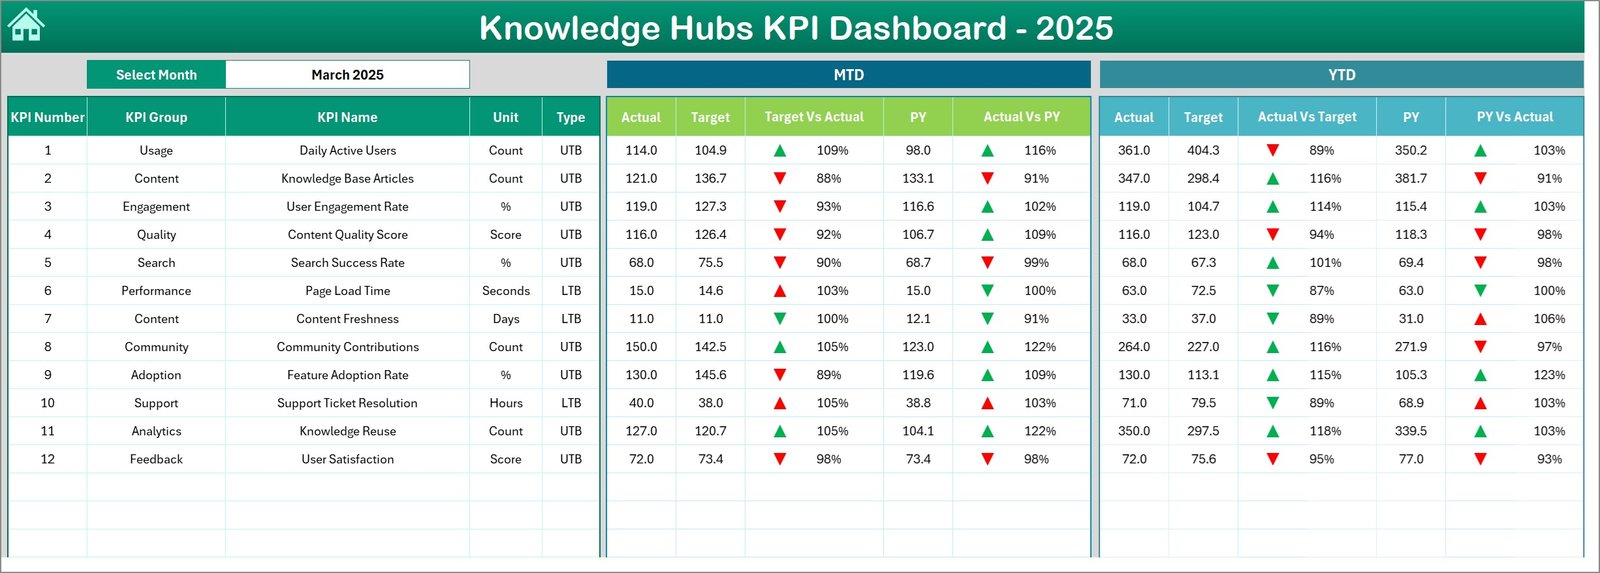
Knowledge Hubs KPI Dashboard
3. KPI Trend Sheet Tab
Allows selection of a specific KPI through a dropdown menu (at range C3). This sheet then provides detailed KPI information including:
- KPI Group
- Unit of Measure
- Type of KPI (Lower the Better or Upper the Better)
- Formula and Definition
The sheet also displays trend charts for MTD and YTD Actual, Target, and Previous Year values, helping users visualize KPI movements over time.
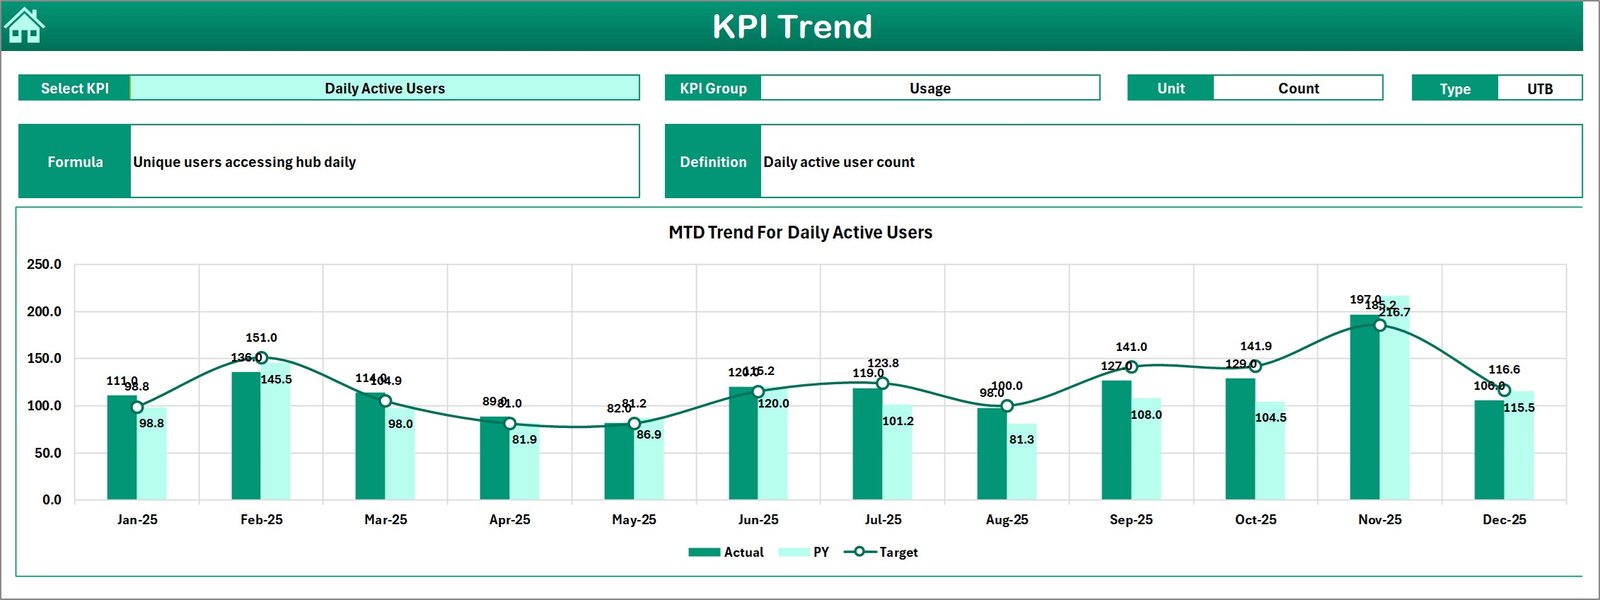
KPI Trend Sheet
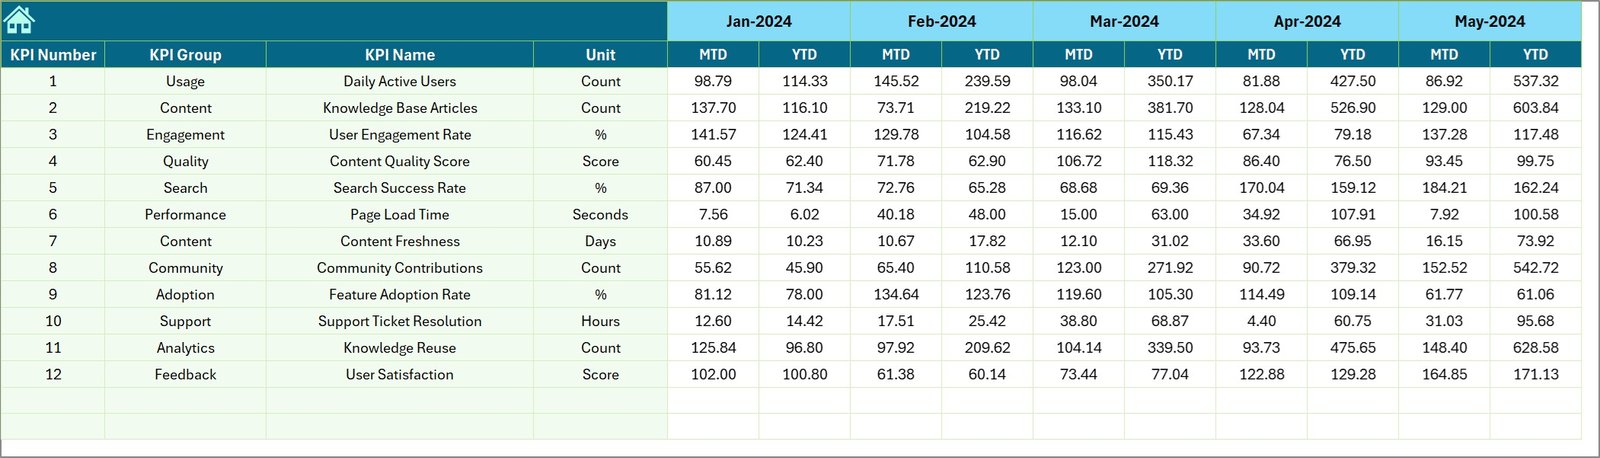
4. Actual Numbers Input Sheet
This is where users input the actual KPI numbers for both MTD and YTD periods. By setting the starting month of the year in cell E1, the dashboard dynamically adjusts its data accordingly.
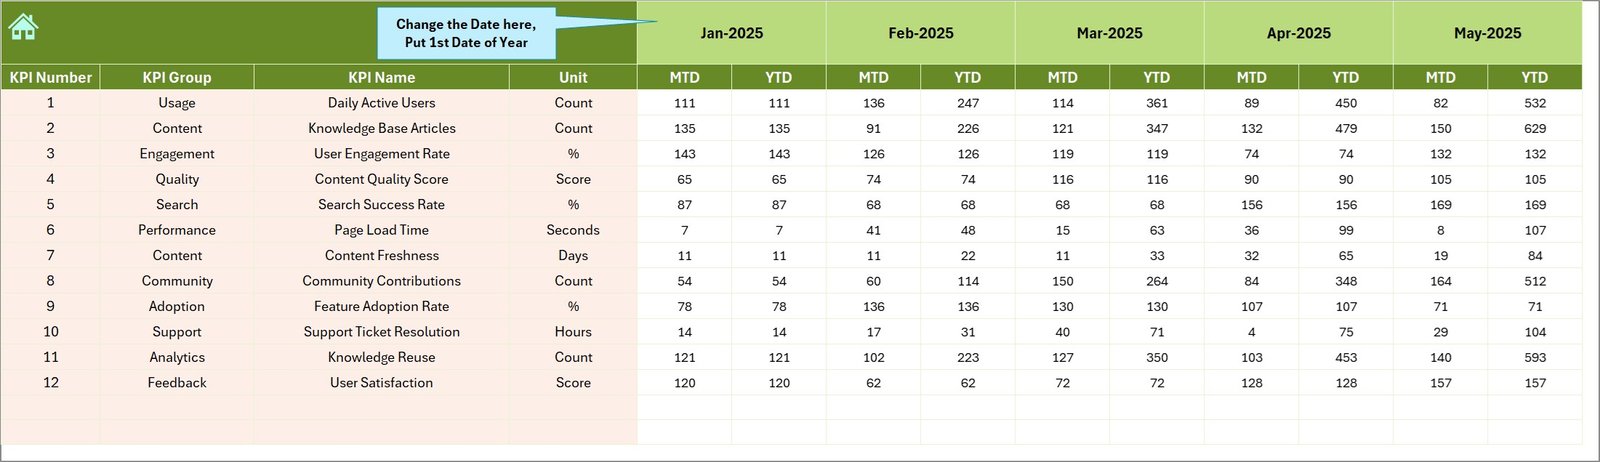
Actual Numbers Input sheet
5. Target Number Input Sheet
Users enter target KPI values for each month here, both for MTD and YTD, ensuring goal-oriented tracking and clear benchmark setting.
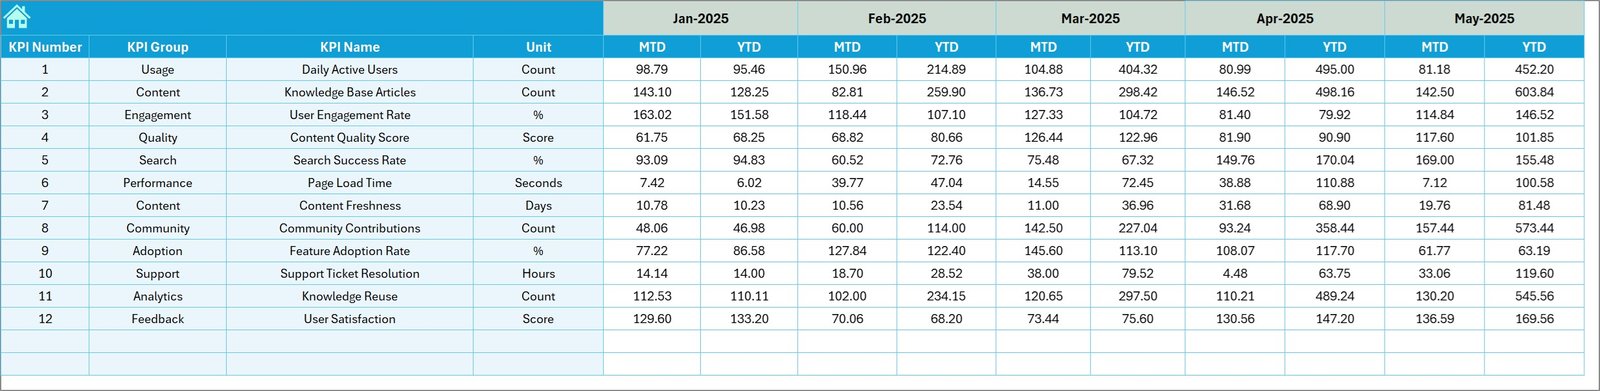
Target Number Input sheet
6. Previous Year Number Sheet Tab
Enter historical KPI numbers matching the current year’s structure for accurate comparison and trend analysis.
Previous Year Number Input sheet
7. KPI Definition Sheet Tab
Defines all KPIs by their name, grouping, unit, formula, full definition, and KPI type – whether lower is better (LTB) or upper is better (UTB). This provides clarity and ensures everyone understands what each KPI measures and how it is calculated.
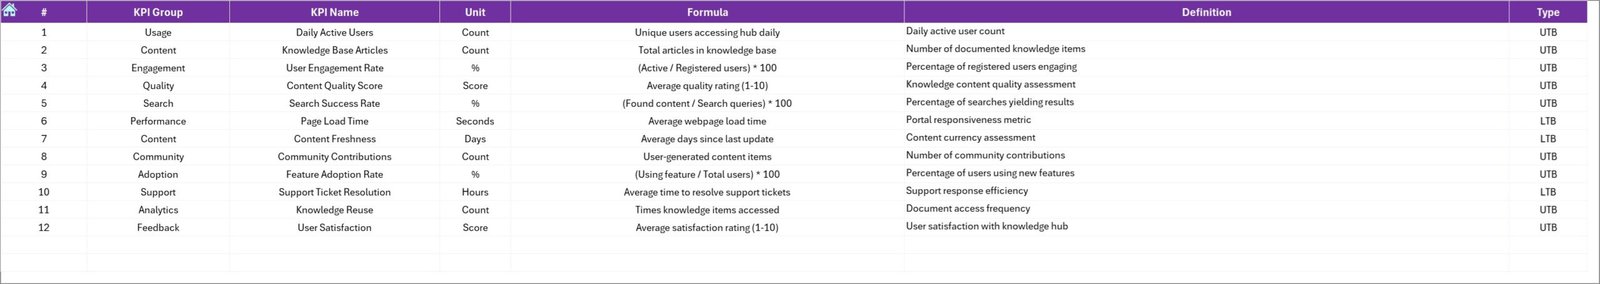
KPI Definition sheet
Advantages of Knowledge Hubs KPI Dashboard
- Time-Saving: Pre-built templates allow rapid deployment without starting from scratch.
- Clarity: Interactive visuals and conditional formatting highlight critical performance data.
- Customization: Easily modify months, KPIs, and input data to fit specific outsourced accounting requirements.
- Data Consistency: Centralizes data entry and definitions, reducing errors and improving data integrity.
- Enhanced Reporting: Visual trend analysis enhances the ability to spot issues and opportunities quickly.
Opportunities for Improvement
- Integrate automated data import from accounting software to reduce manual entry.
- Add more visualizations such as heat maps or KPI scorecards for diversified perspectives.
- Enable multi-user collaboration via cloud-based platforms for real-time updates.
- Include predictive analytics using historical trends to forecast future KPI performance.
Best Practices
- Keep KPI definitions updated and relevant to current business goals.
- Regularly review targets for realism and alignment with organizational strategy.
- Use the trend analysis sheet frequently to proactively manage performance.
- Train all users on how to input data correctly to maintain accuracy.
- Backup the dashboard regularly to avoid data loss.
FAQs
Can this dashboard be customized for different industries?
Yes, while designed for outsourced accounting KPIs, the dashboard structure is flexible enough to adapt to other industries with appropriate KPI adjustments.
Do I need advanced Excel skills to use this dashboard?
The dashboard is user-friendly and designed for ease of use. Basic Excel skills suffice, especially as data input points and dropdowns guide the process.
How often should I update the actual and target numbers?
It’s best practice to update actuals monthly or as frequently as data is available, and review targets annually or quarterly depending on your planning cycles.
Can the dashboard be linked with external data sources?
Currently, it is a manual entry system, but with Excel’s Power Query or similar tools, linking external accounting databases is possible with some setup.
Click to Purchases Knowledge Hubs KPI Dashboard in Excel
Conclusion
The Knowledge Hubs KPI Dashboard is a powerful tool tailored for tracking outsourced accounting performance metrics. It simplifies complex data, enhances visibility, and helps organizations make data-driven decisions effectively. By leveraging its intuitive sheets and dynamic visuals, accounting teams can monitor progress, identify trends, and stay aligned with targets effortlessly.
Elevate your KPI tracking to the next level with this all-in-one dashboard designed to save time, increase accuracy, and drive better business outcomes.
Click to Purchases Knowledge Hubs KPI Dashboard in Excel
For further assistance and demos, visit reliable resources like the Microsoft Excel support center for advanced dashboard tips and tutorials.
Visit our YouTube channel to watch the demo: Youtube.com/@NextGenTemplates