Introduction
The Business Valuation KPI Dashboard is a comprehensive, ready-to-use Excel template designed specifically for outsourced accounting KPIs. This dashboard enables businesses to effectively track, analyze, and benchmark critical key performance indicators (KPIs) related to business valuation. By offering an interactive interface and detailed visual insights, it simplifies decision-making and performance monitoring.
Click to Purchases Business Valuation KPI Dashboard in Excel
Key Features of Business Valuation KPI Dashboard
- Seven dedicated worksheets for streamlined navigation and data management.
- Dynamic month selection allowing for real-time updates across all KPIs.
- Conditional formatting with up/down arrows to quickly compare actuals with targets and previous year data.
- Trend analysis and visual charting capabilities for deeper insights into KPI performance.
- Easy input sheets for Actual, Target, and Previous Year data to keep the dashboard current.
- Comprehensive KPI definitions, formulas, and classification to support better understanding.
- User-friendly navigation with buttons for quick access to each key worksheet.
Dashboard Pages Explanation
-
Home Sheet
This is the index sheet featuring six buttons that serve as quick navigation shortcuts to the other sheets within the workbook. It provides a starting point for users to easily explore the dashboard components and ensures smooth workflow management.

Home Page
-
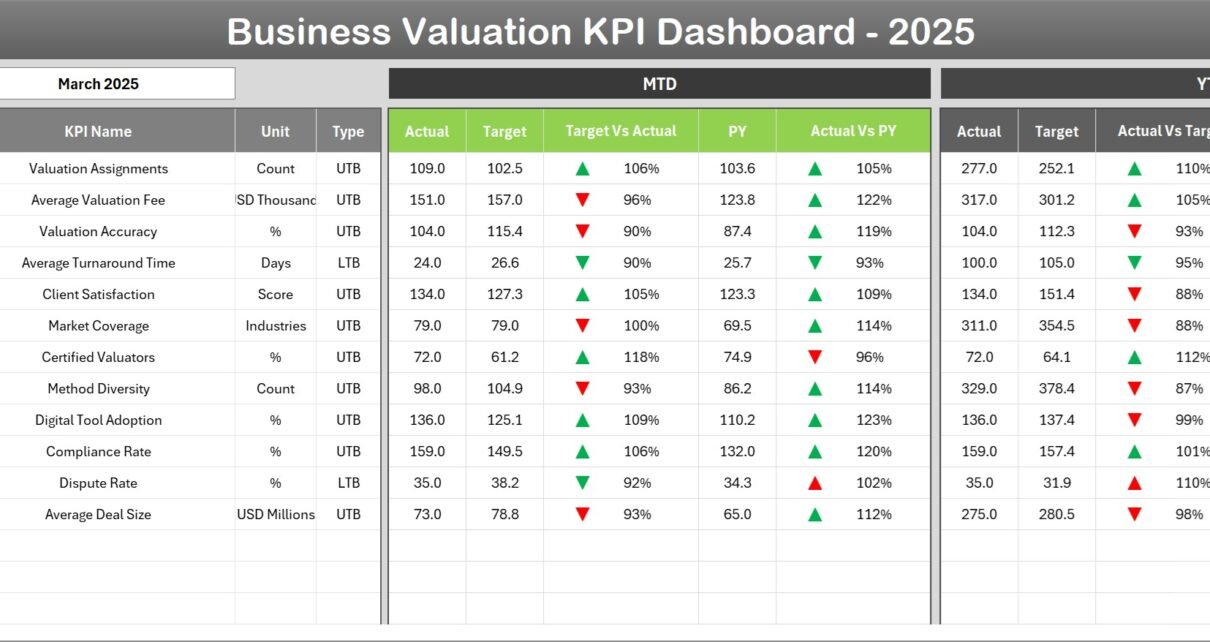
Dashboard Sheet Tab
This main dashboard consolidates all KPI information in one place. Users can select the month via the dropdown in cell D3, immediately updating the data for that period.
The dashboard displays:
- MTD (Month To Date) Actual, Target, and Previous Year values.
- Comparison of Target vs Actual and Previous Year vs Actual with intuitive conditional formatting arrows indicating performance.
- YTD (Year To Date) Actual, Target, and Previous Year data alongside the same comparative visuals.
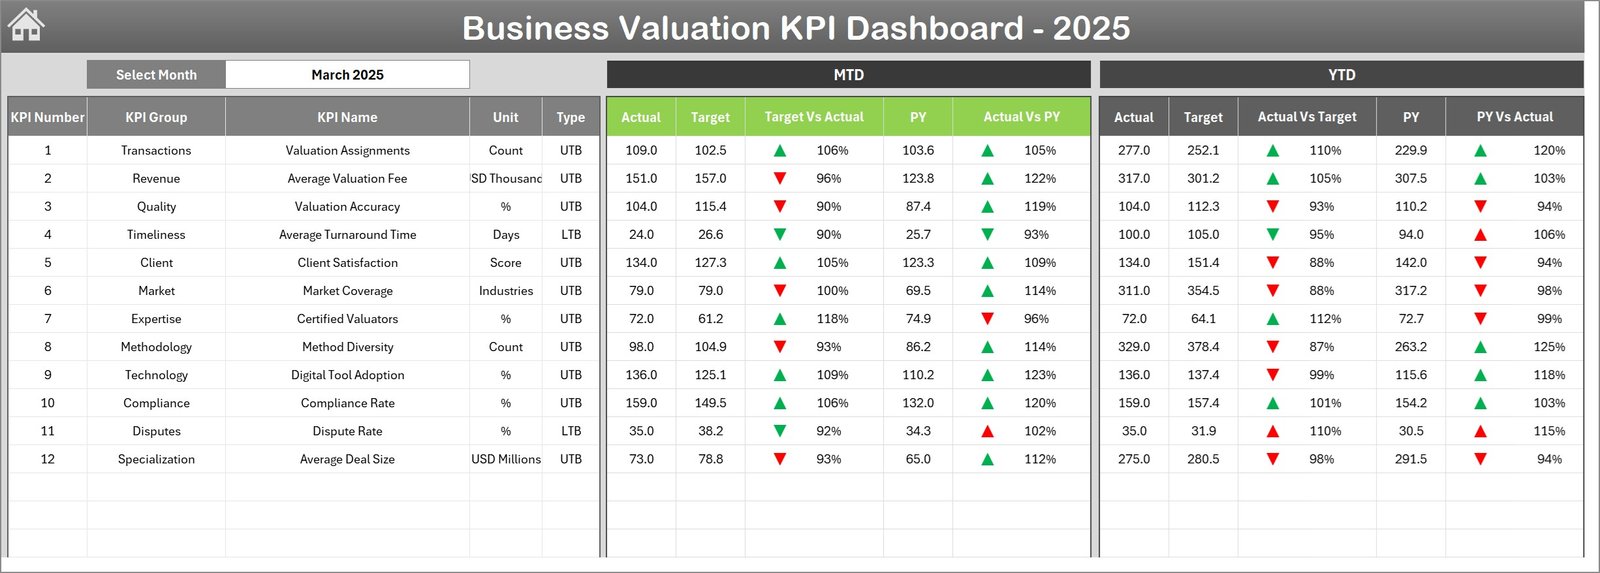
Business Valuation KPI Dashboard
-
KPI Trend Sheet Tab
This sheet lets the user select a specific KPI using the dropdown at cell C3. It presents valuable metadata for the KPI including:
- KPI Group
- Unit of measure
- Type of KPI (Lower the Better or Upper the Better)
- Formula defining the KPI
- Detailed KPI definition
The core of this sheet is the trend chart showing MTD and YTD values for Actual, Target, and Previous Year, helping users analyze performance trends over time.
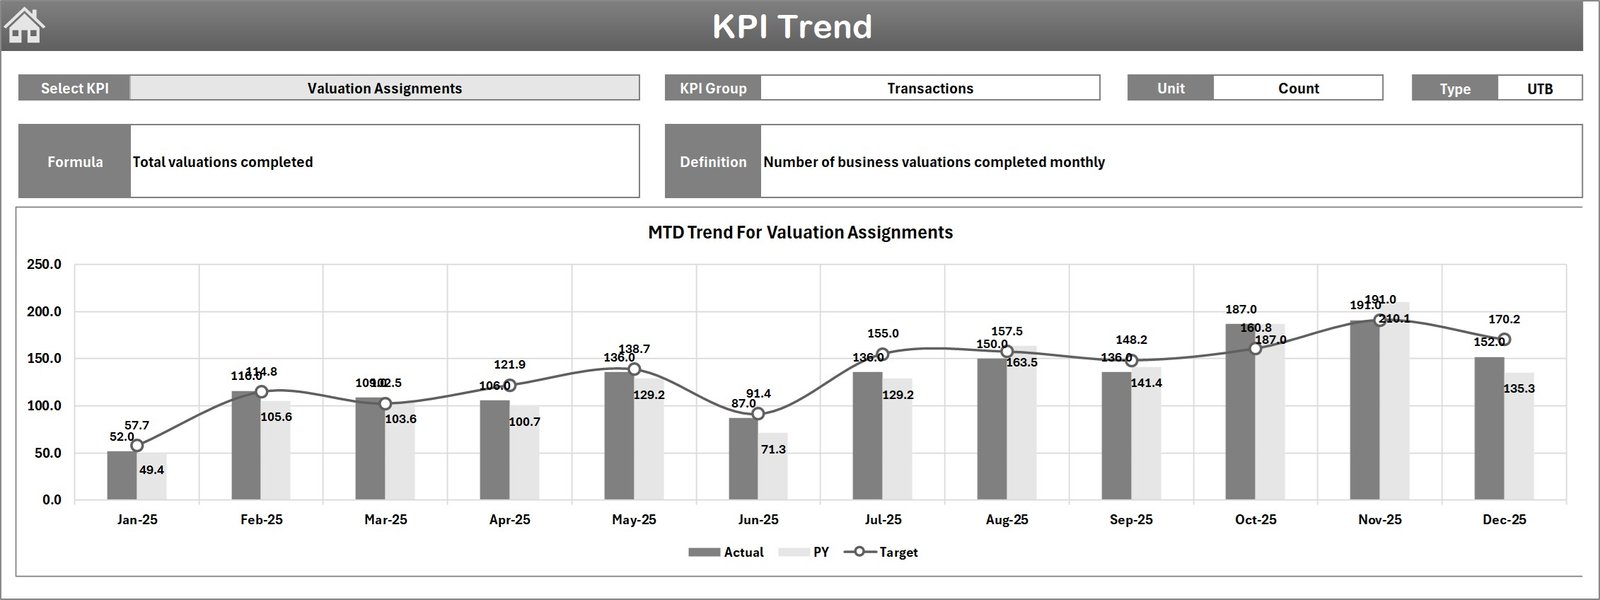
KPI Trend Sheet
-
Actual Numbers Input Sheet
This sheet allows users to input the actual KPI numbers for MTD and YTD periods for any selected month. The starting month can be changed in cell E1, which makes this sheet adaptable for different fiscal years.

Actual Numbers Input sheet
-
Target Number Input Sheet
In this tab, users input the target numbers for each KPI, both for MTD and YTD periods. This information drives the targets displayed across the dashboard, setting benchmarks for performance evaluation.
-

Target Number Input sheet
-
Previous Year Number Sheet Tab
Users enter the corresponding previous year KPI numbers here for comparative analysis. Having last year’s data helps understand growth trends and seasonality.

Previous Year Number Input sheet
-
KPI Definition Sheet Tab
This sheet is the cornerstone for defining KPIs. Users enter:
- KPI Name
- KPI Group
- Unit
- Formula
- Definition
- KPI type, entered as LTB (Lower The Better) or UTB (Upper The Better)

KPI Definition sheet
Advantages of Business Valuation KPI Dashboard
- Centralized Data Management: All KPI-related data, including actuals, targets, and historical information, is consolidated in one interactive dashboard.
- Dynamic Reporting: Month selection and drop-down options enable detailed period-based analysis.
- Visual Insights: Conditional formatting with arrows and trend charts allow quick evaluation of performance.
- Customizable KPIs: Easy to add, modify, or redefine KPIs to suit specific business requirements.
- Efficient Decision-Making: Intuitive layout reduces time spent on manual calculations and reporting.
- Collaboration-Friendly: Ideal for outsourced accounting teams to monitor KPIs and deliver insights to clients seamlessly.
-
Click to Purchases Business Valuation KPI Dashboard in Excel
Opportunities for Improvement
- Integrate automated data connections to reduce manual entry and errors.
- Develop mobile-friendly versions for on-the-go KPI monitoring.
- Include predictive analytics features using historical data trends.
- Enhance visualization with customizable charts and drill-down capabilities.
- Add user permission settings to control access and editing rights.
Best Practices
- Regularly update the actual, target, and previous year numbers to maintain accuracy.
- Use the KPI definition sheet to keep all stakeholders aligned on KPI meanings and formulas.
- Leverage the trend charts to identify patterns and adjust strategies accordingly.
- Utilize the dashboard’s navigation buttons to switch sheets efficiently and avoid errors.
- Educate your finance and accounting teams on interpreting conditional formatting and KPI types (LTB vs UTB).
FAQs
What KPIs does this dashboard track for business valuation?
The dashboard is customizable but commonly tracks financial ratios, profitability metrics, growth percentages, efficiency ratios, and other valuation-related KPIs defined in the KPI Definition sheet.
Is this template suitable for non-accountants?
Yes, the intuitive layout with clear KPI definitions and visual cues makes it user-friendly for finance, accounting, and business management professionals.
Can I add new KPIs to this dashboard?
Absolutely. The KPI Definition sheet allows you to add new KPIs with their respective groups, formulas, units, and definitions.
How do I interpret the conditional formatting up/down arrows?
The arrows indicate performance status: an up arrow usually signifies performance above target or improvement, while a down arrow signals performance below target or decline, adjusted for KPI type (LTB or UTB).
Does the dashboard support multiple years of data?
Currently, it primarily supports current year month-to-date and year-to-date data along with previous year comparisons, but with modifications, it can be expanded for multiple years.
Conclusion
Click to Purchases Business Valuation KPI Dashboard in Excel
The Business Valuation KPI Dashboard is a powerful tool tailored for outsourced accounting teams to monitor business performance efficiently. With its dynamic selection features, straightforward input sheets, and insightful visualizations, businesses can streamline their KPI tracking and make more informed valuation decisions. By adopting best practices and taking advantage of the defined structures, companies ensure alignment and clarity in their financial analysis.
For further information on Excel dashboard best practices and KPI management, you may visit Microsoft’s official guide on Excel Support.
Visit our YouTube channel to watch the demo: Youtube.com/@NextGenTemplates
Watch the step-by-step video tutorial: