Introduction
Diversity and Inclusion are vital components of a progressive workplace. To track and improve these efforts effectively, organizations require a robust measurement tool. This is where the Diversity and Inclusion KPI Scorecard comes in. Our ready-to-use Scorecard template helps monitor and analyze key performance indicators (KPIs) related to diversity and inclusion initiatives, enabling informed decision-making and driving positive change.
Click to Purchases Diversity and Inclusion KPI Scorecard in Excel
Key Features of Diversity and Inclusion KPI Scorecard
- Four Interactive Worksheets: Comprehensive layout including Scorecard, KPI Trend, Input Data, and KPI Definition sheets.
- Dynamic Data Selection: Easily analyze Month-to-Date (MTD), Year-to-Date (YTD), or specific monthly performance via dropdown menus.
- Actual vs Target Comparisons: Track real-time performance metrics against predefined targets for accuracy.
- Visual Performance Indicators: Use of color-coded highlights and conditional formatting for instant status understanding.
- KPI Details and Definitions: Clear display of KPIs’ units, formulas, and definitions to ensure transparency.
- Trend Analysis: Access historical perspective using trend charts to measure progress over time.
Dashboard Pages Explanation
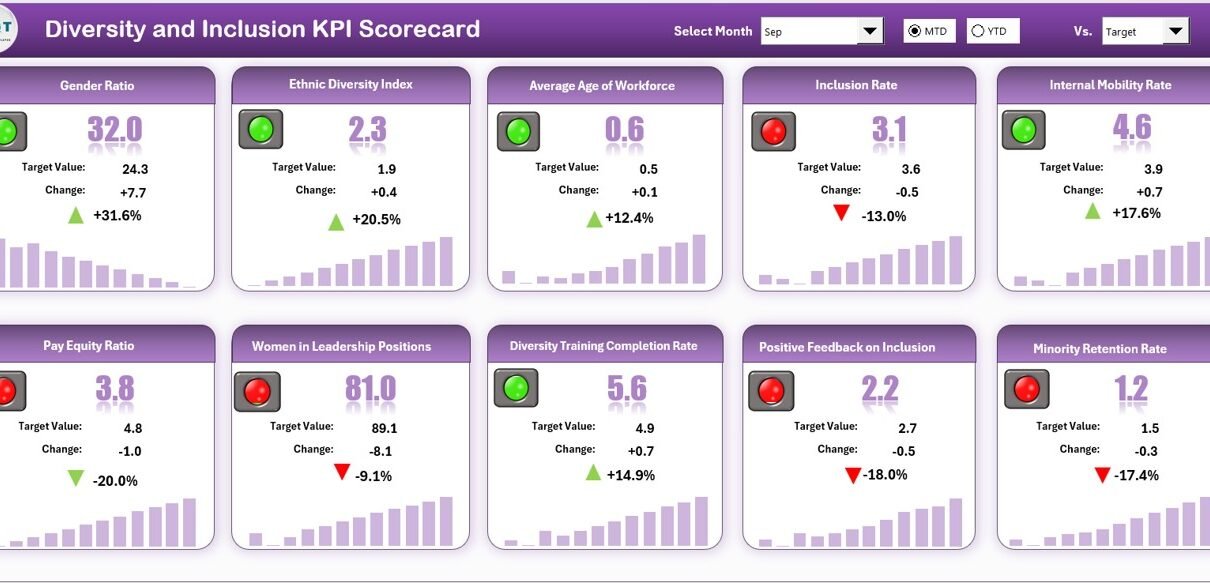
1. Scorecard Sheet
The Scorecard sheet serves as the main interface for monitoring Diversity and Inclusion KPI performance.
- Dropdown Menus: Choose between monthly, MTD, or YTD data views to customize your analysis.
- Actual vs Target Values: Instantly compare real results against targets to spot gaps.
- Visual Indicators: Color-coded visuals enable quick identification of performance status.
- Comprehensive KPI Overview: Easily see all KPIs with MTD and YTD benchmarks for thorough insights.
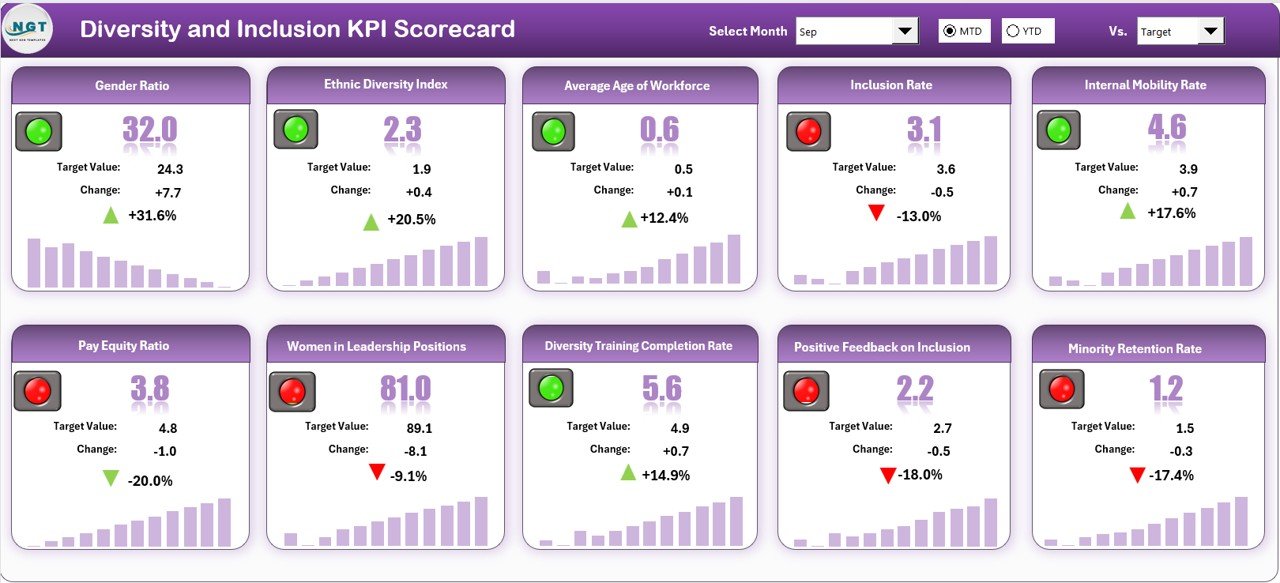
Diversity and Inclusion KPI Scorecard
2. KPI Trend Sheet
This tab allows users to select any KPI from a dropdown in cell C3. Key details displayed include KPI Group, Unit, Type (Lower the Better or Upper the Better), Formula, and Definition for clarity.
The sheet also features trend charts visualizing MTD and YTD actual, target, and previous year (PY) numbers to evaluate progress.
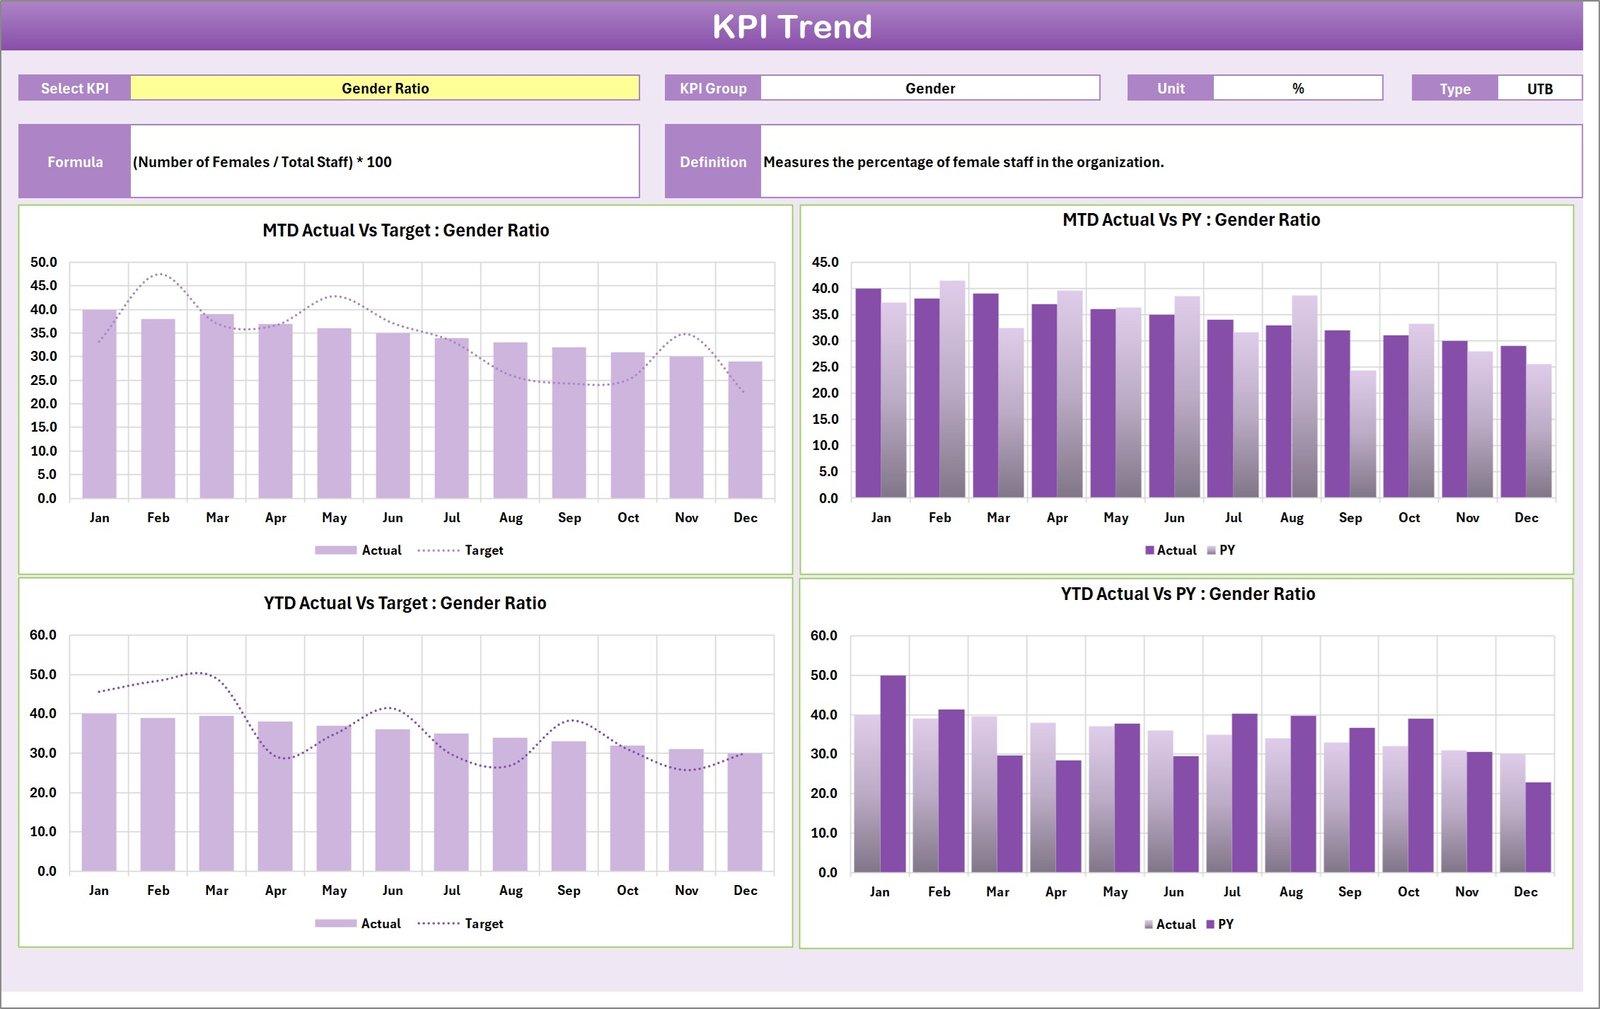
KPI Trend Sheet
3. Input Data Sheet
The Input Data sheet is where organizations input all relevant KPI data, including actual values and targets. This sheet ensures all data is current and allows for flexible updates as new information becomes available.
- Data Entry: Record actual performance, targets, and any additional metrics for each KPI efficiently.
- Flexibility: Easily update your data without hassle to maintain the Scorecard’s accuracy.
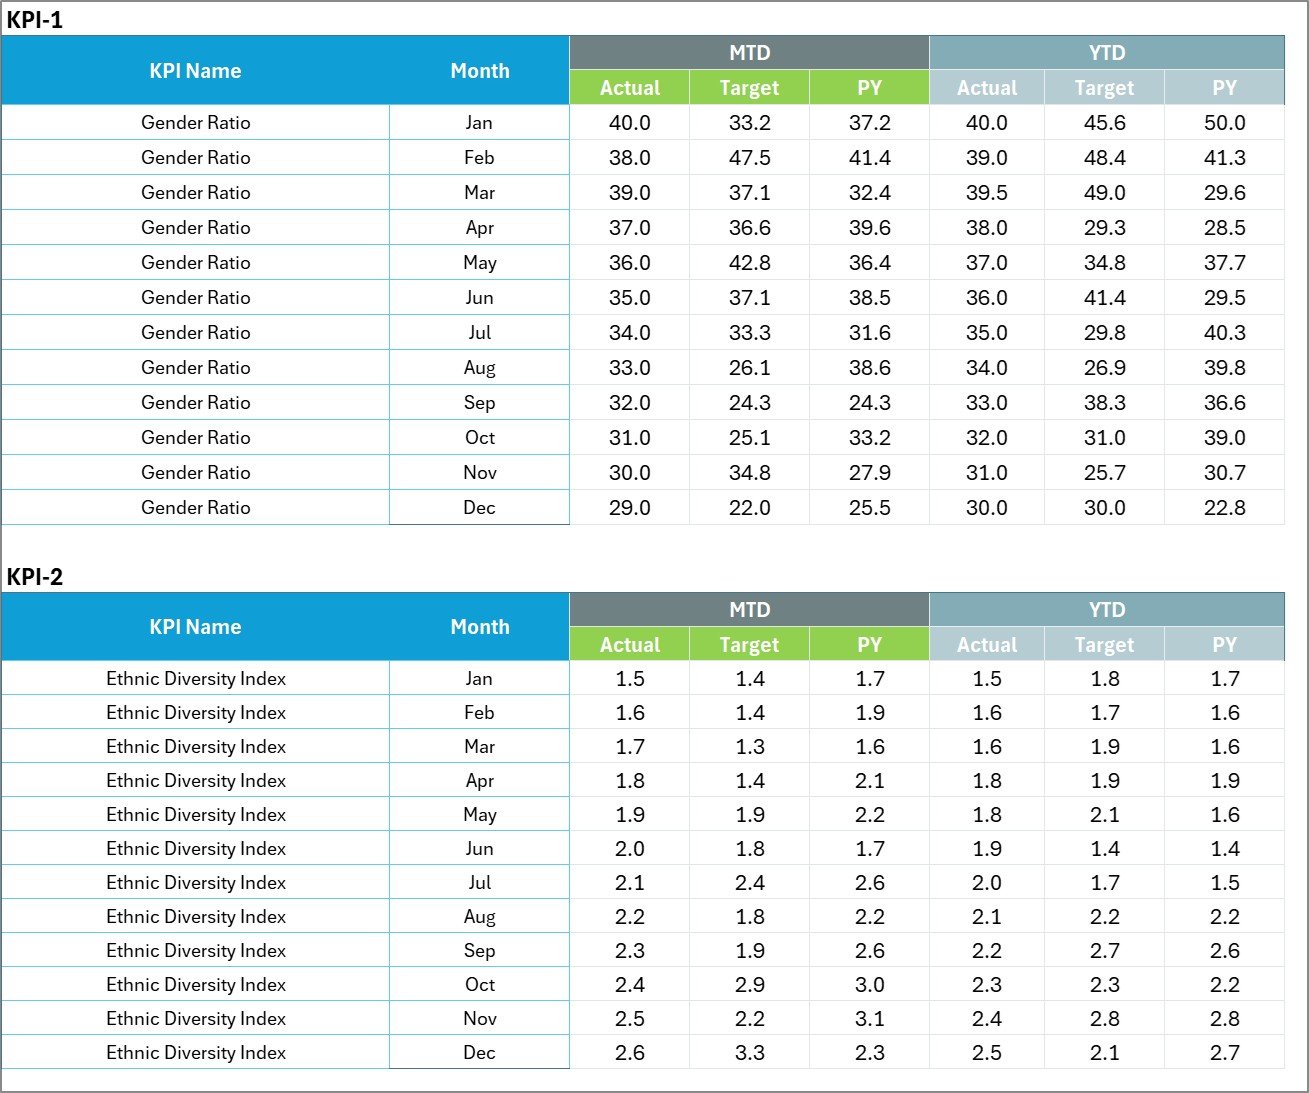
Input Data Sheet
4. KPI Definition Sheet Tab
This tab allows users to define each KPI in detail by entering the KPI Name, KPI Group, Unit of Measurement, Formula, and an explanatory Definition. This information is critical for ensuring everyone understands what each KPI measures and how.
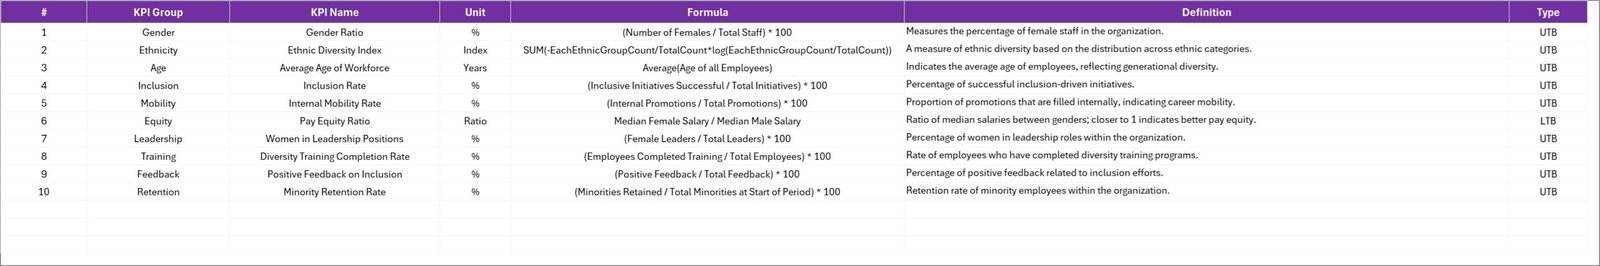
KPI Definition sheet tab
Advantages of Diversity and Inclusion KPI Scorecard
- Clarity and Transparency: Clearly showcases performance status and benchmarks.
- Actionable Insights: Helps identify areas requiring attention or improvement.
- Customizability: Flexible to accommodate diverse organizational needs and KPI sets.
- Data-Driven Decisions: Empowers leadership to make informed decisions based on reliable metrics.
- Encourages Accountability: With clear targets and real-time data, teams stay responsible for results.
Opportunities for Improvement
- Integrate automated data import features from HR or ERP systems for real-time updates.
- Expand visual analytics with interactive dashboards using Power BI or Tableau.
- Include qualitative feedback mechanisms to complement quantitative KPIs.
- Implement predictive analytics to forecast diversity trends and proactively manage inclusion initiatives.
Best Practices
- Regular Updates: Keep input data current to reflect the latest performance.
- Clear KPI Definitions: Ensure all stakeholders understand KPI meaning and calculation.
- Engage Multiple Departments: Diversity is cross-functional; involve HR, management, and operational teams.
- Review Trends Often: Use KPI trends to celebrate successes and address dips quickly.
- Customize Thoughtfully: Adapt KPIs and targets to align with organizational goals and culture.
FAQs
What KPIs are typically included in a Diversity and Inclusion Scorecard?
Common KPIs include workforce diversity by gender, age, ethnicity, inclusion index scores, hiring and promotion rates, and employee engagement metrics.
Can this Scorecard be customized for different organizations?
Yes, the template is fully adaptable to fit unique organizational structures, KPIs, and reporting requirements.
How often should the Diversity and Inclusion KPI Scorecard be updated?
Ideally, data should be updated monthly or as new information becomes available to provide timely insights.
Is technical expertise required to use this Scorecard?
Basic Excel skills are sufficient. The template’s user-friendly interface and dropdown menus simplify navigation and data entry.
Click to Purchases Diversity and Inclusion KPI Scorecard in Excel
Conclusion
Tracking diversity and inclusion is essential for fostering equitable workplaces. Our Diversity and Inclusion KPI Scorecard offers a comprehensive, easy-to-use tool that brings clarity and insight to your diversity efforts. From real-time scorecards to detailed trend analyses and customizable KPI definitions, this template is designed to empower organizations to measure, understand, and enhance diversity and inclusion effectively.
For further guidance and a hands-on walkthrough, visit the official Microsoft documentation on KPI and Data Visualization.
Visit our YouTube channel to watch the demo: Youtube.com/@NextGenTemplates