In today’s digital media industry, content licensing has become a major revenue source for companies that produce movies, music, digital content, courses, podcasts, and other intellectual properties. Businesses constantly license their content to multiple platforms such as streaming services, broadcasting networks, educational portals, and digital marketplaces. However, managing licensing agreements, tracking costs, monitoring royalties, and analyzing profits across regions and platforms often becomes complicated.
Therefore, organizations increasingly rely on data-driven dashboards to monitor licensing performance in real time. One of the most powerful tools for this purpose is Power BI, which helps businesses transform raw data into meaningful insights through interactive visualizations.
The Content Licensing Dashboard in Power BI is a ready-to-use analytical solution that helps organizations monitor licensing revenue, track costs, analyze profitability, and evaluate performance across content types, regions, platforms, and time periods. Instead of manually reviewing multiple reports, decision-makers can quickly view key metrics through charts, KPI cards, and dynamic filters.
Moreover, this dashboard allows media companies, content creators, streaming platforms, and digital publishers to understand where their revenue comes from and how efficiently their content licensing operations perform.
In this article, we will explore the Content Licensing Dashboard in Power BI, its structure, features, advantages, best practices, and frequently asked questions.
Click to buy Content Licensing Dashboard in Power BI
What is a Content Licensing Dashboard in Power BI?
A Content Licensing Dashboard in Power BI is an interactive data visualization tool that helps organizations monitor licensing-related financial and operational metrics. It consolidates information such as licensing revenue, marketing costs, delivery costs, royalty payments, and profit margins into a centralized dashboard.
Instead of analyzing scattered spreadsheets or manual reports, businesses can use this dashboard to gain clear insights into content performance across multiple licensing channels.
For example, companies can analyze:
- Which content types generate the highest revenue
- Which platforms provide the best profit margins
- How marketing costs impact profitability
- Which regions produce the highest licensing fees
- How monthly trends affect overall licensing performance
Because Power BI provides dynamic filtering and interactive charts, users can quickly drill down into specific details and identify opportunities to increase revenue.
Why Do Businesses Need a Content Licensing Dashboard?
Content licensing involves several moving parts. Companies must manage contracts, monitor royalties, track costs, and evaluate profitability across multiple channels.
However, manual reporting often creates several challenges:
- Data remains scattered across spreadsheets
- Teams struggle to track profitability by platform
- Managers cannot easily identify top-performing content
- Decision-makers lack real-time insights
Therefore, organizations need a centralized analytics solution.
A Content Licensing Dashboard in Power BI solves these challenges by providing:
- Real-time performance monitoring
- Centralized licensing data
- Visual insights through interactive charts
- Faster decision-making capabilities
As a result, businesses can optimize their licensing strategies and improve overall profitability.
Key Features of the Content Licensing Dashboard in Power BI
The Content Licensing Dashboard in Power BI includes five interactive analytical pages, each designed to analyze licensing performance from a different perspective.
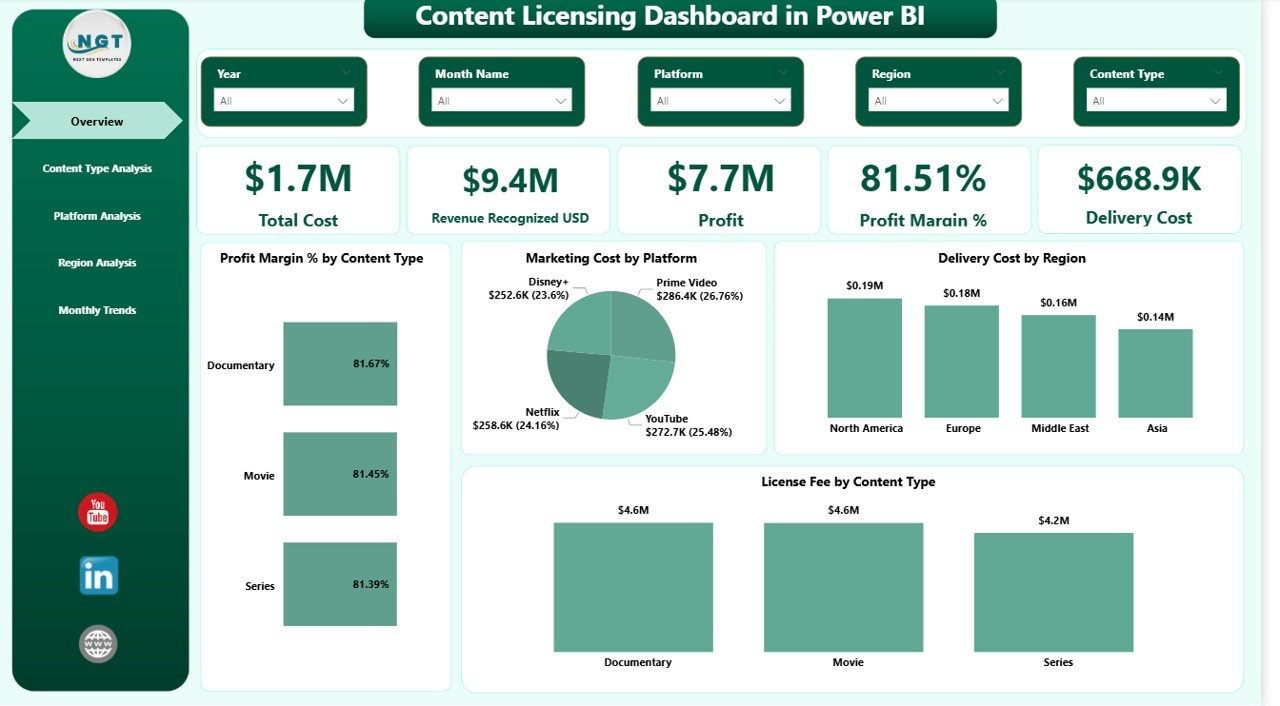
Overview Page – Quick Performance Snapshot
The Overview Page serves as the main page of the dashboard. It provides a quick summary of overall licensing performance using key performance indicators and charts.
This page includes slicers that allow users to filter data dynamically based on different parameters.
KPI Cards Displayed
The dashboard shows five key KPI cards:
- Total Cost
- Revenue Recognized (USD)
- Profit
- Profit Margin (%)
- Delivery Cost
These KPIs provide an instant overview of financial performance.
Charts Available on the Overview Page
The page includes four analytical charts:
- Profit Margin (%)
- Marketing Cost by Platform
- Delivery Cost by Region
- License Fee by Content Type
Because these charts appear on the main page, decision-makers can immediately understand overall licensing performance.
Click to buy Content Licensing Dashboard in Power BI
Content Type Analysis – Which Content Performs Best?
Different types of content generate different levels of revenue. Therefore, businesses must analyze which content categories perform best in licensing agreements.
The Content Type Analysis Page provides insights into performance across various content categories.
Charts in Content Type Analysis
This page includes four charts:
- Marketing Cost by Content Type
- Profit by Content Type
- Total Cost by Content Type
- Revenue Recognized (USD) by Content Type
These charts help businesses determine which content types generate the highest return on investment.
For example, a company may discover that documentaries generate higher profit margins than entertainment shows, allowing them to adjust their licensing strategy accordingly.

Click to buy Content Licensing Dashboard in Power BI
Platform Analysis – Which Platforms Generate the Most Profit?
Content licensing often involves multiple platforms such as:
- Streaming services
- Digital marketplaces
- Broadcasting networks
- Online learning platforms
Each platform may have different revenue models, royalty structures, and marketing costs.
The Platform Analysis Page helps organizations analyze performance across these platforms.
Charts in Platform Analysis
This page includes four charts:
- License Fee by Platform
- Total Cost by Platform
- Royalty Paid by Platform
- Profit by Platform
Using this analysis, companies can identify which platforms deliver the best returns and focus their licensing efforts accordingly.

Click to buy Content Licensing Dashboard in Power BI
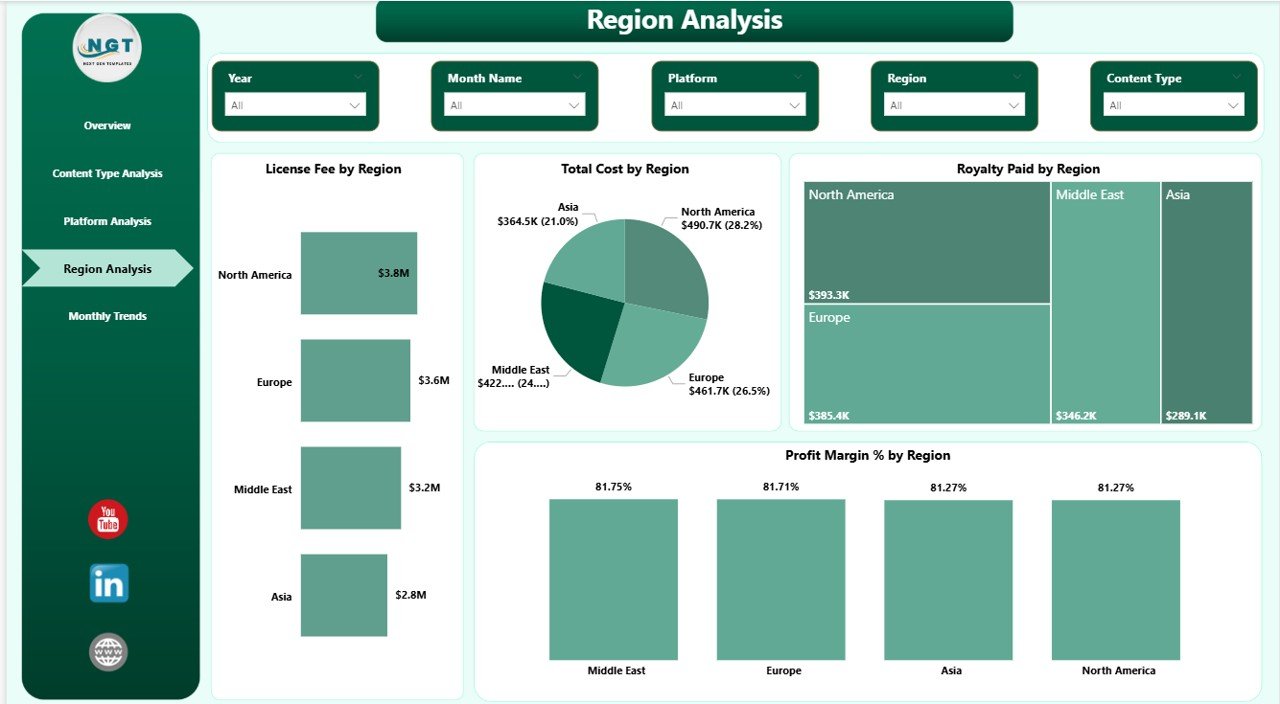
Region Analysis – How Does Licensing Perform Across Regions?
Content licensing often expands across multiple geographic regions such as:
- North America
- Europe
- Asia-Pacific
- Middle East
- Latin America
However, revenue and licensing demand may vary significantly between regions.
The Region Analysis Page helps businesses analyze geographic performance.
Charts in Region Analysis
This page includes four charts:
- License Fee by Region
- Total Cost by Region
- Royalty by Region
- Profit Margin (%) by Region
Through these insights, organizations can identify regions that produce the highest licensing revenue and adjust their distribution strategies.
Click to buy Content Licensing Dashboard in Power BI
Month Analysis – Understanding Monthly Trends
Tracking monthly trends plays a crucial role in content licensing management. Seasonal demand, marketing campaigns, and platform releases can significantly affect licensing revenue.
Therefore, the Month Analysis Page helps businesses monitor performance over time.
Charts in Month Analysis
This page includes three charts:
- Delivery Cost by Month
- License Fee by Month
- Profit Margin (%) by Month
These charts allow managers to identify seasonal trends and evaluate the impact of marketing strategies.

Click to buy Content Licensing Dashboard in Power BI
Advantages of Content Licensing Dashboard in Power BI
Organizations gain several benefits by implementing a Content Licensing Dashboard in Power BI.
- Centralized Data Management
The dashboard consolidates licensing data from multiple sources into a single platform. As a result, managers no longer need to analyze multiple spreadsheets.
- Real-Time Insights
Power BI updates data dynamically, which means decision-makers can track performance in real time.
- Improved Profitability Analysis
The dashboard helps organizations evaluate costs, royalties, and revenue simultaneously. Therefore, businesses can identify opportunities to improve profit margins.
- Better Strategic Decisions
Because the dashboard provides visual insights, executives can quickly identify high-performing platforms, content types, and regions.
- Enhanced Operational Efficiency
Automation reduces manual reporting work. Consequently, teams can focus on strategic planning instead of data preparation.
Opportunities for Improvement in Content Licensing Analytics
Although dashboards significantly improve visibility, organizations can still enhance their licensing analytics strategies.
Integrate Real-Time Data Sources
Companies should connect their dashboard to real-time databases, CRM systems, and licensing platforms.
Implement Predictive Analytics
Organizations can use predictive models to forecast licensing revenue and demand trends.
Automate Reporting
Automated reporting reduces manual effort and improves reporting accuracy.
Include Performance Alerts
Power BI alerts can notify managers when KPIs fall below targets.
Best Practices for the Content Licensing Dashboard in Power BI
To maximize the effectiveness of the dashboard, organizations should follow several best practices.
- Define Clear KPIs
Before building the dashboard, companies should identify key performance indicators such as:
- Licensing revenue
- Marketing cost
- Royalty payments
- Profit margin
- Delivery cost
- Use Consistent Data Sources
Data consistency ensures accurate reporting. Therefore, organizations should standardize data collection processes.
- Keep Dashboard Design Simple
Simple visualizations improve readability. Avoid overcrowding the dashboard with unnecessary charts.
- Use Interactive Filters
Slicers allow users to explore data dynamically. Therefore, dashboards should include filters for:
- Region
- Platform
- Content Type
- Month
- Review Dashboard Performance Regularly
Organizations should continuously update the dashboard based on changing business requirements.
How Can Businesses Use a Content Licensing Dashboard?
Businesses can use the dashboard in several practical ways.
Strategic Planning
Executives can evaluate which platforms generate the most revenue and allocate resources accordingly.
Marketing Optimization
Marketing teams can analyze marketing costs across platforms and content types.
Financial Monitoring
Finance teams can track profitability and monitor cost structures.
Content Strategy Development
Content teams can identify which content types perform best and plan future productions accordingly.
Conclusion
The Content Licensing Dashboard in Power BI provides a powerful solution for organizations that manage digital content licensing across multiple platforms and regions. Instead of relying on manual reports, businesses can monitor licensing performance through interactive charts, KPI cards, and dynamic filters.
Moreover, the dashboard helps companies analyze revenue, costs, royalties, and profit margins in a structured and visual format. Because decision-makers can quickly identify trends and performance gaps, they can make smarter strategic decisions.
As the digital content industry continues to grow, organizations must adopt data-driven tools to remain competitive. Therefore, implementing a Content Licensing Dashboard in Power BI becomes an essential step toward improving licensing efficiency, maximizing revenue, and achieving long-term business success.
Frequently Asked Questions (FAQs)
What is a Content Licensing Dashboard?
A Content Licensing Dashboard is a data visualization tool that helps organizations monitor licensing revenue, costs, royalties, and profitability across platforms, regions, and content types.
Why should companies use Power BI for content licensing analytics?
Power BI provides interactive charts, dynamic filters, and real-time analytics. Therefore, businesses can quickly analyze licensing performance and make data-driven decisions.
What KPIs are included in a Content Licensing Dashboard?
Common KPIs include:
- Total Cost
- Revenue Recognized
- Profit
- Profit Margin
- Delivery Cost
Who can benefit from a Content Licensing Dashboard?
Several professionals can benefit from this dashboard:
- Media companies
- Streaming platforms
- Content creators
- Digital publishers
- Marketing agencies
Can the dashboard track licensing performance across regions?
Yes. The Region Analysis page allows users to analyze licensing revenue, costs, royalties, and profit margins across different geographic regions.
Watch the step-by-step video tutorial:
Visit our YouTube channel to learn step-by-step video tutorials
Click to buy Content Licensing Dashboard in Power BI