Modern agriculture depends heavily on advanced machinery such as tractors, harvesters, seeders, sprayers, and other farming equipment. Manufacturers of agricultural equipment must constantly monitor production performance, control manufacturing costs, maintain product quality, and deliver orders on time. However, when production teams rely on scattered spreadsheets or manual reports, they often struggle to track production metrics efficiently.
Therefore, companies increasingly adopt structured dashboards that transform raw production data into clear insights. One powerful solution for this purpose is the Agricultural Equipment Production Dashboard in Excel.The Agricultural Equipment Production Dashboard in Excel is a ready-to-use analytical tool that helps manufacturers monitor production performance, track costs and revenue, analyze equipment output, evaluate quality issues, and review monthly production trends. Because Excel offers flexible data analysis tools such as Pivot Tables, charts, slicers, and formulas, production managers can easily convert complex manufacturing data into visual insights.
In this article, we will explore how the Agricultural Equipment Production Dashboard in Excel works, what insights it provides, and how manufacturing teams can use it to improve production efficiency and profitability.
Click to buy Agricultural Equipment Production Dashboard in Excel
Why Do Agricultural Equipment Manufacturers Need a Production Dashboard?
Agricultural equipment manufacturing involves multiple processes including material procurement, machine operations, assembly lines, quality inspections, and order fulfillment. Each department produces large amounts of operational data every day.
However, without a centralized system, production managers face several challenges:
- Difficulty tracking total production output
- Limited visibility into production costs
- Lack of insights into defective units
- Challenges monitoring production targets
- Difficulty analyzing equipment performance by region or shift
Because of these challenges, decision-makers often struggle to make timely improvements.
Therefore, companies use production dashboards to centralize their operational data. A dashboard provides a single view of production metrics, which allows managers to track performance, identify issues, and improve operational efficiency.
The Agricultural Equipment Production Dashboard in Excel solves these problems by converting raw production data into interactive visual reports.
What Is the Agricultural Equipment Production Dashboard in Excel?
The Agricultural Equipment Production Dashboard in Excel is a structured Excel template that analyzes production data from multiple departments and presents insights through visual charts and KPI indicators.
Instead of reviewing multiple reports, managers can quickly see important metrics such as:
- Total units produced
- Production cost
- Revenue
- Defective units
- Production achievement rate
- Profit margin
Moreover, the dashboard organizes production insights across multiple analytical sheets, which makes it easier to explore performance from different perspectives.
This dashboard typically includes the following analysis pages:
- Overview Dashboard
- Production Performance Analysis
- Quality Analysis
- Cost and Revenue Analysis
- Monthly Production Trends
Each section provides specific insights that help managers improve manufacturing operations.
Overview Dashboard – Quick Snapshot of Production Performance
The Overview sheet tab acts as the main dashboard page. It provides a high-level summary of production operations.
Managers can quickly understand overall production performance without reviewing detailed reports.
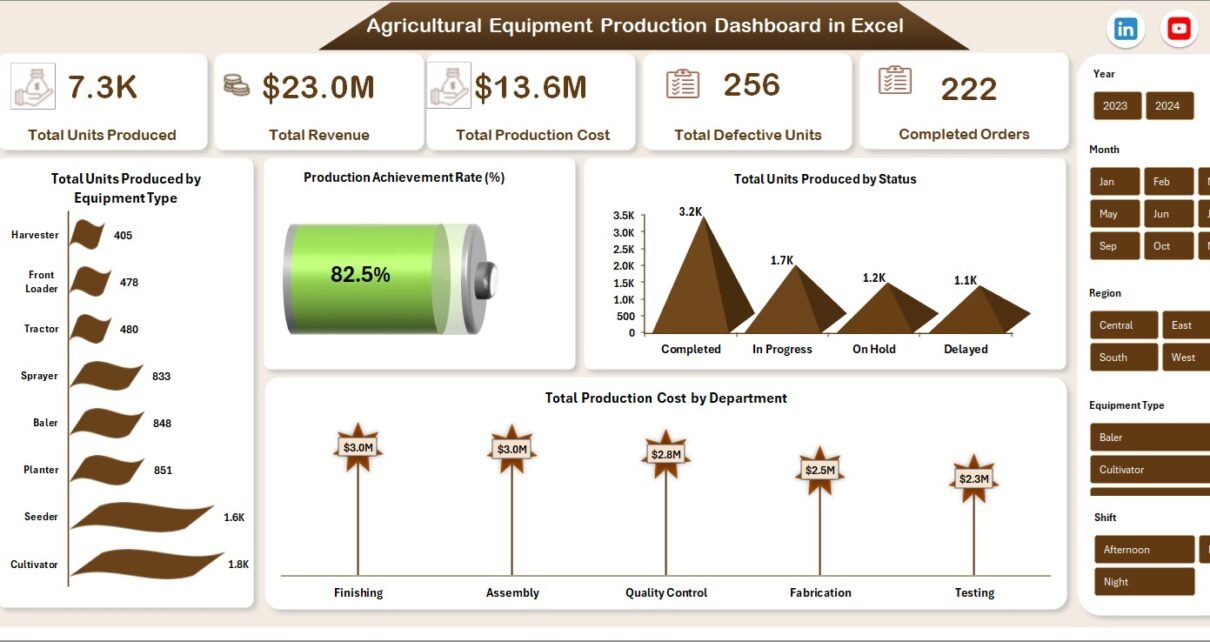
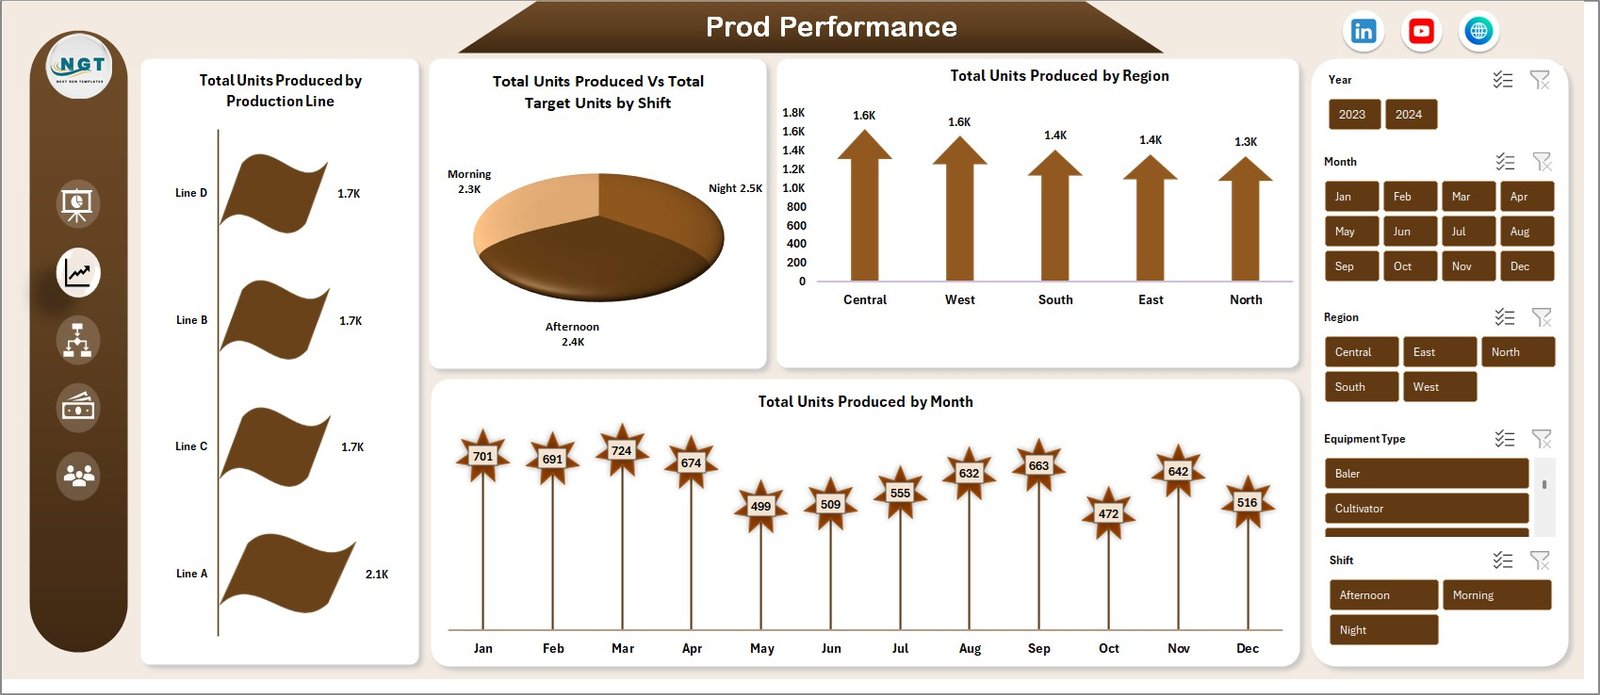
Key KPIs displayed in the Overview Dashboard
- Total Units Produced
- Total Revenue
- Total Production Cost
- Total Defective Units
- Completed Orders
These KPI indicators allow decision-makers to quickly evaluate overall manufacturing performance.
Important Charts in the Overview Dashboard
The overview section includes several visual charts that summarize production data:
- Total Units Produced by Equipment Type
Shows which agricultural machines generate the highest production output. - Production Achievement Rate (%)
Displays how efficiently production teams meet their targets. - Total Units Produced by Status
Helps managers identify production progress such as completed, pending, or delayed orders. - Total Production Cost by Department
Highlights which departments incur the highest production expenses.
Because of these insights, managers can quickly identify operational strengths and weaknesses.
Click to buy Agricultural Equipment Production Dashboard in Excel
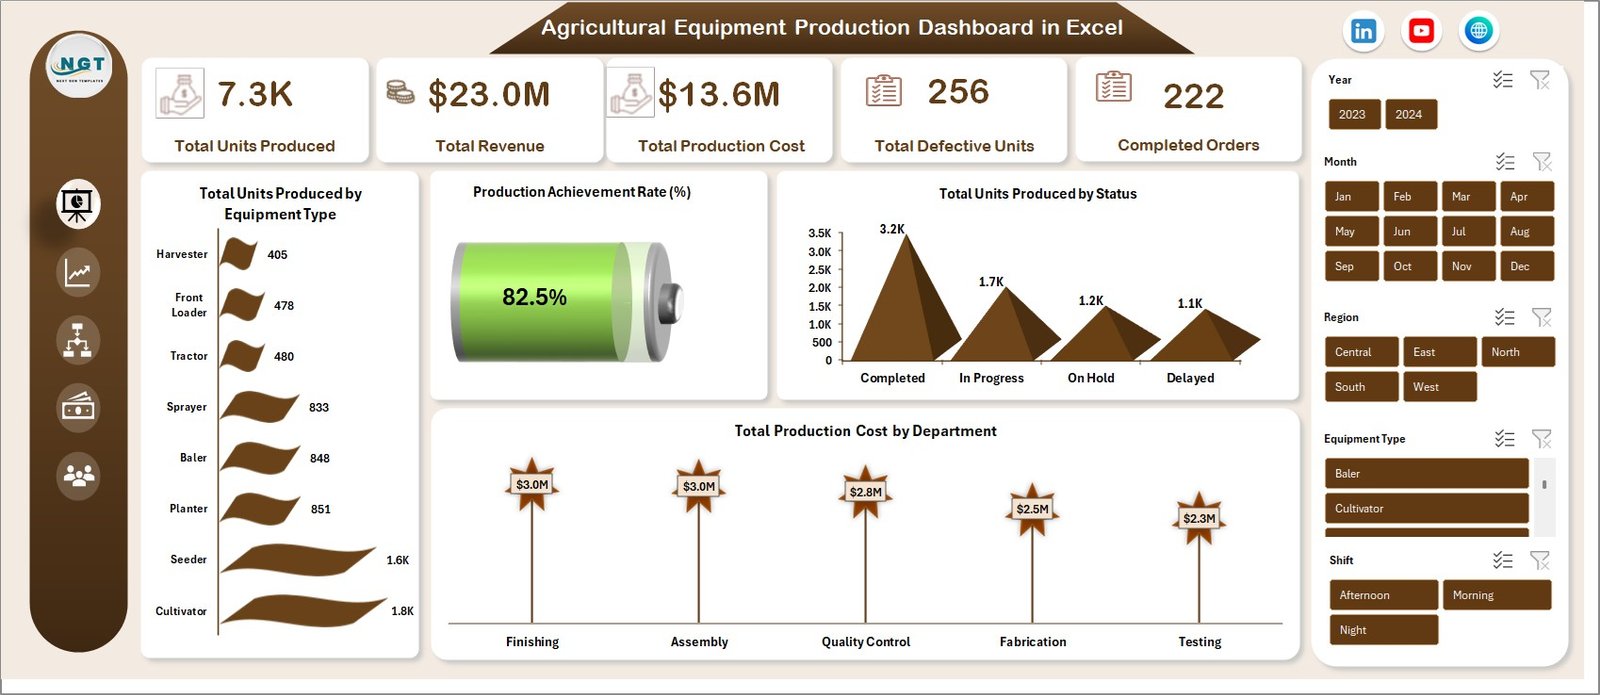
Production Performance Analysis
Production managers must constantly evaluate machine output, shift productivity, and regional production performance.
The Production Performance sheet provides detailed insights into production efficiency.
Key production metrics analyzed
- Total Units Produced by Production Line
Helps identify which production lines deliver the highest output. - Total Units Produced vs Target Units by Shift
Compares actual production performance with planned targets. - Total Units Produced by Region
Shows regional manufacturing performance across different plants. - Total Units Produced by Month
Tracks production growth and seasonal demand patterns.
Because these insights appear in visual charts, managers can easily identify underperforming production lines or shifts.
Moreover, teams can quickly adjust production schedules when targets fall behind.
Click to buy Agricultural Equipment Production Dashboard in Excel
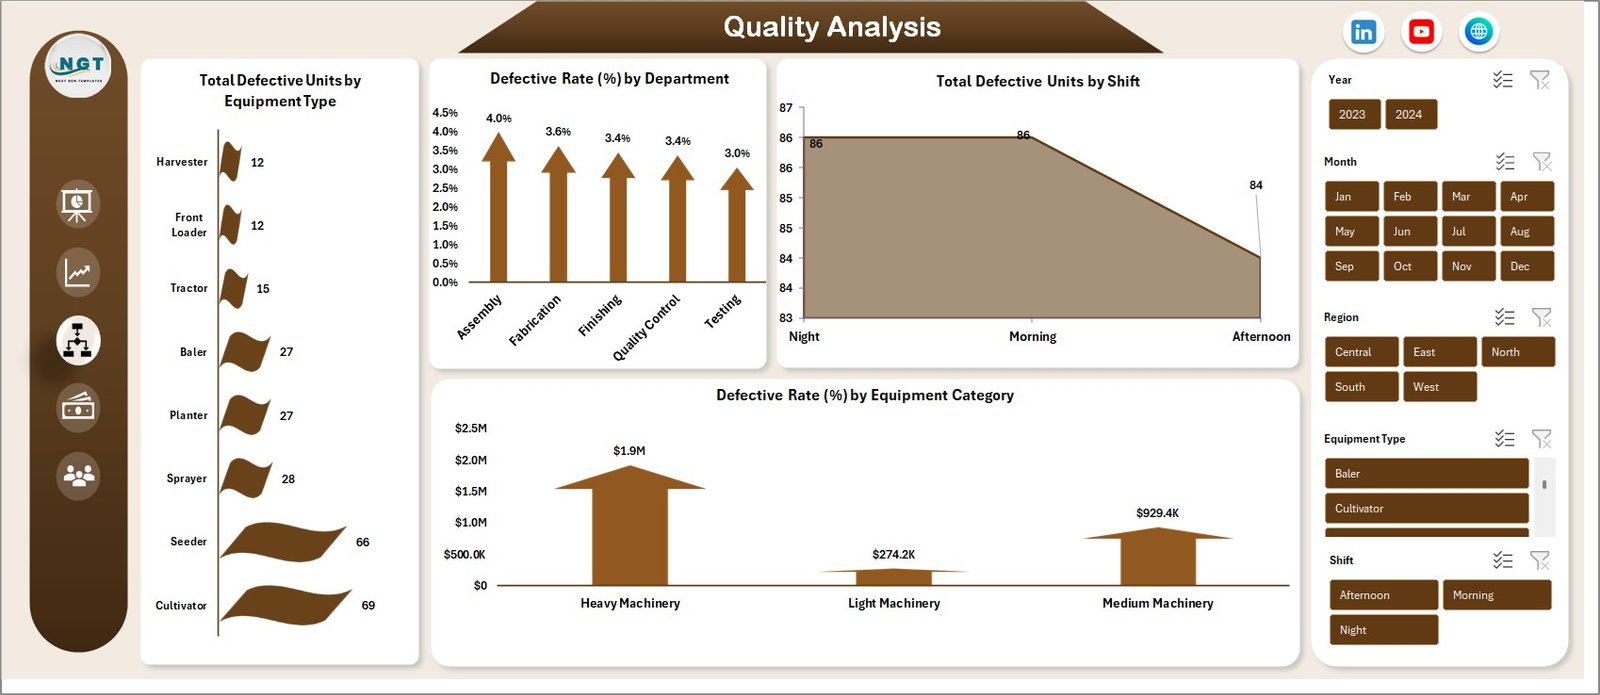
Quality Analysis – Monitoring Defective Units
Product quality plays a critical role in agricultural equipment manufacturing. Defective machines can cause financial losses, customer dissatisfaction, and brand reputation damage.
Therefore, manufacturers must monitor product quality continuously.
The Quality Analysis sheet helps teams analyze production defects and identify quality issues.
Key quality metrics in this dashboard
- Total Defective Units by Equipment Type
Helps identify which machines experience the highest defect rates. - Defective Rate (%) by Department
Shows which production departments face quality challenges. - Total Defective Units by Shift
Helps managers detect shift-specific quality problems. - Defective Rate (%) by Equipment Category
Provides insights into product categories that require quality improvements.
Because these insights appear visually, quality teams can quickly identify root causes of defects.
As a result, manufacturers can implement corrective actions faster.
Click to buy Agricultural Equipment Production Dashboard in Excel
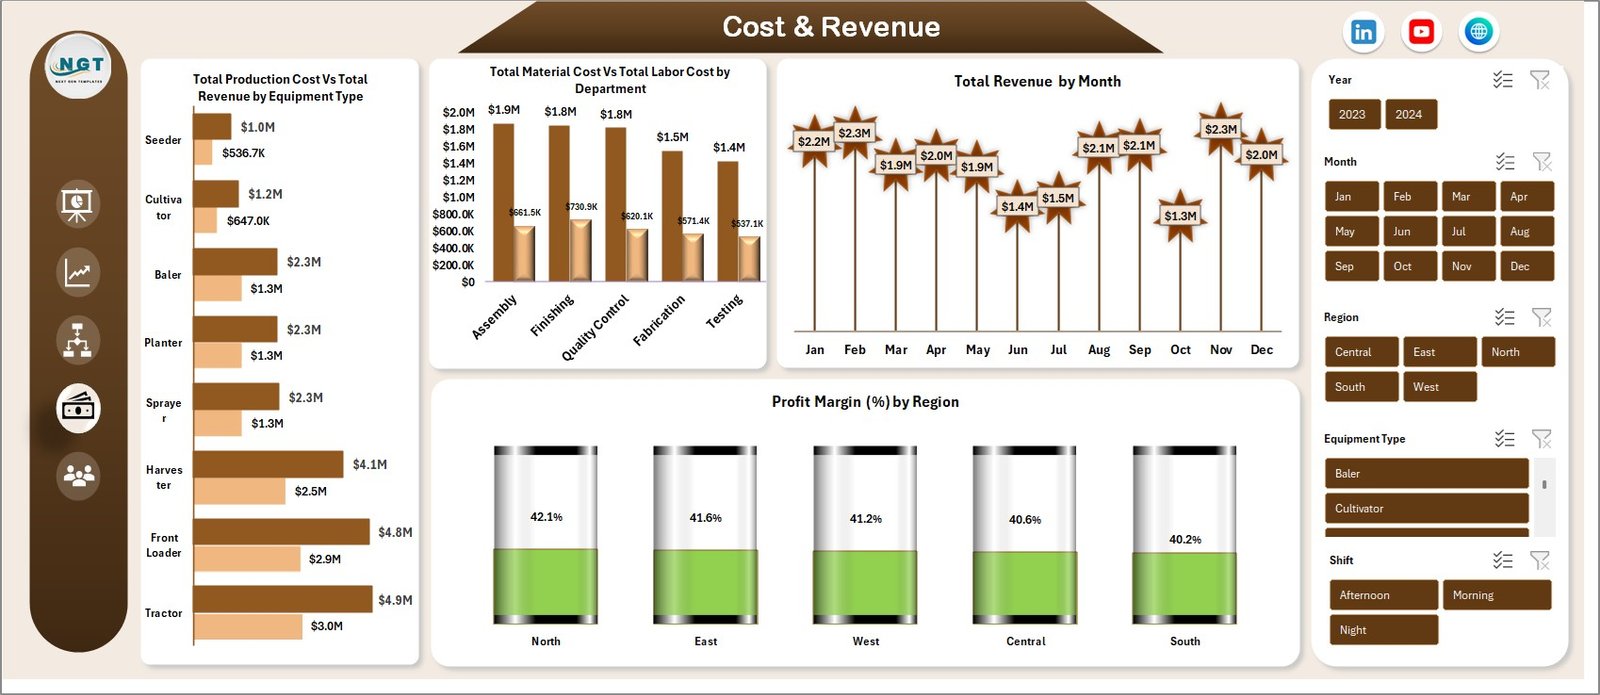
Cost and Revenue Analysis – Understanding Profitability
Manufacturing organizations must constantly monitor production costs and revenue to maintain profitability.
The Cost and Revenue sheet provides detailed financial insights into production operations.
Key financial metrics included in this dashboard
- Total Production Cost vs Total Revenue by Equipment Type
Helps companies evaluate the profitability of each equipment category. - Total Material Cost vs Total Labor Cost by Department
Identifies departments with high labor or material expenses. - Total Revenue by Month
Tracks monthly revenue trends across production operations. - Profit Margin (%) by Region
Shows which regions generate the highest profitability.
Because these insights appear in visual charts, finance and operations teams can quickly evaluate business performance.
Additionally, managers can identify cost-reduction opportunities.
Click to buy Agricultural Equipment Production Dashboard in Excel
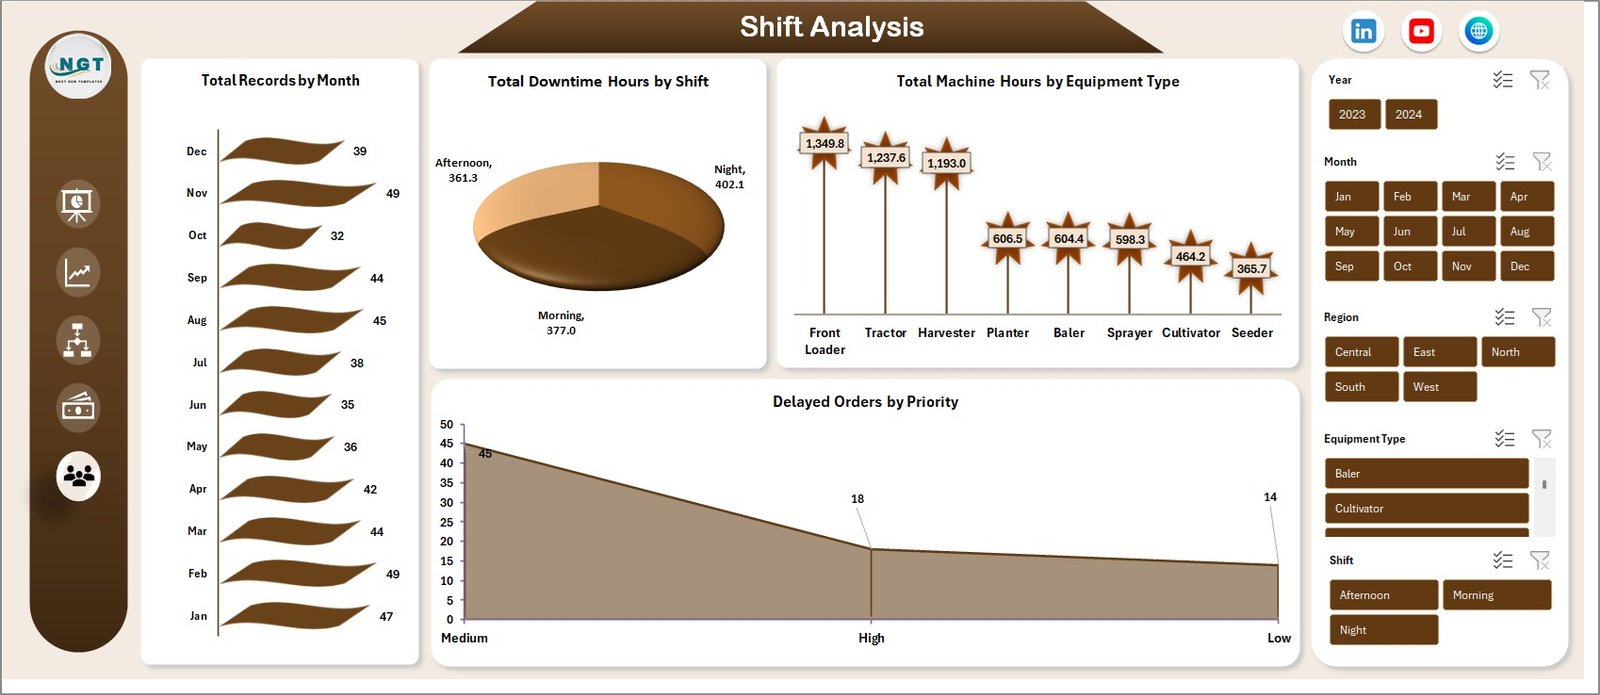
Monthly Trends – Monitoring Production Patterns
Manufacturing operations often experience seasonal patterns, machine downtime, and order delays. Therefore, organizations must track monthly trends to understand production behavior.
The Monthly Trends sheet provides deeper insights into operational patterns.
Key trend metrics analyzed
- Total Records by Month
Shows how production records vary throughout the year. - Total Downtime Hours by Shift
Helps managers identify shifts experiencing machine downtime. - Total Machine Hours by Equipment Type
Tracks machine usage across equipment categories. - Delayed Orders by Priority
Highlights urgent production delays that require immediate action.
Because of these insights, managers can optimize production schedules and reduce operational disruptions.
Click to buy Agricultural Equipment Production Dashboard in Excel
Advantages of Agricultural Equipment Production Dashboard in Excel
The Agricultural Equipment Production Dashboard in Excel provides several operational and strategic benefits.
- Centralized Production Monitoring
The dashboard consolidates production data into one centralized view. Therefore, managers can quickly monitor manufacturing performance.
- Improved Decision-Making
Visual insights help decision-makers identify production issues faster. As a result, they can take corrective action immediately.
- Better Cost Control
Cost analysis charts allow managers to track material and labor expenses. Consequently, organizations can control production costs more effectively.
- Enhanced Quality Monitoring
Quality analysis helps teams identify defect trends across departments, shifts, and equipment categories.
- Improved Production Efficiency
Production performance metrics allow managers to track shift performance, machine output, and target achievement rates.
- Data-Driven Manufacturing Strategy
The dashboard supports strategic planning by providing reliable production insights.
Best Practices for the Agricultural Equipment Production Dashboard
To maximize the benefits of this dashboard, organizations should follow certain best practices.
Maintain Accurate Production Data
Always ensure that production data remains accurate and updated regularly. Reliable data improves dashboard insights.
Standardize Data Entry
Use standardized formats for dates, equipment names, and departments. This practice improves pivot table analysis.
Update Data Regularly
Update production records daily or weekly. Frequent updates keep the dashboard relevant.
Use Slicers for Interactive Analysis
Slicers allow managers to filter data by equipment type, region, department, or month.
Monitor KPI Trends
Regularly review KPI indicators such as production achievement rate and defect rate.
Conduct Monthly Performance Reviews
Use the dashboard insights during monthly production meetings.
Who Can Benefit from This Dashboard?
The Agricultural Equipment Production Dashboard in Excel can benefit multiple roles within manufacturing organizations.
Production Managers
They can monitor production performance and optimize manufacturing processes.
Operations Teams
They can track machine usage, production output, and shift performance.
Quality Control Teams
They can analyze defect patterns and improve product quality.
Finance Teams
They can evaluate production costs, revenue trends, and profit margins.
Senior Management
They can review overall manufacturing performance and make strategic decisions.
How Does This Dashboard Improve Manufacturing Efficiency?
The dashboard improves efficiency by turning complex manufacturing data into visual insights.
For example:
- Managers can identify low-performing production lines quickly.
- Teams can reduce machine downtime using monthly trend analysis.
- Quality teams can reduce defective units through defect monitoring.
- Finance teams can improve profit margins through cost analysis.
Because the dashboard provides real-time insights, decision-makers can act faster.
Conclusion
Agricultural equipment manufacturers operate in a highly competitive and data-driven industry. Production teams must monitor machine performance, control manufacturing costs, maintain product quality, and deliver orders efficiently.
However, traditional reporting methods often fail to provide real-time insights.
The Agricultural Equipment Production Dashboard in Excel solves this problem by converting raw production data into meaningful visual insights.
Through multiple analytical pages such as Overview, Production Performance, Quality Analysis, Cost and Revenue Analysis, and Monthly Trends, the dashboard helps organizations monitor manufacturing operations effectively.
Because Excel provides flexible data analysis tools, companies can easily update production data and generate real-time reports.
Ultimately, this dashboard helps manufacturing organizations improve production efficiency, reduce costs, enhance product quality, and increase profitability.
Frequently Asked Questions (FAQs)
What is the Agricultural Equipment Production Dashboard in Excel?
The Agricultural Equipment Production Dashboard in Excel is a ready-to-use Excel template that tracks production performance, costs, revenue, and quality metrics for agricultural machinery manufacturing.
Which metrics can be tracked using this dashboard?
The dashboard can track several production metrics including:
- Total units produced
- Production cost
- Revenue
- Defective units
- Production achievement rate
- Profit margin
- Machine hours
- Downtime hours
Who should use this dashboard?
Production managers, manufacturing teams, quality analysts, finance professionals, and business executives can benefit from this dashboard.
Can this dashboard be customized?
Yes. Because it is built in Excel, organizations can easily customize charts, KPIs, and analysis fields based on their production needs.
How often should production data be updated?
Organizations should update production data daily or weekly to maintain accurate dashboard insights.
Does this dashboard support pivot table analysis?
Yes. The dashboard works perfectly with Excel Pivot Tables and Pivot Charts, which allow users to analyze data dynamically.
Yes. The dashboard works perfectly with Excel Pivot Tables and Pivot Charts, which allow users to analyze data dynamically.
Visit our YouTube channel to learn step-by-step video tutorials
Watch the step-by-step video tutorial:
Click to buy Agricultural Equipment Production Dashboard in Excel