Artificial Intelligence research has expanded rapidly across universities, technology companies, innovation centers, and government institutions. Every year, organizations invest millions of dollars in AI research projects to develop new algorithms, improve machine learning models, and create innovative technologies.
However, managing multiple AI research projects across departments, research labs, funding sources, and regions can become extremely complex. Research leaders must track project budgets, monitor project progress, evaluate research outcomes, and identify high-priority initiatives. When teams rely on scattered spreadsheets or manual reports, they often struggle to analyze research performance effectively.
Therefore, organizations increasingly adopt Power BI dashboards to transform research data into clear insights.
Click to Purchases AI Research Labs Dashboard in Power BI
The AI Research Labs Dashboard in Power BI provides a powerful analytics solution that allows research managers to monitor project performance, analyze research budgets, track high-priority projects, and evaluate research productivity across multiple labs and departments.
Moreover, the dashboard converts complex datasets into easy-to-understand visuals such as KPI cards, charts, and interactive filters. As a result, decision-makers can quickly identify trends and make informed decisions about research investments.
In this article, we will explore the AI Research Labs Dashboard in Power BI, including its structure, features, advantages, and best practices for using it effectively.
Why Do AI Research Organizations Need a Dashboard?
AI research organizations manage large volumes of research data every day. Research teams constantly create new projects, collaborate with different departments, secure funding from multiple sources, and monitor project outcomes.
However, traditional reporting systems often create several challenges.
For example:
-
Teams struggle to track project progress across multiple departments.
-
Research leaders cannot easily monitor budget allocation.
-
Managers find it difficult to identify high-priority research initiatives.
-
Organizations lack visibility into regional research performance.
Therefore, a centralized analytics system becomes essential.
The AI Research Labs Dashboard in Power BI solves these challenges by providing real-time insights into research activities. Because Power BI supports interactive visuals and advanced analytics, organizations can analyze research data from multiple perspectives.
As a result, research leaders can monitor project performance and optimize research investments efficiently.
What Is the AI Research Labs Dashboard in Power BI?
The AI Research Labs Dashboard in Power BI is a ready-to-use analytics dashboard designed to monitor research projects, funding allocation, departmental performance, and regional research activity.
The dashboard gathers research data and transforms it into visual insights using:
-
KPI cards
-
Interactive charts
-
Dynamic filters (slicers)
-
Drill-down analytics
Because the dashboard organizes research data into multiple analytical pages, users can explore research performance across different dimensions such as department, funding source, region, and month.
Consequently, organizations gain a clear understanding of how research projects perform and where resources should be allocated.
Key Features of the AI Research Labs Dashboard in Power BI
The dashboard contains five analytical pages that provide different perspectives of research performance.
Each page focuses on a specific type of analysis so users can quickly identify insights.
Let us explore each page in detail.
Click to Purchases AI Research Labs Dashboard in Power BI
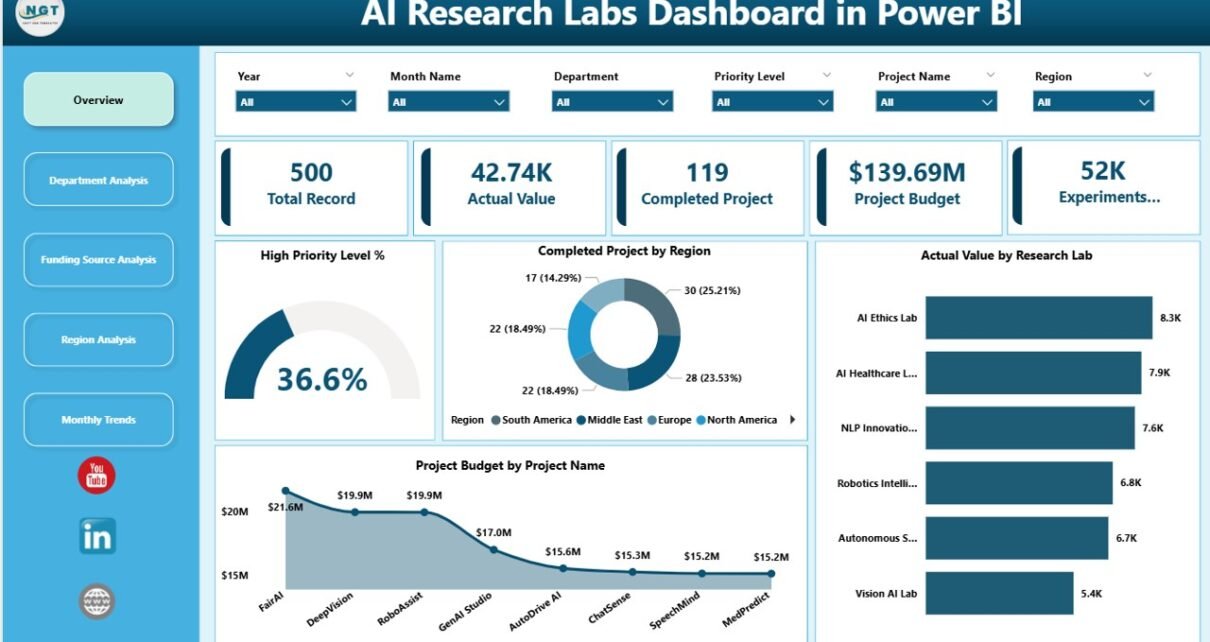
Overview Page: A Snapshot of AI Research Performance
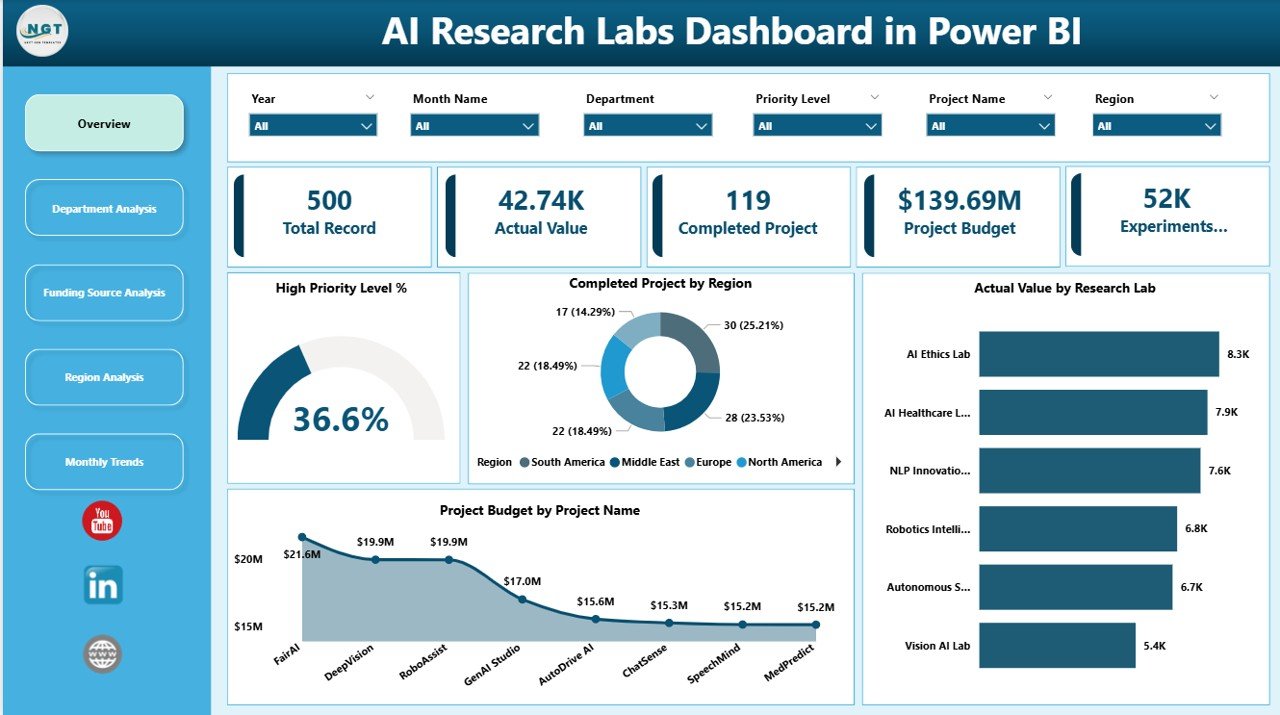
The Overview Page acts as the main dashboard page. It provides a high-level summary of research performance across the entire organization.
This page includes interactive slicers that allow users to filter data based on various conditions.
KPI Cards on the Overview Page
The dashboard displays several KPI indicators that highlight key research metrics:
-
High Priority Level % – Shows the percentage of projects classified as high priority.
-
Completed Projects by Region – Displays the number of completed projects across regions.
-
Actual Value by Research Lab – Indicates the research output value generated by labs.
-
Project Budget by Project Name – Shows the allocated budget for each project.
Because these metrics appear in the top section of the dashboard, research leaders can immediately understand the overall performance of research initiatives.
Charts Available on the Overview Page
The page also includes charts that visualize research performance across different dimensions.
These charts help users:
-
Identify which regions complete the most projects
-
Compare research lab performance
-
Analyze project budget allocation
-
Monitor high-priority project percentages
Therefore, the overview page provides a quick snapshot of research performance.
Department Analysis: How Do Departments Perform in AI Research?
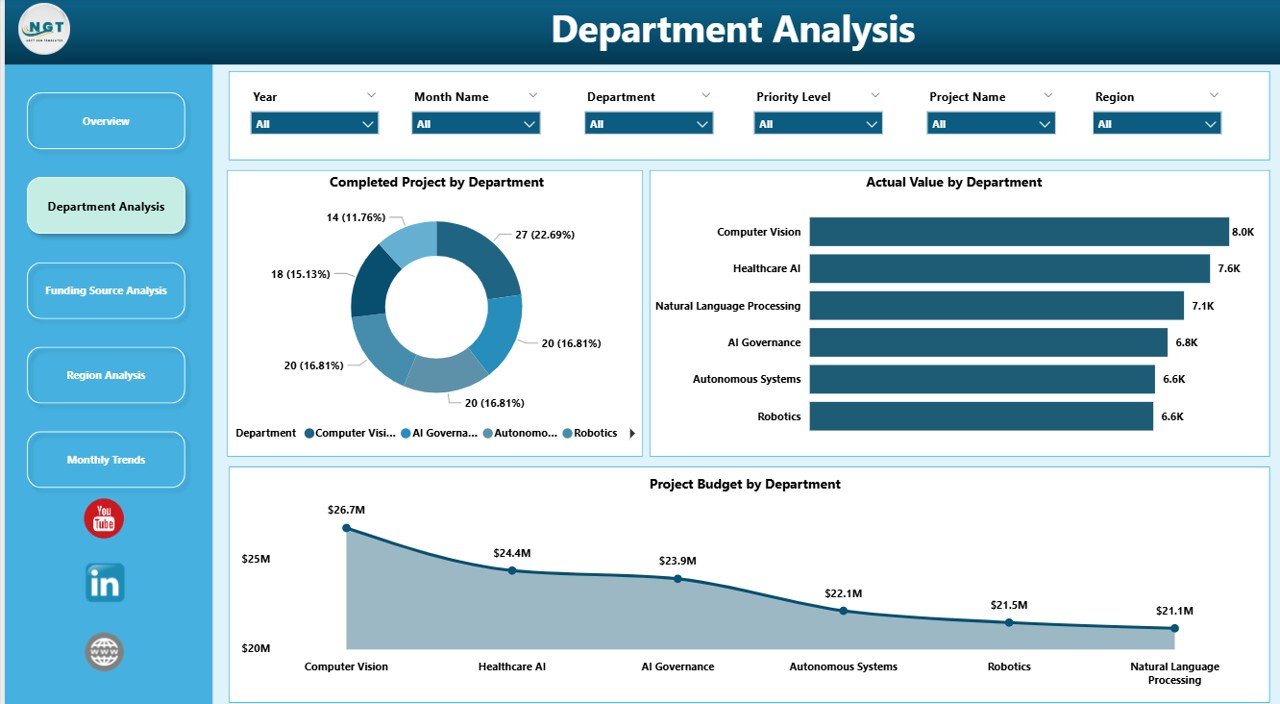
Different departments contribute to AI research in different ways. Some departments focus on algorithm development, while others specialize in data science, robotics, or natural language processing.
Therefore, analyzing department-level performance becomes very important.
The Department Analysis Page focuses on department-specific research analytics.
Click to Purchases AI Research Labs Dashboard in Power BI
Charts in Department Analysis
This page contains three important charts:
-
Completed Projects by Department
-
Actual Value by Department
-
Project Budget by Department
These charts allow research leaders to:
-
Compare research productivity across departments
-
Identify departments that receive the highest funding
-
Evaluate research outcomes by department
Because departments play a major role in research innovation, this analysis helps organizations allocate resources more efficiently.
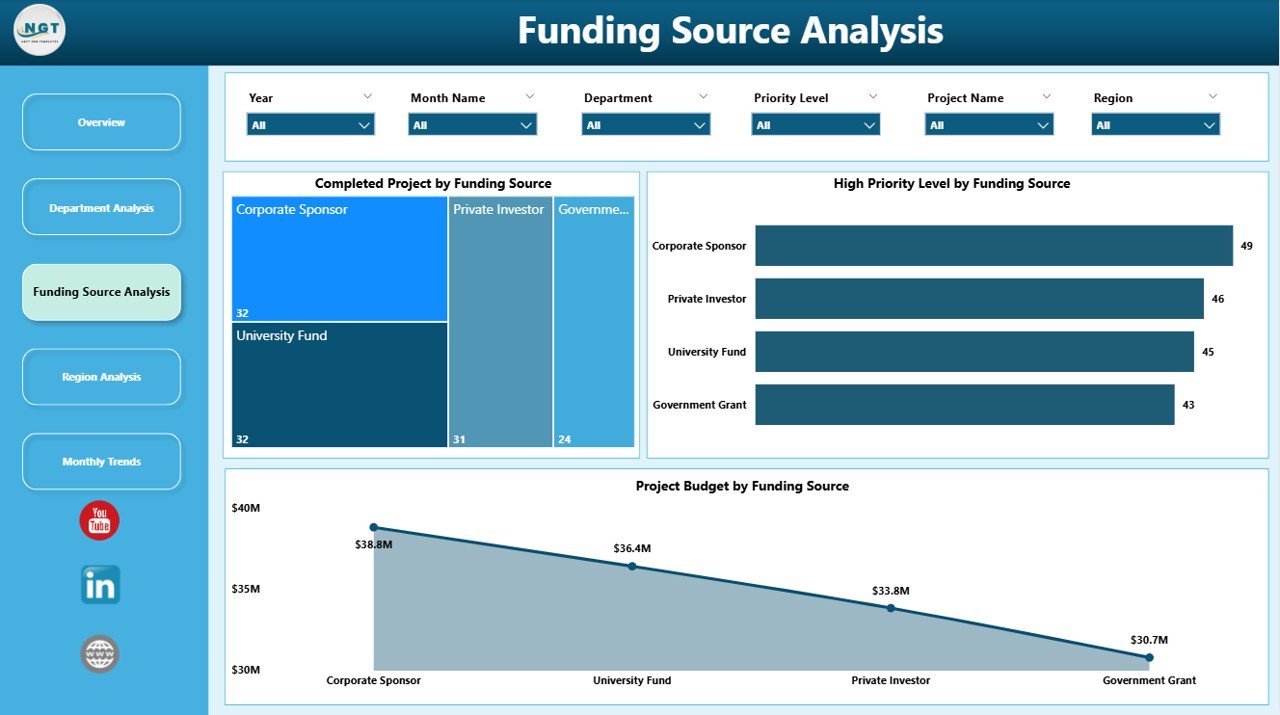
Funding Source Analysis: Where Does Research Funding Come From?
AI research often depends on multiple funding sources. For example, projects may receive funding from:
-
Government grants
-
Private investors
-
Research foundations
-
Corporate partnerships
-
University research budgets
Therefore, organizations must analyze how funding sources contribute to research outcomes.
The Funding Source Analysis Page focuses on this area.
Charts Available on the Funding Source Page
The page includes the following analytics:
-
Completed Projects by Funding Source
-
High Priority Level by Funding Source
-
Project Budget by Funding Source
These charts help decision-makers answer several important questions:
-
Which funding sources support the most projects?
-
Which funding sources fund high-priority research initiatives?
-
How does budget allocation vary across funding providers?
Consequently, organizations can identify their most valuable funding partnerships.
Region Analysis: Which Regions Drive AI Innovation?

AI research often operates across multiple geographic locations. Large organizations may run research labs in different countries or regions.
Because research output varies by location, analyzing regional performance becomes essential.
The Region Analysis Page focuses on geographic insights.
Charts in Region Analysis
This page includes three charts:
-
Total Record by Region
-
High Priority Level by Region
-
Project Budget by Region
These visuals help research leaders understand:
-
Which regions conduct the most research projects
-
Where high-priority projects occur
-
How research budgets distribute across locations
As a result, organizations can identify strong-performing research hubs.
Click to Purchases AI Research Labs Dashboard in Power BI
Month Analysis: How Does Research Activity Change Over Time?

Research projects evolve throughout the year. Some months experience higher research activity due to funding cycles, academic schedules, or project launches.
Therefore, analyzing research activity by month provides valuable insights.
The Month Analysis Page focuses on time-based analysis.
Charts in Month Analysis
This page contains the following charts:
-
Total Record by Month
-
High Priority Level by Month
-
Project Budget by Month
These charts help organizations:
-
Identify months with high research activity
-
Monitor seasonal funding patterns
-
Track research progress throughout the year
Because this page highlights trends over time, research leaders can plan future projects more effectively.
Advantages of the AI Research Labs Dashboard in Power BI
Organizations gain several benefits when they implement this dashboard.
1. Improved Research Visibility
The dashboard provides a centralized view of all research activities. Therefore, managers can monitor project performance easily.
2. Better Funding Allocation
The dashboard reveals how research budgets distribute across departments, projects, and regions. Consequently, organizations can allocate funding strategically.
3. Faster Decision-Making
Because Power BI visualizes data clearly, research leaders can identify trends quickly. As a result, they make faster decisions.
4. Real-Time Performance Monitoring
Power BI allows organizations to update datasets automatically. Therefore, the dashboard reflects the latest research performance data.
5. Enhanced Collaboration
The dashboard encourages collaboration between departments, research labs, and funding partners.
Best Practices for the AI Research Labs Dashboard in Power BI
Organizations should follow several best practices to maximize the value of this dashboard.
Maintain Clean Data Sources
Accurate dashboards require clean and well-structured datasets. Therefore, teams should maintain standardized data formats.
Update Research Data Regularly
Research data changes frequently. Consequently, organizations should update project information consistently.
Use Clear KPI Definitions
Every KPI should have a clear definition. This ensures all users interpret dashboard metrics correctly.
Limit Dashboard Complexity
Too many visuals can confuse users. Therefore, dashboards should focus only on essential metrics.
Train Teams to Use the Dashboard
Organizations should train research managers to interpret Power BI visuals effectively.
How Can Organizations Use the AI Research Labs Dashboard?
Organizations can use this dashboard for multiple purposes.
For example:
-
Monitoring AI research progress
-
Evaluating research lab performance
-
Managing research budgets
-
Identifying high-priority research initiatives
-
Analyzing funding partnerships
-
Tracking research trends across regions
Because the dashboard provides a clear analytical structure, organizations can transform raw data into strategic insights.
Click to Purchases AI Research Labs Dashboard in Power BI
How Does Power BI Improve Research Analytics?
Power BI offers several powerful features that enhance research analytics.
Interactive Visualizations
Users can explore research data dynamically using interactive charts.
Real-Time Data Updates
Power BI supports automatic data refresh, ensuring updated research insights.
Data Integration
Organizations can connect Power BI to multiple data sources such as:
-
Excel
-
SQL databases
-
SharePoint
-
Cloud storage systems
Advanced Data Modeling
Power BI allows organizations to build advanced calculations using DAX formulas.
As a result, research teams can analyze complex metrics efficiently.
Future of AI Research Analytics
AI research will continue to grow rapidly in the coming years. As organizations increase investments in artificial intelligence, they will require advanced analytics tools to manage research programs.
Therefore, dashboards like the AI Research Labs Dashboard in Power BI will play a critical role in research management.
These dashboards will help organizations:
-
Optimize research funding
-
Improve project success rates
-
Accelerate innovation
-
Strengthen research collaboration
Consequently, data-driven research management will become the standard practice for AI research organizations.
Conclusion
The AI Research Labs Dashboard in Power BI provides a powerful analytics solution for organizations that manage complex AI research programs. Because research projects involve multiple departments, funding sources, and regions, traditional reporting systems often fail to deliver clear insights.
However, this dashboard simplifies research analytics by transforming raw data into meaningful visual insights.
Through five analytical pages—Overview, Department Analysis, Funding Source Analysis, Region Analysis, and Month Analysis—organizations can monitor research performance from multiple perspectives.
Moreover, the dashboard improves decision-making, enhances research visibility, and supports better funding allocation.
As AI research continues to grow worldwide, organizations that adopt advanced analytics dashboards will gain a significant competitive advantage.
Frequently Asked Questions (FAQs)
What is the AI Research Labs Dashboard in Power BI?
The AI Research Labs Dashboard in Power BI is a data analytics dashboard that helps organizations monitor AI research projects, track budgets, analyze funding sources, and evaluate research performance across departments and regions.
Who can use the AI Research Labs Dashboard?
The dashboard benefits multiple users such as:
-
Research directors
-
AI project managers
-
Data scientists
-
University research teams
-
Technology companies
-
Government research agencies
What type of data does this dashboard analyze?
The dashboard analyzes several types of research data including:
-
Project budgets
-
Research departments
-
Funding sources
-
Project completion status
-
Research lab performance
-
Regional research activity
Why should organizations use Power BI for research analytics?
Power BI provides interactive dashboards, real-time data updates, and advanced analytics capabilities. Therefore, it helps organizations convert complex research data into actionable insights.
Can organizations customize the AI Research Labs Dashboard?
Yes. Organizations can customize the dashboard according to their research requirements. For example, they can add new KPIs, modify charts, or connect additional data sources.
Visit our YouTube channel to learn step-by-step video tutorials