ESG Investment Firms Dashboard in Power BI gives ESG fund managers, sustainable investment analysts, portfolio operations teams, and finance leaders a structured way to review Total Firms, Total AUM, Net Fee Income, Active Firms, Capital Deployed, ESG score, compliance rate, management fee, investment strategy, fund type, region, asset class, analyst, and reporting period from one PBIX report. ESG investment reporting often becomes slow when finance, compliance, and portfolio data sit in separate files. This dashboard brings those views into one interactive Power BI template with 5 pages, KPI cards, charts, and slicers.
The template is designed for teams that already have structured ESG investment data and want a ready reporting layer instead of building every visual manually. Open the file in Power BI Desktop, replace or connect your source data, refresh the report, and use the pages for ESG committee reviews, investment operations meetings, analyst performance discussions, and management reporting. For Power BI setup guidance, Microsoft provides official documentation for getting started with Power BI Desktop.
Key Features of ESG Investment Firms Dashboard in Power BI
- 5 Power BI pages: Overview, Capital, ESG Quality, Portfolio, and Firm Segments.
- Executive KPI cards: Total Firms, Total AUM, Net Fee Income, Active Firms, and Capital Deployed.
- AUM analysis: Review Total AUM by Year and Total AUM by Region for exposure and growth review.
- Fee analysis: Track Total Management Fee by Investment Strategy and Quarter, plus Net Fee Income by Fund Type, Month, and Analyst.
- ESG quality tracking: Review Avg ESG Score by Region, Compliance Rate by ESG Theme, Compliance Rate by Investment Strategy, and Compliance Rate by Fund Type.
- Portfolio segmentation: Analyze Total Firms by Asset Class, Deployment Rate by Status, and Active Firms by Year.
- Editable PBIX design: Customize visuals, slicers, fields, themes, relationships, and measures in Power BI Desktop.
Dashboard Pages Explanation
1. Overview Page
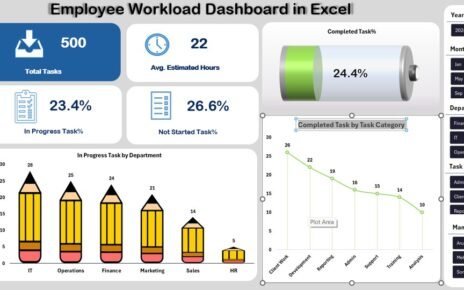
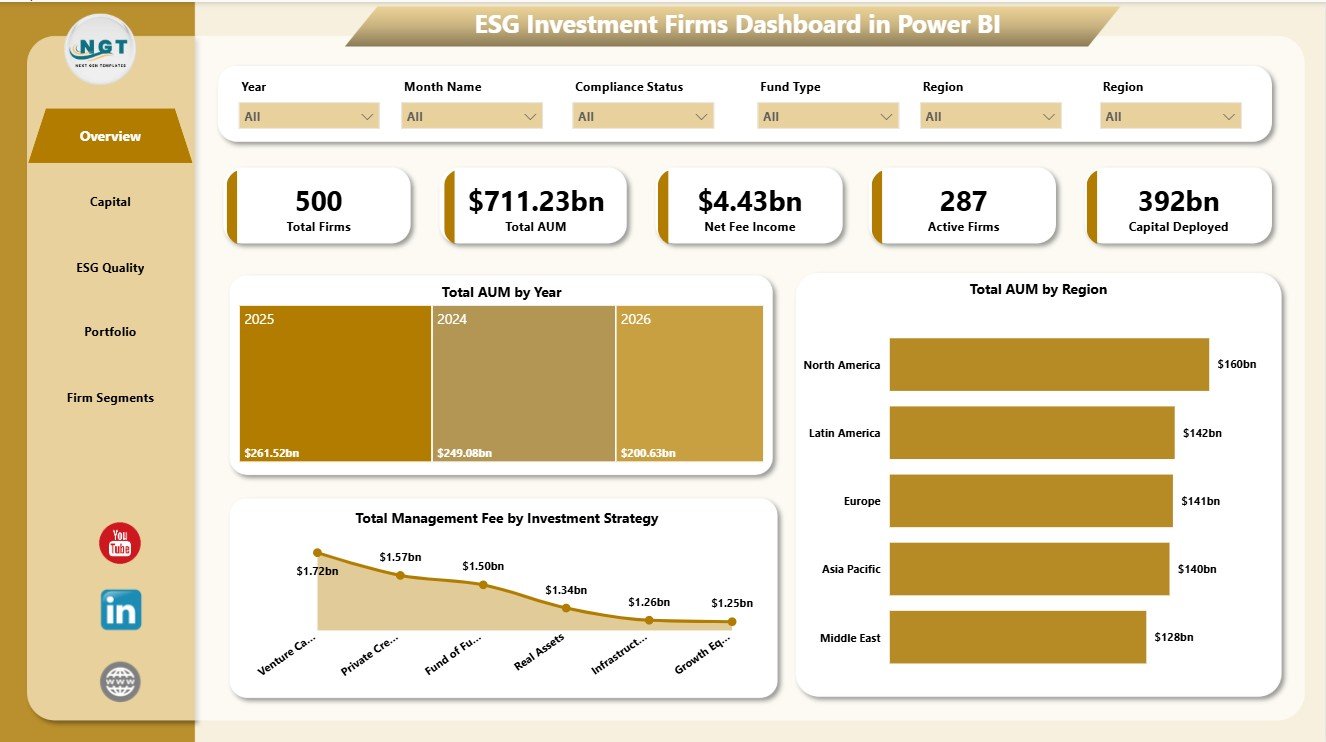
The Overview Page is the executive summary of the dashboard. At the top, it shows Total Firms, Total AUM, Net Fee Income, Active Firms, and Capital Deployed so users can quickly understand investment scale, firm activity, and financial performance.
Total AUM by Year: This chart shows how assets under management move across years. It helps teams identify growth patterns, flat periods, and years that need deeper review.
Total AUM by Region: This chart compares AUM across regions. It helps users see where investment exposure is concentrated and where regional diversification may need attention.
Total Management Fee by Investment Strategy: This visual compares management fee contribution by strategy. It helps investment leaders understand which strategies generate stronger recurring fee income.
2. Capital
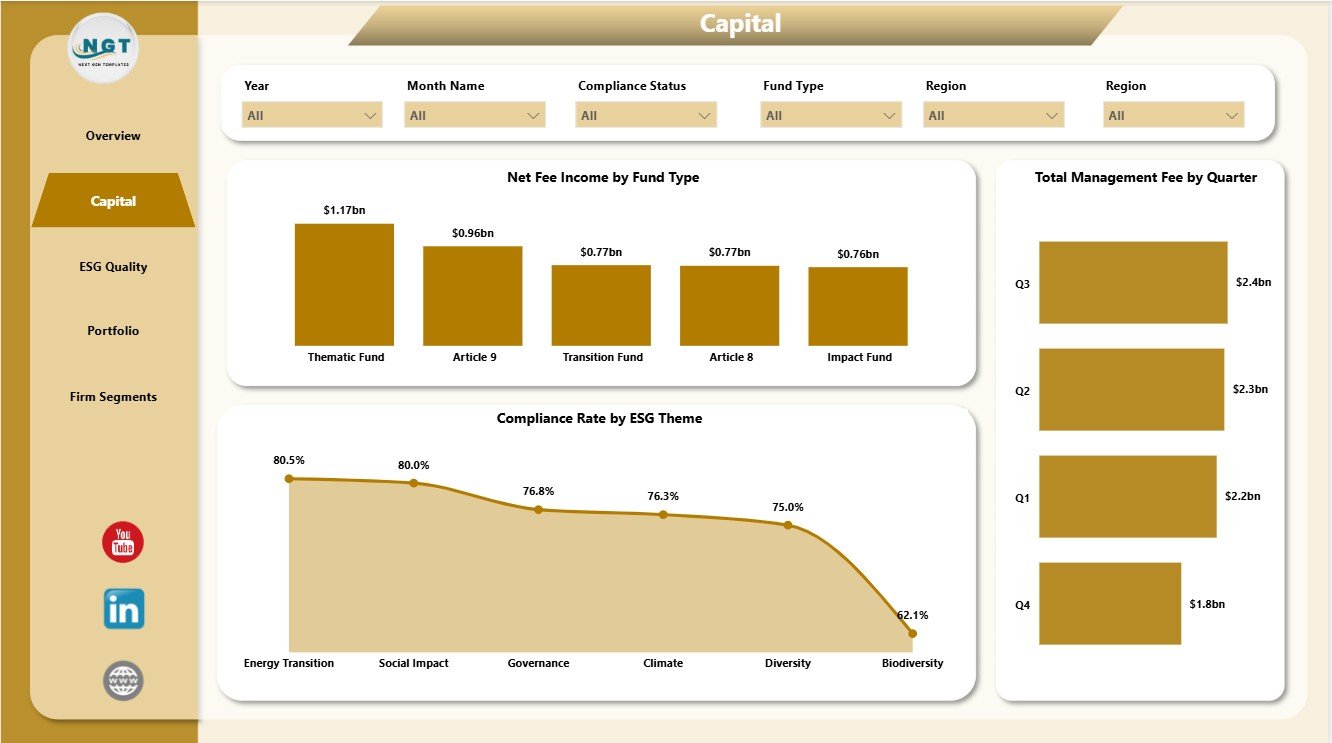
The Capital page focuses on income, fund type, ESG theme compliance, and quarter-level fee movement.
Net Fee Income by Fund Type: This chart compares net fee income across fund types. It helps finance and operations teams understand which fund structures contribute more income.
Compliance Rate by ESG Theme: This chart reviews compliance strength by ESG theme. It helps sustainability teams find themes that are performing well and themes that need follow-up.
Total Management Fee by Quarter: This chart tracks management fee movement by quarter. It supports quarterly review meetings, management reporting, and trend analysis.
3. ESG Quality
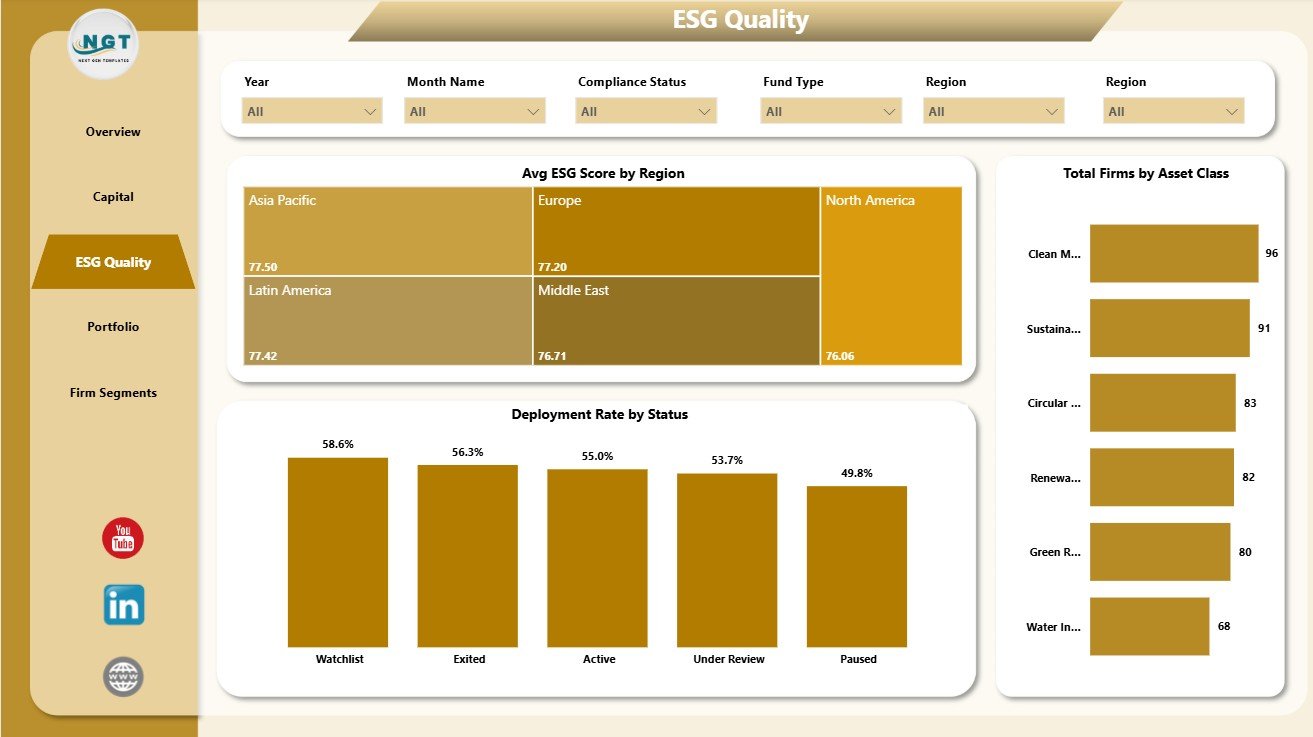
The ESG Quality page is built for governance, compliance, and quality review conversations.
Avg ESG Score by Region: This chart compares ESG score across regions. It helps teams understand whether sustainability quality is consistent or regionally uneven.
Deployment Rate by Status: This chart shows deployment rate across status groups. It helps users review how capital deployment behaves across active, pending, or other status categories.
Total Firms by Asset Class: This chart compares firm count across asset classes. It helps portfolio teams understand the structure and concentration of the investment universe.
4. Portfolio
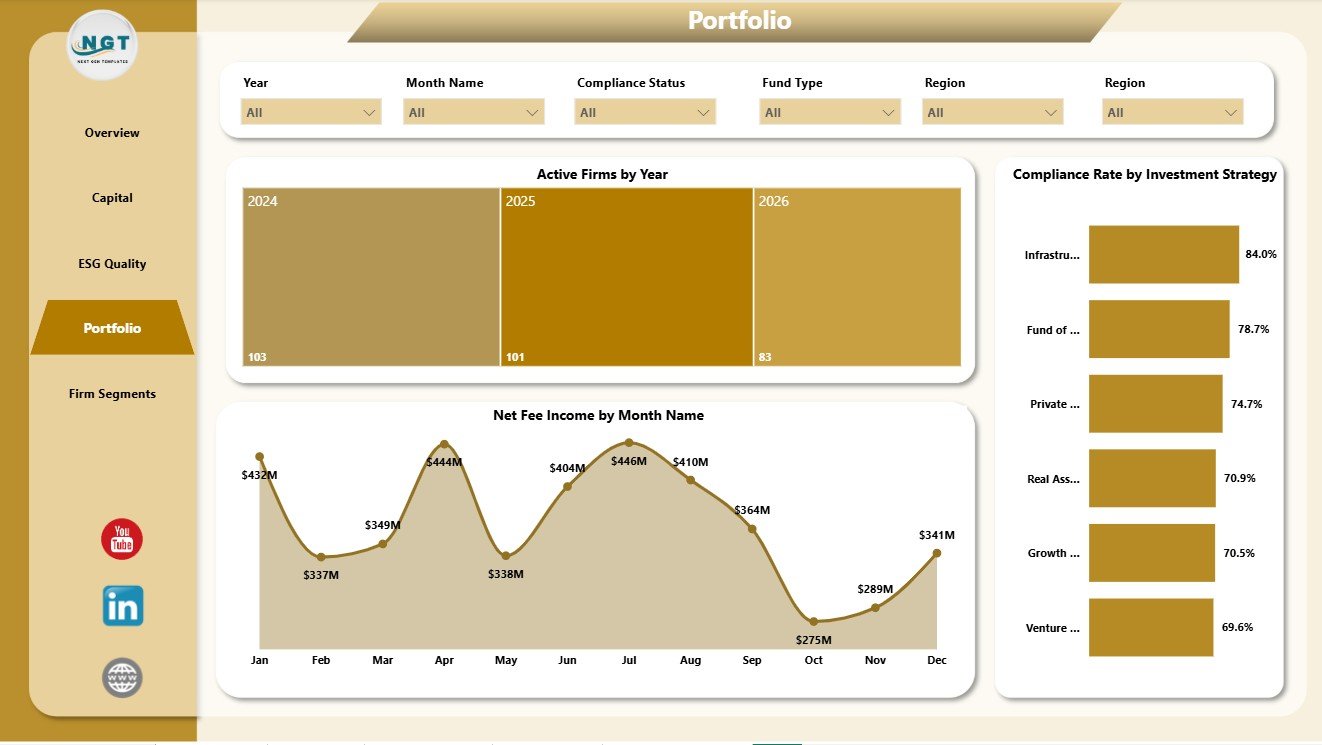
The Portfolio page connects firm activity, monthly income, and strategy-level ESG compliance.
Active Firms by Year: This chart tracks active firm count over time. It helps users see whether firm activity is expanding, stable, or declining by year.
Net Fee Income by Month Name: This chart shows monthly net fee income patterns. It helps finance teams identify seasonal movement and months that may need deeper investigation.
Compliance Rate by Investment Strategy: This chart compares ESG compliance across strategies. It helps leaders see whether certain investment strategies carry stronger or weaker compliance performance.
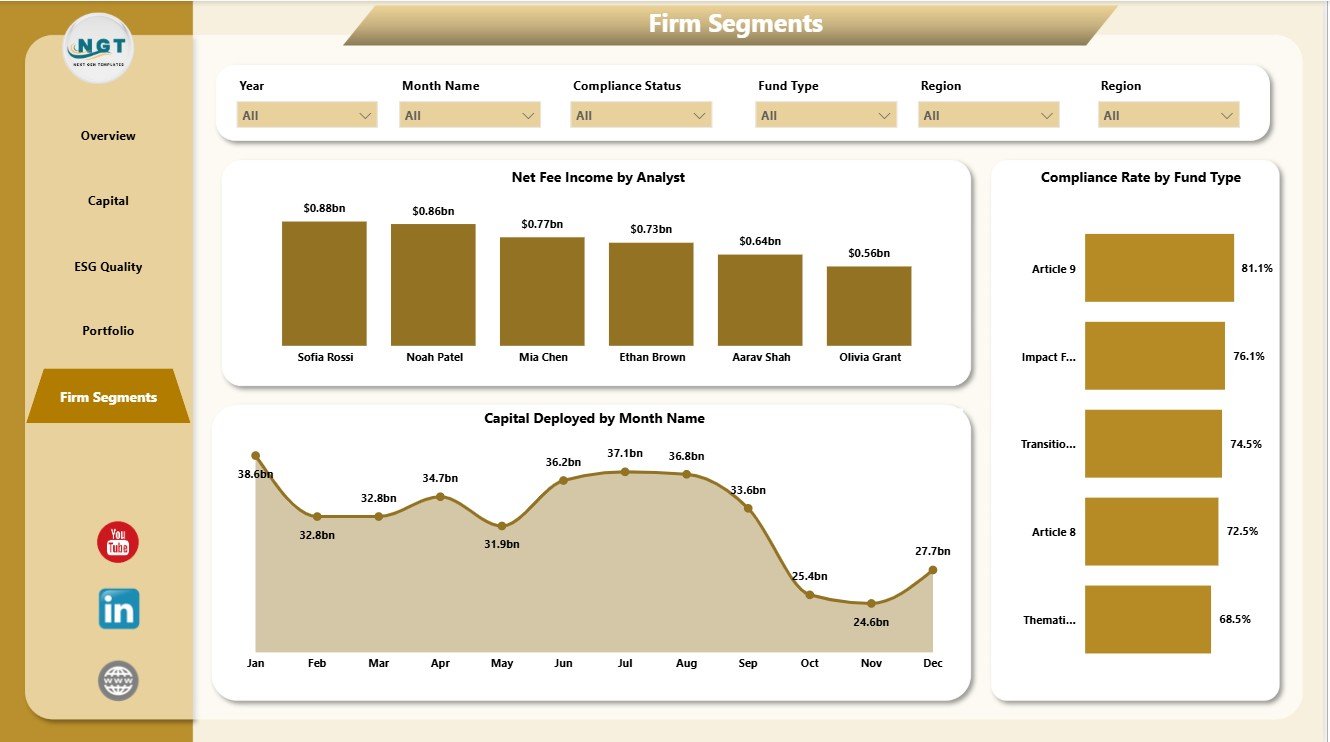
5. Firm Segments
The Firm Segments page compares analyst, monthly deployment, and fund type compliance performance.
Net Fee Income by Analyst: This chart shows income contribution by analyst. It helps managers review analyst-level performance and reporting responsibility.
Capital Deployed by Month Name: This chart tracks monthly capital deployment. It helps teams understand when deployment activity is strongest and where monthly changes occur.
Compliance Rate by Fund Type: This chart compares ESG compliance by fund type. It helps teams understand whether compliance quality varies by fund structure.
ESG Investment Firms Dashboard in Power BI vs. Tableau vs. Paid CRM/SaaS – Feature Comparison
| Feature | This Power BI Dashboard | Tableau Alternative | Paid ESG/Portfolio SaaS |
|---|---|---|---|
| Cost | $17.99 one-time | License plus build time | Monthly or annual subscription |
| Platform | Power BI Desktop / Power BI Service | Tableau Desktop / Cloud | Vendor cloud platform |
| Setup time | Open PBIX, replace or connect data, refresh | Build the model and visuals manually | Implementation and onboarding |
| Real-time team collaboration | Available through Power BI Service licensing | Available through Tableau Cloud licensing | Usually included by plan |
| Mobile access | Power BI mobile app after publishing | Tableau mobile after publishing | Vendor app or browser |
| Customizable fields | Editable visuals, fields, model, and measures | Editable with Tableau skills | Limited by vendor settings |
| Share with link | Possible through Microsoft permissions | Possible through Tableau permissions | Usually login controlled |
| Year-1 cost at 5 users | $17.99 plus any Microsoft licensing | Usually much higher | Often hundreds or thousands |
| ESG investment analysis | Built across 5 pages | Must be designed | Depends on module and setup |
Who Should Use This Template
This template is useful for ESG investment firms, sustainable finance teams, asset managers, fund managers, portfolio analysts, investment operations teams, ESG analysts, impact investment consultants, and Power BI users who need a clean view of AUM, active firms, capital deployed, fee income, ESG quality, compliance rate, fund type, investment strategy, region, status, month, and analyst.
It is not intended to replace a full ESG scoring engine, fund accounting system, investor portal, CRM, regulatory filing workflow, or governed data warehouse. It works best as a reporting dashboard when source data is already structured and ready for analysis.
Real-World Use Cases
Priya, ESG portfolio analyst: Priya uses the Overview and ESG Quality pages before committee meetings to explain AUM movement, ESG score differences, active firms, and capital deployment status.
Marcus, investment operations manager: Marcus uses the Capital and Portfolio pages to compare net fee income, management fee movement, compliance by strategy, and active firms by year.
Elena, impact investment consultant: Elena uses Firm Segments to compare analyst-level income, fund type compliance, and monthly capital deployment across client reports.
Advantages of ESG Investment Firms Dashboard in Power BI
- It saves time compared with building Power BI visuals from scratch.
- It combines finance, portfolio, and ESG quality metrics in one report.
- It gives executives a clear Overview while still offering deeper analysis pages.
- It is editable, so teams can adapt visuals, slicers, fields, colors, and measures.
- It supports recurring monthly, quarterly, and committee reporting without a separate dashboard SaaS subscription.
Opportunities for Improvement
For larger firms, the next step may be connecting the PBIX file to a governed database, Power Query pipeline, cloud data warehouse, CRM export, or portfolio management platform. Teams may also add additional DAX measures for realized return, risk-weighted exposure, emissions metrics, benchmark comparison, stewardship activity, portfolio turnover, or impact scoring.
Best Practices
- Keep source data columns consistent before refreshing the report.
- Validate KPI cards after each data update.
- Review AUM, fee income, and compliance together instead of treating them as separate reporting topics.
- Use slicers during meetings to answer follow-up questions quickly.
- Save a backup before changing relationships, measures, or Power Query steps.
- Use Microsoft guidance to install or update Power BI Desktop when needed.
Explore Relevant Templates
- Download ESG Investment Firms Dashboard in Power BI
- ESG Investment Firms Dashboard in Excel
- Creative Agencies Dashboard in Power BI
- Browse Power BI Dashboard Templates
Frequently Asked Questions
What KPI cards are included?
The Overview page includes Total Firms, Total AUM, Net Fee Income, Active Firms, and Capital Deployed.
How many report pages are included?
The dashboard includes 5 pages: Overview, Capital, ESG Quality, Portfolio, and Firm Segments.
Do I need Power BI Desktop?
Yes. Power BI Desktop is used to open, edit, and refresh the PBIX report. Sharing through Power BI Service may require Microsoft licensing.
Can I use my own ESG investment data?
Yes. Replace or connect the sample source with your own structured ESG investment data and refresh the report.
Can I customize the dashboard?
Yes. You can customize visuals, slicers, fields, measures, relationships, colors, labels, and pages in Power BI Desktop.
Does this replace ESG compliance software?
No. It is an analytics dashboard for prepared data, not a compliance filing platform, ESG rating engine, investor portal, or fund accounting system.
About the Author
Built by PK – Microsoft Certified Professional with 15+ years of Excel, Google Sheets, and Power BI experience. Founder of NextGenTemplates, reaching 300K+ subscribers across YouTube channels. Every template is hand-built and tested before release.
Conclusion
The ESG Investment Firms Dashboard in Power BI gives investment teams a clear way to review AUM, capital deployed, fee income, active firms, ESG score, compliance rate, fund type, analyst performance, strategy, region, and monthly movement. Instead of building a report from a blank canvas, teams can start from a ready PBIX file, connect their own data, refresh the pages, and focus on the decisions that matter.
For more dashboard tutorials and template walkthroughs, visit PK An Excel Expert on YouTube.