The Banking Report in Excel is a ready-to-use Excel template that tracks 12+ banking KPIs across 2 interactive pages — including branch performance, high-risk transaction analysis, service fee breakdowns, and monthly trend monitoring. According to Microsoft Learn, Excel remains the most widely deployed data analysis tool in financial institutions globally. With 5 pre-built charts and native slicer filters, this template lets banking teams replace hours of manual reporting with a 10-minute data refresh.
Key Features of Banking Report in Excel
The Banking Report in Excel is structured around 4 sheets and delivers 5 interactive charts driven by a single Data Sheet source. Here are the standout capabilities:
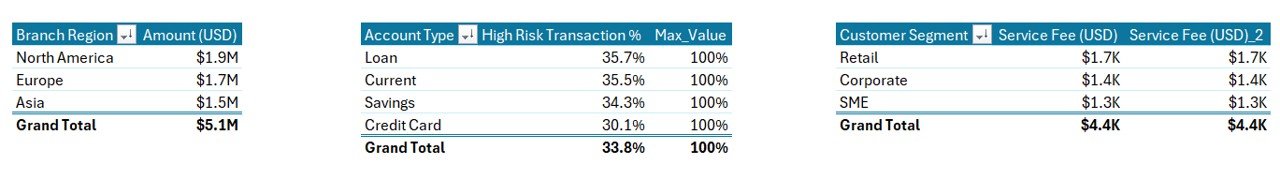
- 5 KPI Summary Cards — Total Amount, Total Transactions, Average Service Fee, High Risk Transaction %, and Net Branch Revenue displayed at the top of the Summary Page.
- 5 Pre-Built Charts — Amount by Branch Region, High Risk Transaction % by Account Type, Service Fee by Customer Segment, Service Fee by Department, and Amount by Month.
- Native Excel Slicers — Filter every chart and table by Branch, Account Type, Customer Segment, or Date with one click.
- Structured Data Entry — The Data Sheet uses a clean table format: paste in your raw banking transactions and the entire report updates automatically.
- Support Sheet — Documents field definitions, column mapping, and customization guidance so any team member can maintain the report.
Dashboard Pages Explanation
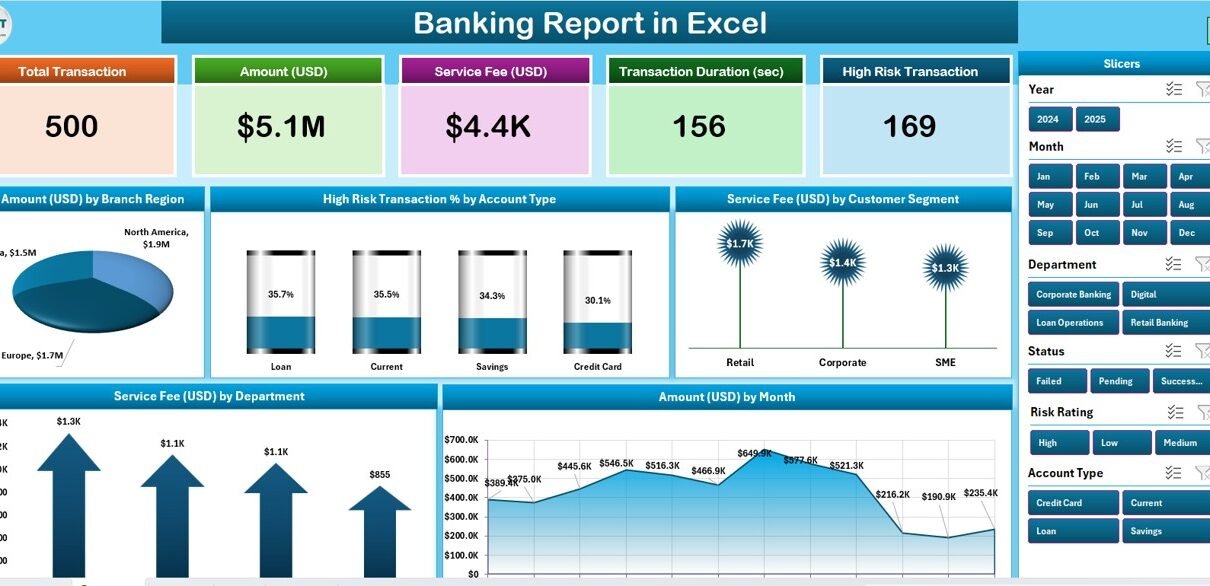
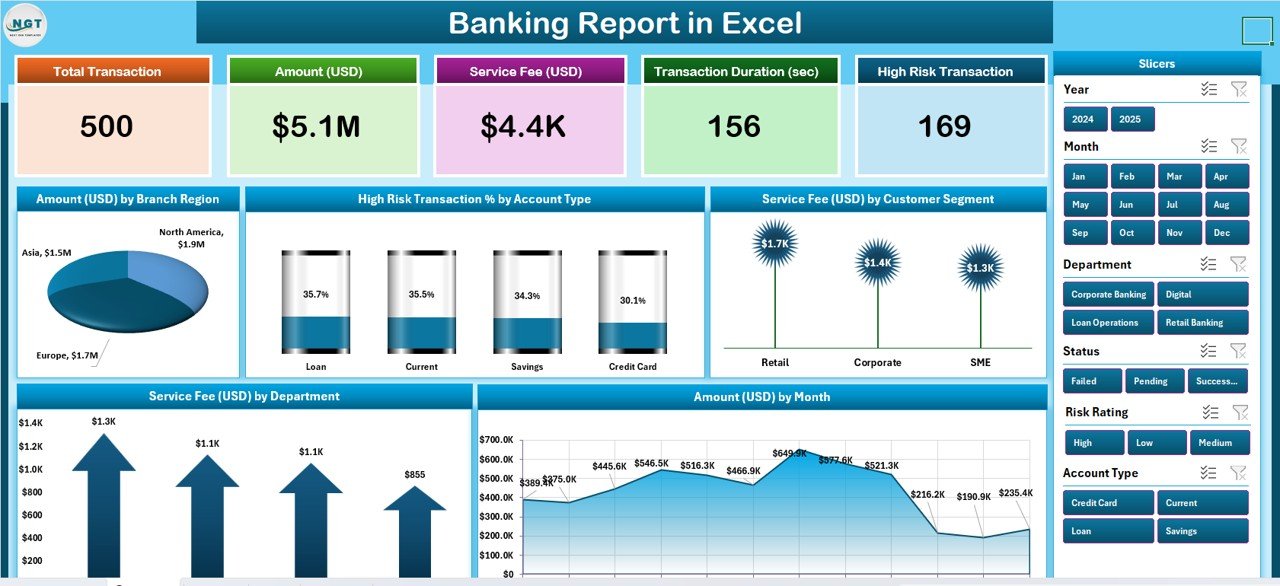
Page 1: Summary Page
Summary Page — 5 KPI Cards, 5 Charts, Right-Side Slicer
The Summary Page is the command center of the Banking Report in Excel. Across the top row, 5 KPI cards display the most critical banking metrics at a glance. A right-side slicer allows instant filtering of all charts simultaneously. The 5 charts cover every major analytical angle: geographic (branch region), risk (high-risk transaction % by account type), revenue (service fee by segment and department), and time-series (amount by month).
Page 2: Report Page
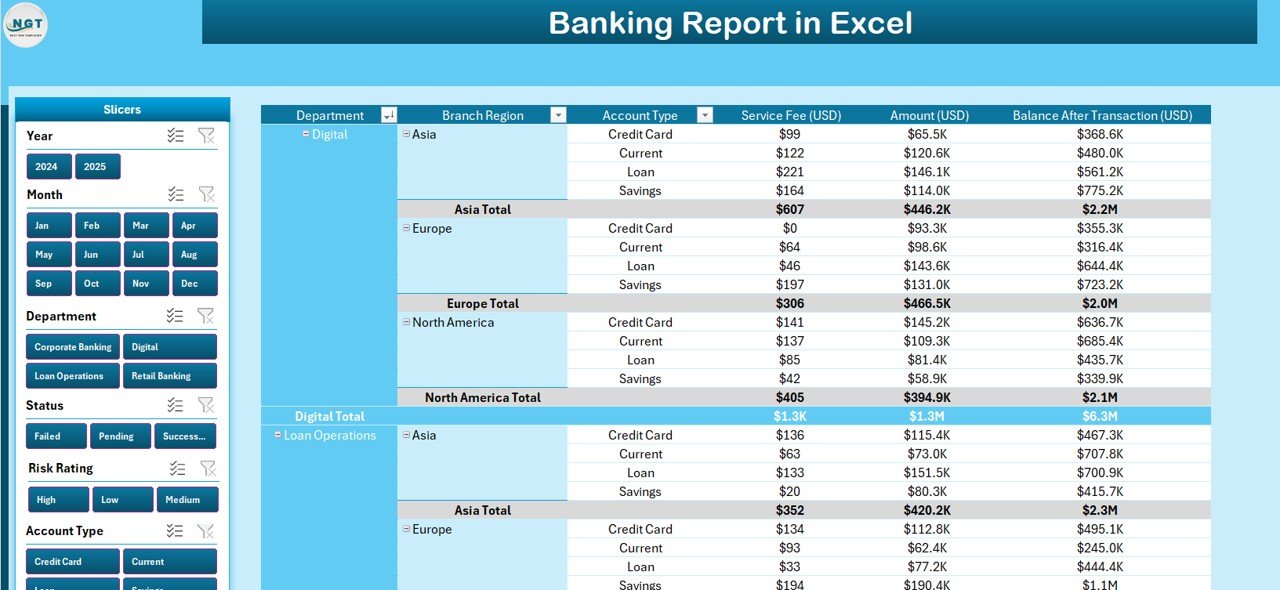 Report Page — Left Slicer + Detailed Information Table
The Report Page provides a transaction-level drill-down. A left-side slicer filters the accompanying information table to show only the records matching the selected dimensions. This page is ideal for managers who need to review individual branch transactions or identify specific account types driving fee revenue.
Data Sheet
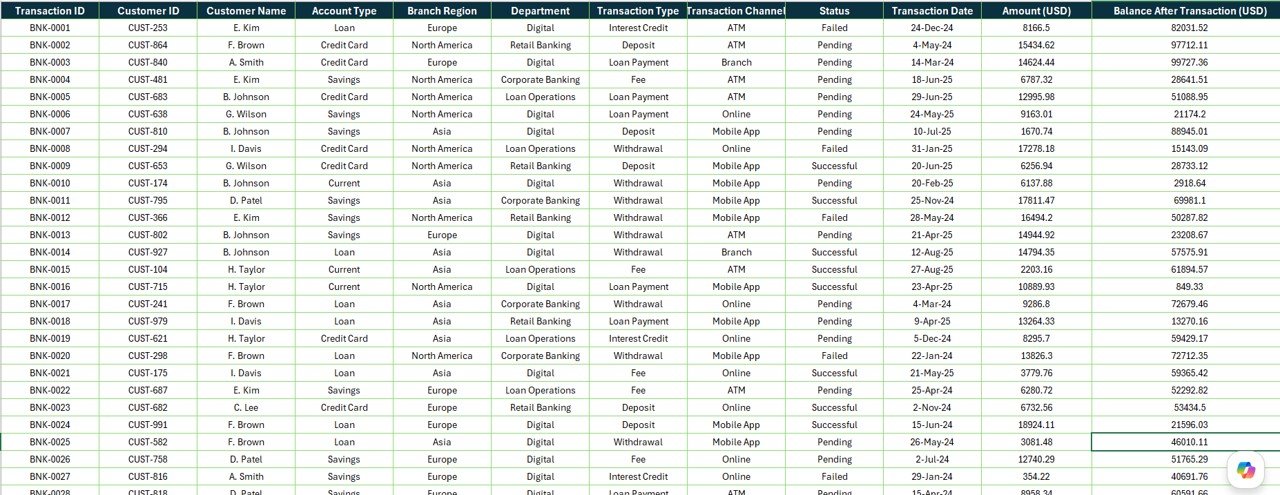 Data Sheet — Raw Transaction Input Table
The Data Sheet is where you paste your banking transaction export. The structured table columns include Branch, Account Type, Customer Segment, Department, Date, Amount, and Service Fee. Every chart and KPI card in the report reads directly from this sheet — so updating the data is the only maintenance step required each reporting cycle.
Support Sheet
 Support Sheet — Field Definitions and Setup Notes
The Support Sheet documents the column definitions and explains how each field feeds the report calculations. It also includes notes on how to extend the template (add rows, adjust slicer values, rename departments) so customization does not require Excel expertise beyond basic editing.
Banking Report in Excel vs. Google Sheets Banking Template vs. Paid Analytics — Feature Comparison
| Feature | Banking Report in Excel | Google Sheets Template | Tableau / Power BI Pro |
|---|---|---|---|
| Cost | $7.99 one-time ✅ | Free (limited charts) | $70–$100/user/month |
| Platform | Microsoft Excel ✅ | Google Sheets (online only) | Cloud SaaS |
| Setup time | Under 10 minutes ✅ | 5–15 min | Days (IT + connectors) |
| Works offline | Yes — full desktop ✅ | Requires internet | Requires internet |
| Native Excel slicers | Yes ✅ | Dropdown workarounds only | Yes (at full price) |
| High Risk Transaction chart | Pre-built ✅ | Not included | Custom build required |
| Branch region analysis | Pre-built ✅ | Not included | Custom build required |
| Year-1 cost (5 users) | $7.99 total ✅ | $0 (fewer features) | $4,200–$6,000 |
For banking teams that want branch-level performance visibility without enterprise-tool budgets, the Banking Report in Excel sits in the sweet spot.
Who Should Use This Template
✅ Perfect for:
- Bank branch managers tracking monthly transaction volume and fee performance
- Finance analysts producing management-ready banking performance reports
- Risk officers who monitor High Risk Transaction percentages by account type
- Operations teams analyzing service fee distribution across segments and departments
- Excel users at community banks, credit unions, and fintech companies
❌ Not a fit if:
- You need real-time integration with a core banking system (requires BI middleware)
- Your team needs simultaneous multi-user live editing (consider SharePoint + Power BI)
- You have no Excel experience at all — basic data entry skills are required
Real-World Use Cases
Rajesh manages operations for a regional bank with 12 branches. Each month he exports transaction data from the core banking system, pastes it into the Data Sheet, and uses the Summary Page to present branch-level performance to regional directors — showing which branches drove the highest transaction volume and where High Risk Transaction % spiked relative to the prior month.
Priya is a finance analyst at a fintech lending company. She uses the Report Page slicer to isolate Corporate vs. Retail customer segment transactions and tracks service fee contribution by department — work that used to take 3 hours in manual pivot tables now takes 15 minutes in the Banking Report in Excel.
Ahmed handles compliance reporting for a private bank’s risk department. The High Risk Transaction % by Account Type chart lets him flag risk concentrations instantly for the quarterly audit committee report, without rebuilding the analysis from scratch each cycle.
Advantages of Banking Report in Excel
- Zero recurring cost — $7.99 once vs. $70–$100/user/month for BI tools.
- Offline-first — Works on desktop Excel with no internet dependency, ideal for regulated environments where cloud tools require IT approval.
- Risk-focused analytics built in — High Risk Transaction % by Account Type is pre-built, not something you need to create from scratch.
- 10-minute refresh cycle — Monthly reporting that used to take hours becomes a paste-and-done operation.
- Slicer-based filtering — No VBA, no macros, no formulas to maintain — just native Excel slicers.
Opportunities for Improvement
- The template does not connect directly to core banking systems — data must be exported manually and pasted into the Data Sheet.
- Real-time refreshing requires the Excel file to be on a shared drive with manual data replacement — not automated like a live BI dashboard.
- If your transaction dataset exceeds ~50,000 rows, Excel may slow down; Power BI would be a better fit at that scale.
Best Practices
- Keep the Data Sheet column structure intact — do not rename or reorder the header row, as formulas reference columns by name.
- Export transaction data in the same column order each month to make pasting faster.
- Use the Support Sheet’s field mapping before customizing slicer dimension values.
- Save a master copy of the template before adding your data, so you can reset easily next month.
- When sharing with stakeholders, export the Summary Page as PDF to prevent accidental edits.
Explore Relevant Templates
If you found the Banking Report in Excel useful, explore these related templates on NextGenTemplates.com:
- Finance & Accounting Excel Templates — Full collection of financial reporting, budgeting, and analysis tools
- Excel Dashboard Templates — Interactive dashboards across Sales, HR, Operations, and Finance
Frequently Asked Questions
What KPIs does the Banking Report in Excel track?
The Banking Report in Excel tracks 12+ banking metrics including Total Amount, Total Transactions, Average Service Fee, High Risk Transaction %, and Net Branch Revenue — plus breakdowns by Branch Region, Account Type, Customer Segment, Department, and Month. All metrics update automatically from the Data Sheet.
Does this template work in Excel on Mac?
Yes. The Banking Report in Excel is compatible with Microsoft Excel on Windows and Mac (Excel 2016+). Slicers are fully functional on both platforms. It is not designed for Excel Online or LibreOffice Calc.
How long does setup take?
Under 10 minutes. Open the file, go to the Data Sheet, clear the sample data, and paste in your own banking transactions. The Summary Page charts and KPI cards refresh automatically with no formula editing needed.
Can I customize the slicer dimensions or add new charts?
Yes. Slicer values update automatically as you add new entries in the Data Sheet. New charts can be added by creating additional pivot charts from the same data source. The Support Sheet explains the data model to guide customization.
How does this compare to paid tools like Tableau or Power BI Pro?
Tableau and Power BI Pro cost $70–$100 per user per month and require IT-managed connector setup. The Banking Report in Excel provides equivalent branch and risk analytics for a one-time $7.99 — no subscription, no IT dependency, works offline.
Is there a Google Sheets version available?
Not currently. The Banking Report in Excel is built specifically for Microsoft Excel’s native slicer and pivot chart functionality. For Google Sheets analytics templates, visit NeoTechNavigators.com.
What happens if I add more transaction rows than the sample data?
The Data Sheet is designed as a structured Excel table, so new rows added within the table boundaries are automatically included in the pivot calculations. Charts and KPI cards expand to reflect all rows without any manual formula adjustments.
About the Author
Built by PK — Microsoft Certified Professional with 15+ years of Excel, Google Sheets, and Power BI experience. Founder of NextGenTemplates, reaching 300K+ subscribers across YouTube channels. Every template is hand-built and tested before release.
Conclusion
The Banking Report in Excel gives branch managers, finance analysts, and risk officers a structured, slicer-driven reporting tool that replaces hours of monthly manual work with a 10-minute data refresh. At a one-time cost of $7.99 — versus $70–$100/user/month for enterprise BI tools — it is one of the most cost-efficient banking reporting solutions available for Excel users.
Click here to Purchase the Banking Report in Excel
✅ Instant download · One-time payment · No subscription · Lifetime access
👉 Youtube.com/@PK-AnExcelExpert — Step-by-step tutorials
📅 Last updated: May 2026