Introduction
The Trade Associations KPI Dashboard is a comprehensive and ready-to-use template designed for tracking Outsourced Accounting KPIs. This dashboard simplifies the complex data management for trade associations by providing a clear, interactive, and dynamic interface to monitor Key Performance Indicators (KPIs) critical to your organization’s success. Whether you are managing membership growth, financial performance, or operational efficiency, this dashboard has you covered.
Click to buy Trade Associations KPI Dashboard in Excel
Key Features of Trade Associations KPI Dashboard
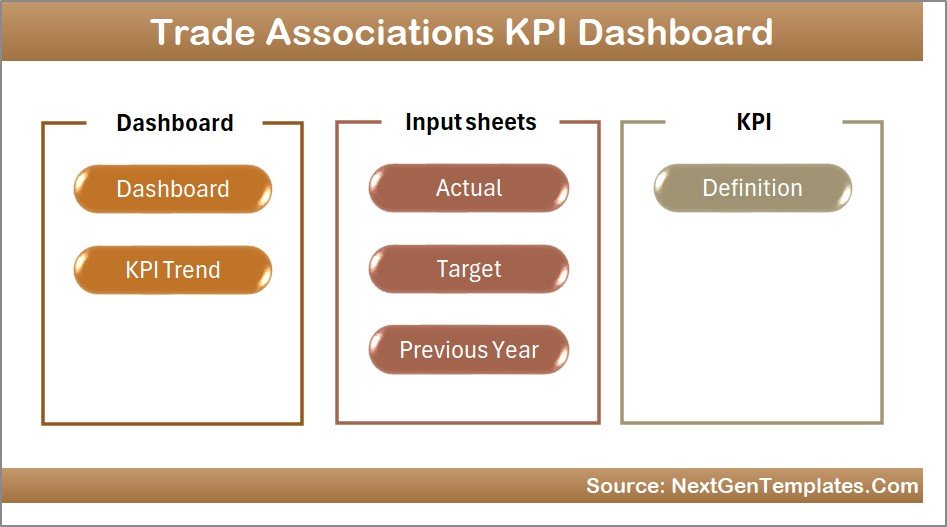
- Seven dedicated worksheets designed for ease of use and organization.
- Month selection drop-down to dynamically update all KPI data.
- Comprehensive display of Month-to-Date (MTD) and Year-to-Date (YTD) actuals, targets, and previous year comparisons.
- Conditional formatting with up/down arrows to visualize performance trends at a glance.
- Detailed KPI definition and formula documentation included.
- Input sheets for actual numbers, target numbers, and previous year data to facilitate easy updates.
- Trend analysis charts for KPI performance over time.
Dashboard Pages Explanation
1. Home Sheet
This is the central navigation hub of the dashboard, featuring six buttons that allow quick access to other sheets. It streamlines the experience by keeping all key functionalities just a click away.
Click to buy Trade Associations KPI Dashboard in Excel
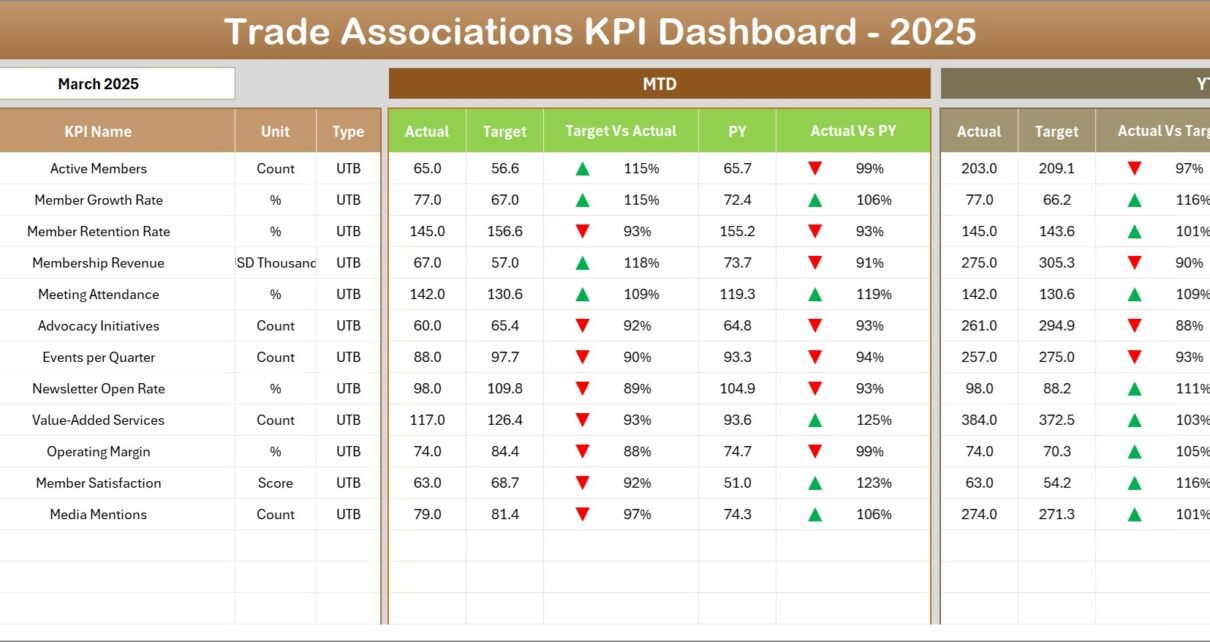
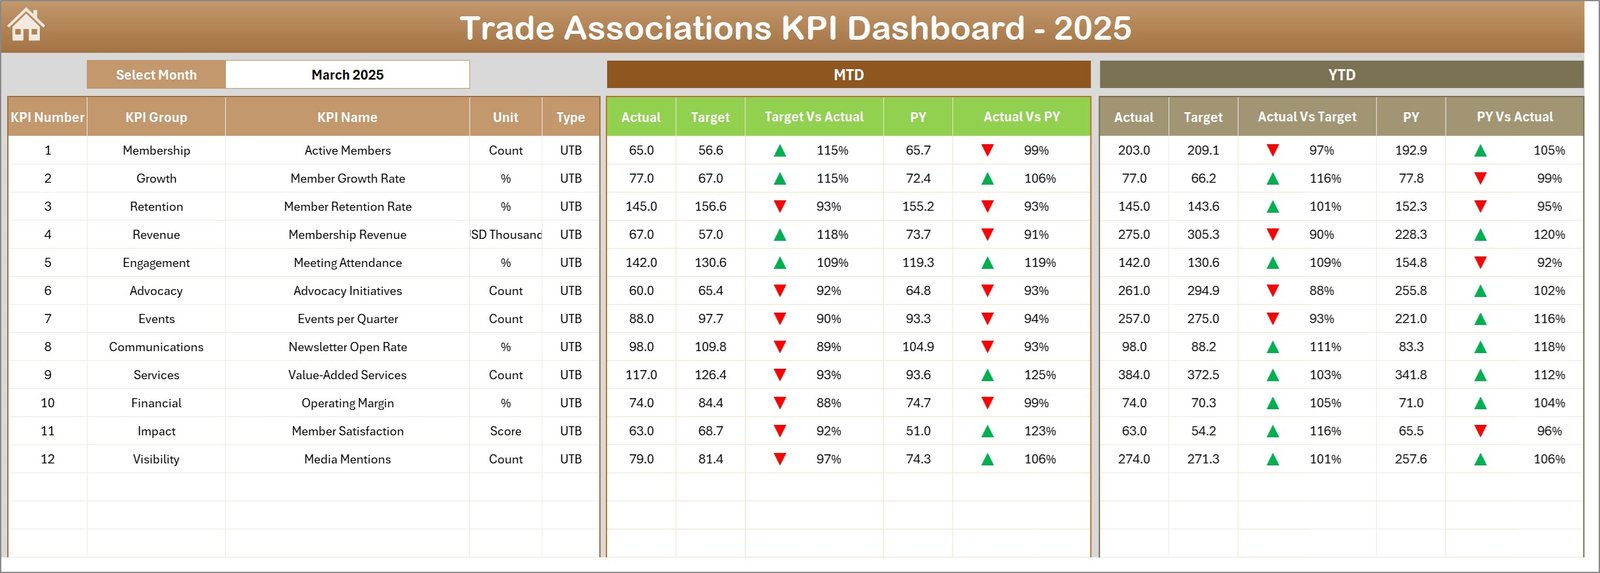
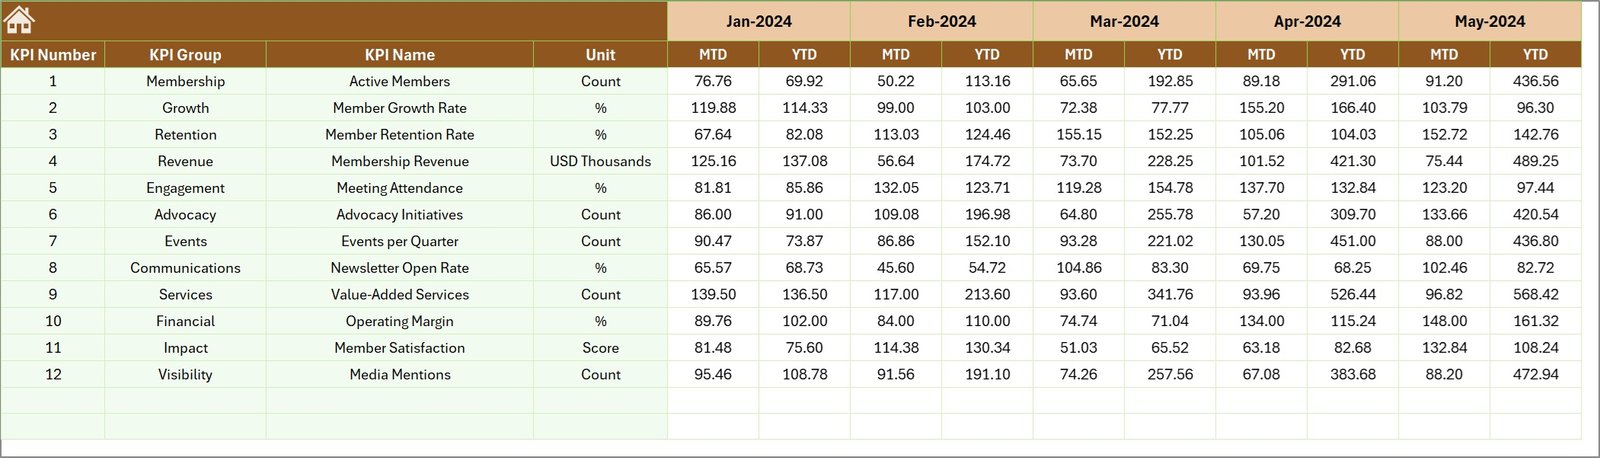
2. Dashboard Sheet Tab
The core of the template, this sheet displays all KPIs with their respective metrics. Users can select the month via a drop-down at cell D3, which dynamically updates the entire dashboard. It features:
- MTD Actual, Target, Previous Year data.
- Target vs. Actual and Previous Year vs. Actual comparisons with conditional formatting indicators.
- YTD metrics displayed similarly for a comprehensive view
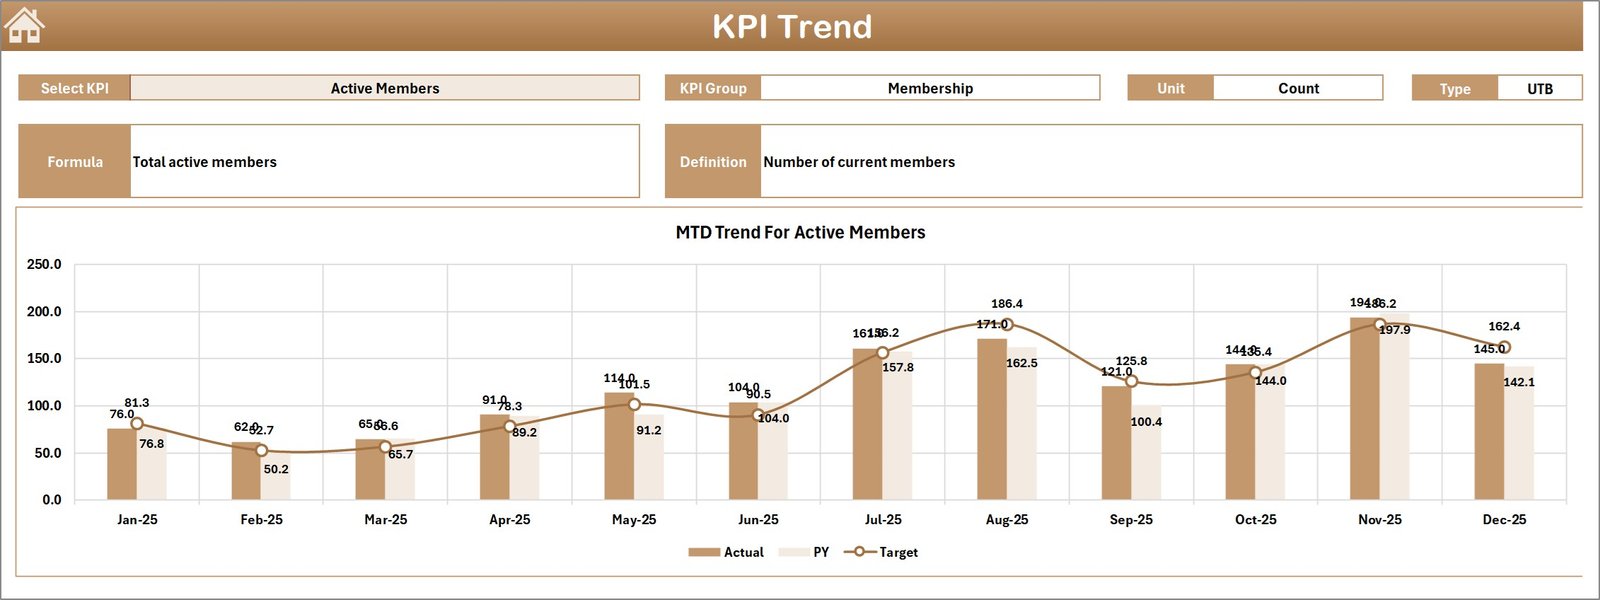
3. KPI Trend Sheet Tab
This sheet allows you to select any KPI from the drop-down at cell C3 and view detailed information such as KPI Group, unit, type (whether Lower the Better or Upper the Better), formula, and definition. It also showcases MTD and YTD trends with charts for Actual, Target, and Previous Year values.
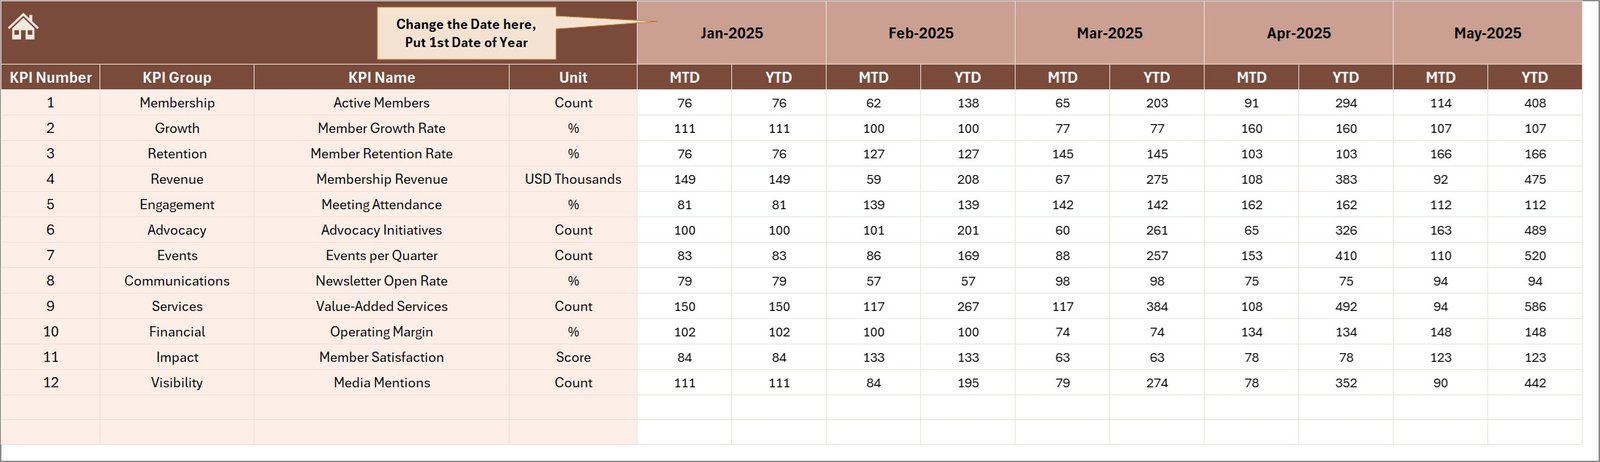
4. Actual Numbers Input Sheet
This input sheet is where you enter the MTD and YTD actual values for a selected month. You can set the starting month of the year in cell E1, ensuring flexibility for various fiscal calendars.
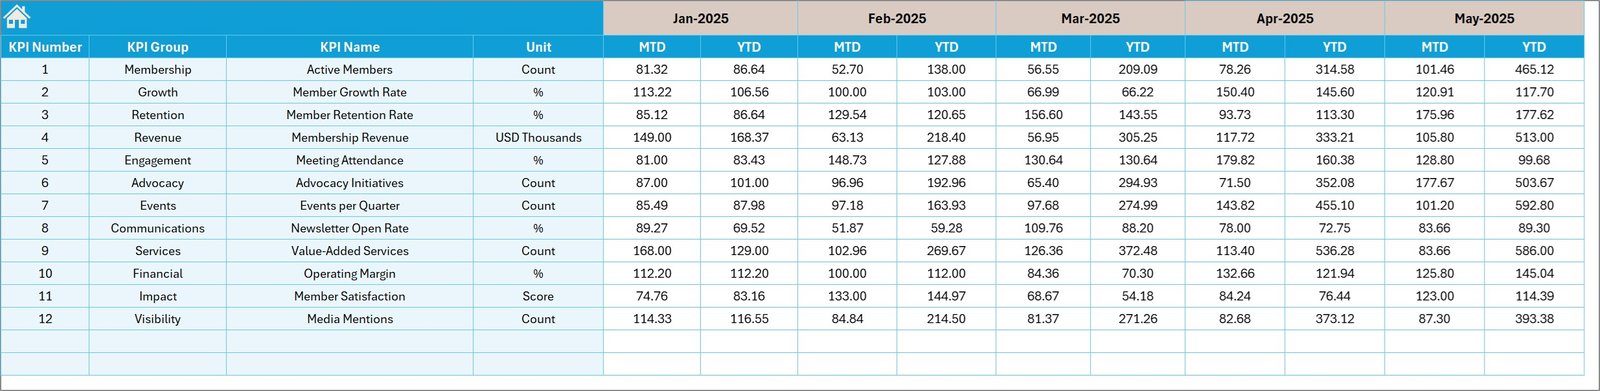
5. Target Numbers Input Sheet
Here, you input your monthly targets for each KPI, for both MTD and YTD periods. This ensures your dashboard can compare actual performance against goals effectively.
6. Previous Year Numbers Sheet Tab
This sheet is for storing the previous year’s KPI data corresponding to each month, facilitating historical performance comparison in the dashboard.
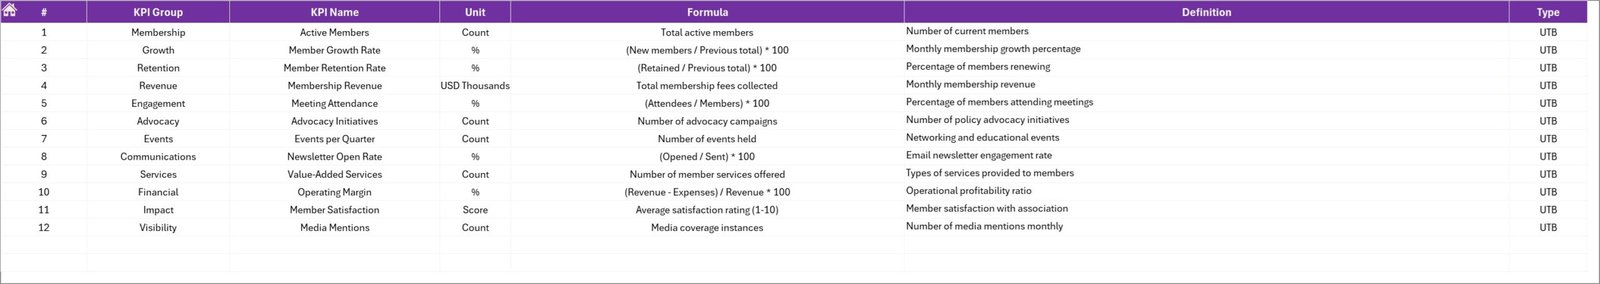
7. KPI Definition Sheet Tab
This final sheet tab documents comprehensive details for each KPI including:
- KPI Name
- KPI Group
- Unit
- Formula
- Definition
- KPI Type (LTB: Lower the Better or UTB: Upper the Better)
Maintaining this sheet is essential for clarity and consistency across your KPI analysis.
Advantages of Trade Associations KPI Dashboard
- Ease of Use: Intuitive navigation with the Home sheet and clearly labeled tabs simplifies working with complex data.
- Time-Saving: Pre-built formulas and charts reduce manual work and errors.
- Dynamic Analysis: Month selector and conditional formatting enable quick insights into performance trends.
- Comprehensive Data Management: Separate input sheets and detailed KPI definitions improve data accuracy and understanding.
- Visual Clarity: Charts and conditional icons provide at-a-glance grasp on performance status.
Opportunities for Improvement
- Integrate automated data imports from accounting software like QuickBooks or Xero to reduce manual entry.
- Add more customizable KPI categories based on specific trade association activities.
- Implement alert systems for KPIs that are significantly off-target.
- Mobile-friendly or web-based versions for better accessibility.
Best Practices
- Regularly update actuals, targets, and previous year data to ensure dashboard relevance.
- Validate KPI definitions and formulas to reflect current business objectives.
- Train users on navigating the dashboard and interpreting the metrics correctly.
- Leverage trend charts to plan and adjust strategies promptly.
FAQs
Can I customize KPIs within the dashboard?
Yes, the KPI Definition sheet allows you to add or modify KPIs along with their formulas and definitions.
Is this dashboard suitable for all types of trade associations?
Absolutely. The dashboard is versatile enough for various trade associations as it tracks generic accounting KPIs. Customization options allow it to fit specific needs.
Do I need advanced Excel skills to use this dashboard?
Basic to intermediate Excel skills are sufficient, as the dashboard design focuses on user-friendliness with drop-downs and buttons.
Conclusion
Implementing the Trade Associations KPI Dashboard empowers your organization with a robust tool to monitor, analyze, and manage critical KPIs effectively. By bringing all your key metrics under one intuitive interface, you can drive smarter decisions, improve financial health, and enhance operational transparency. Start leveraging this dashboard today to take your trade association’s performance tracking to the next level.
Watch the step-by-step video tutorial:
Click to buy Trade Associations KPI Dashboard in Excel
For more information on Excel dashboards and templates, visit the official Microsoft Excel support page.
Visit our YouTube channel to watch the demo. Youtube.com/@NextGenTemplates