Corruption remains one of the biggest challenges for governments, organizations, and regulatory agencies across the world. Because corruption directly impacts economic growth, public trust, and institutional credibility, authorities must track investigations, monitor recovery amounts, and analyze case resolution rates effectively.
However, many anti-corruption units still rely on scattered spreadsheets and manual reports. As a result, leaders struggle to understand investigation performance and financial recovery trends quickly.
Therefore, organizations increasingly adopt data-driven dashboards to manage corruption investigations efficiently. One powerful solution is the Anti-Corruption Units Dashboard in Power BI.
The Anti-Corruption Units Dashboard in Power BI helps investigative agencies monitor corruption cases, analyze financial impact, track recovery amounts, and evaluate investigation performance in a centralized visual interface. Moreover, the dashboard transforms complex case data into meaningful insights that support faster and better decision-making.
In this article, you will learn everything about the Anti-Corruption Units Dashboard in Power BI, including its structure, features, advantages, best practices, and frequently asked questions.
Click to buy Anti-Corruption Units Dashboard in Power BI
What Is an Anti-Corruption Units Dashboard in Power BI?
An Anti-Corruption Units Dashboard in Power BI is an interactive analytical reporting system built in Microsoft Power BI that allows anti-corruption departments, regulatory agencies, and investigation teams to track corruption-related cases and financial recovery.
Instead of reviewing dozens of reports manually, the dashboard consolidates investigation data into a single visual platform. As a result, decision-makers can quickly analyze trends, evaluate investigation efficiency, and measure financial recovery performance.
Furthermore, Power BI provides interactive filters, dynamic visuals, and automated calculations. Because of this capability, investigators can explore corruption patterns by region, corruption type, investigator, and time period.
Consequently, the dashboard supports transparency, accountability, and operational efficiency within anti-corruption agencies.
Why Do Anti-Corruption Units Need a Dashboard?
Anti-corruption departments handle large volumes of sensitive investigation data. Therefore, monitoring cases manually becomes extremely difficult.
A dedicated dashboard solves this challenge by providing real-time insights and performance tracking.
Here are some major reasons why organizations adopt corruption monitoring dashboards:
- Investigative teams must track case progress and resolution rates.
- Authorities need to monitor financial recovery amounts.
- Managers must analyze corruption patterns and trends.
- Leadership teams require transparent reporting and accountability.
- Analysts must evaluate regional corruption trends.
Because of these needs, a Power BI dashboard becomes a powerful decision-support tool.
Key Features of the Anti-Corruption Units Dashboard in Power BI
The Anti-Corruption Units Dashboard includes multiple analytical pages designed to provide detailed insights into corruption investigations.
The dashboard contains five interactive pages within the Power BI Desktop application.
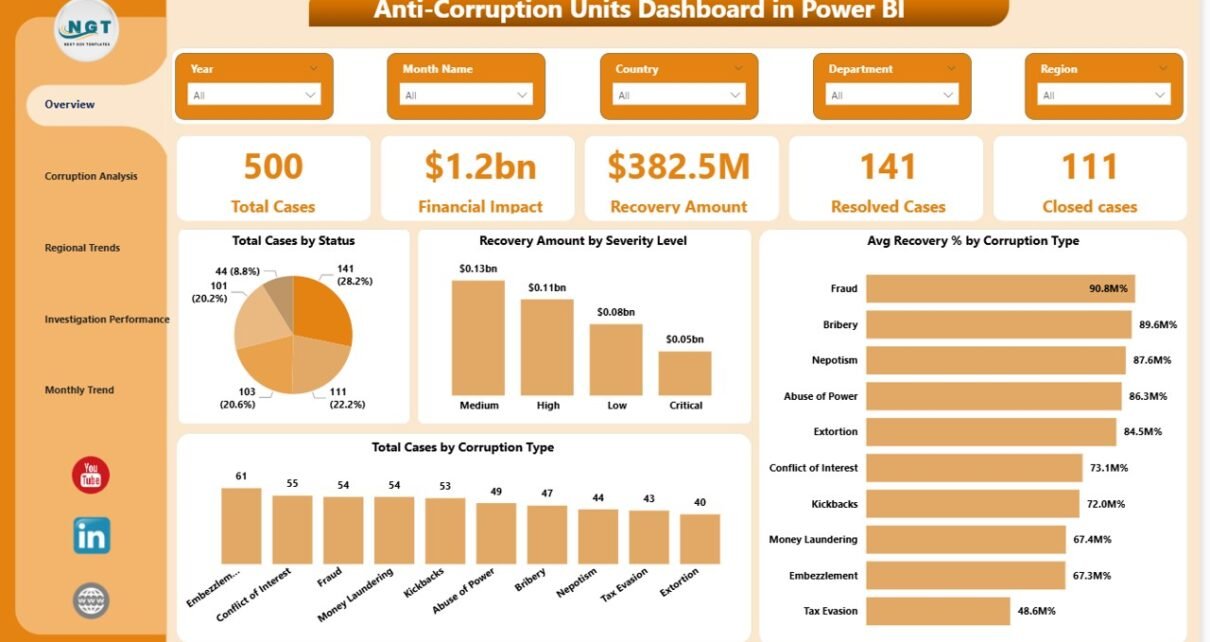
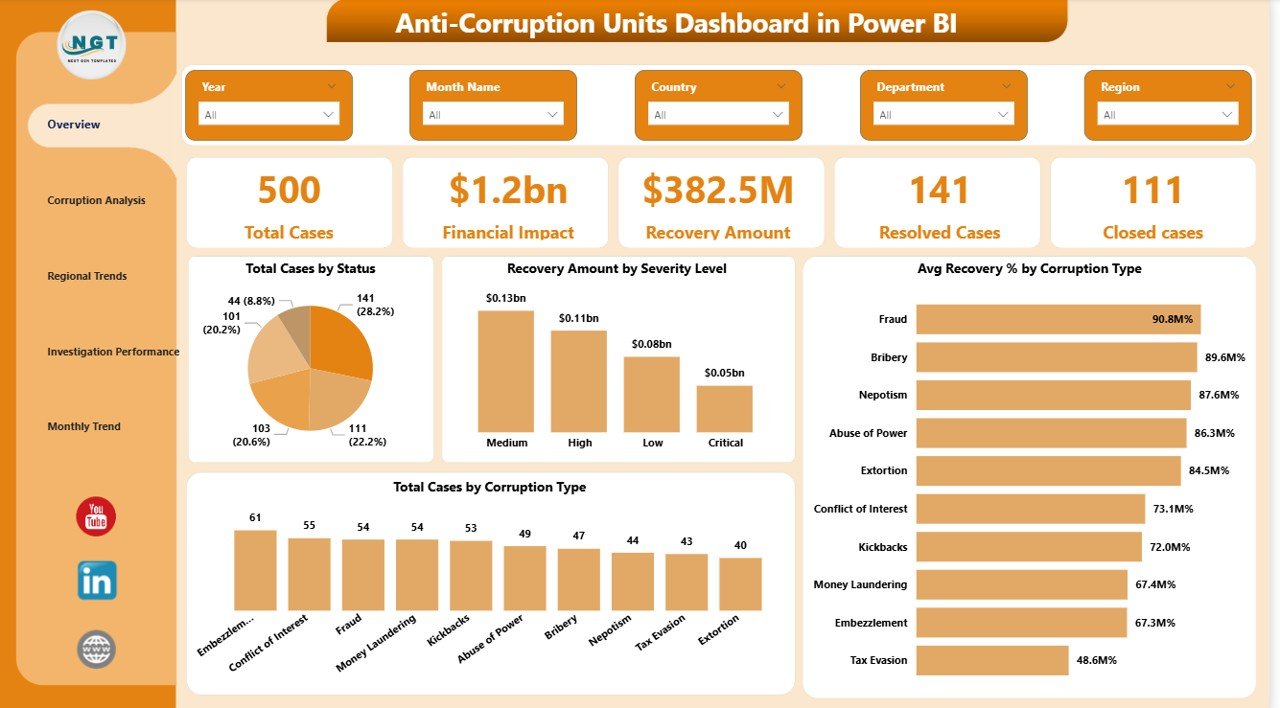
Overview Page – What Is the Overall Corruption Investigation Status?
The Overview Page serves as the main summary dashboard. It provides a high-level view of corruption cases, financial impact, and investigation outcomes.
Users can quickly understand the current investigation performance through key metrics and visual charts.
KPI Cards on the Overview Page
The dashboard displays five key performance indicators:
- Total Cases – The total number of corruption cases recorded.
- Financial Impact – The overall financial damage caused by corruption cases.
- Recovery Amount – The total recovered funds through investigations.
- Resolved Cases – The number of cases that investigators successfully resolved.
- Closed Cases – The total number of cases officially closed.
Charts on the Overview Page
The page also includes four analytical charts:
- Total Cases by Status – Shows the distribution of cases by investigation status.
- Recovery Amount by Severity Level – Displays recovery amounts based on corruption severity.
- Total Cases by Corruption Type – Identifies the most common types of corruption.
- Average Recovery Percentage by Corruption Type – Shows recovery efficiency for each corruption category.
Because this page summarizes investigation activity, leaders can instantly evaluate the overall performance of anti-corruption units.
Click to buy Anti-Corruption Units Dashboard in Power BI
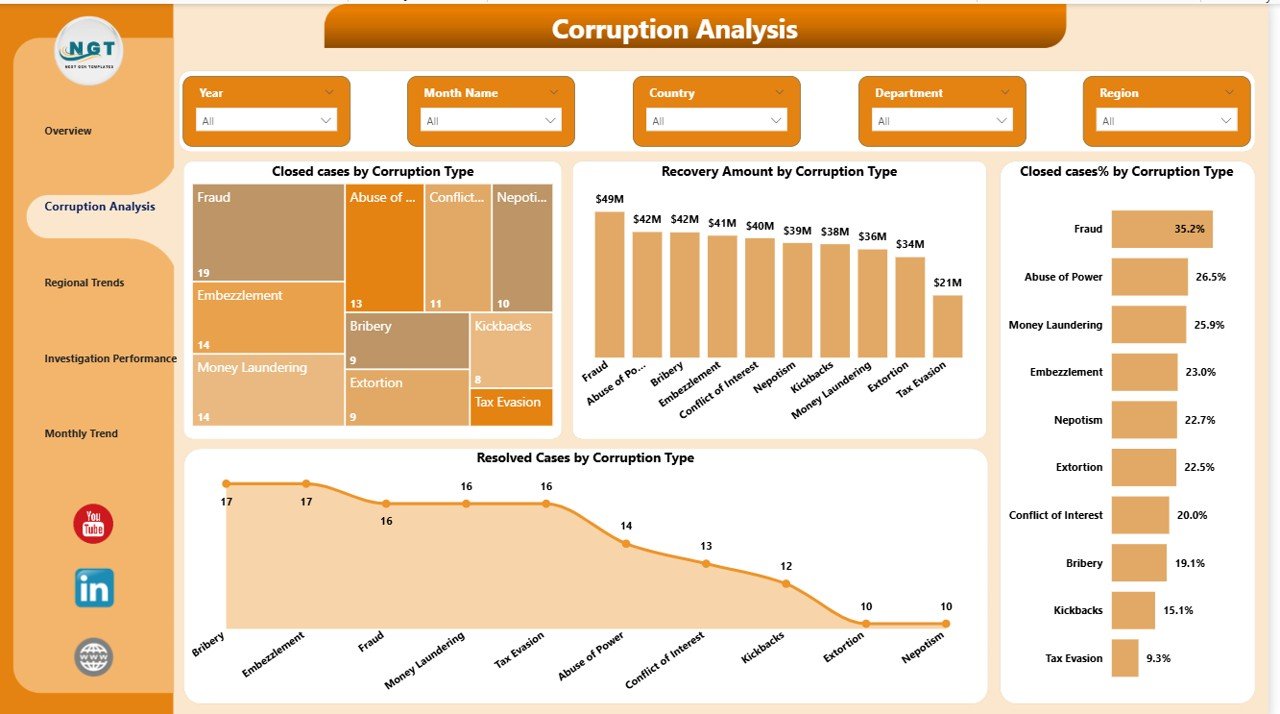
Corruption Analysis – Which Types of Corruption Are Most Common?
The Corruption Analysis Page focuses on understanding corruption categories and case outcomes.
Since corruption can occur in many forms such as bribery, fraud, embezzlement, or procurement manipulation, analyzing corruption types becomes extremely important.
Charts in the Corruption Analysis Page
This page includes four charts:
- Closed Cases by Corruption Type
- Recovery Amount by Corruption Type
- Closed Cases Percentage by Corruption Type
- Resolved Cases by Corruption Type
These visuals allow investigators to identify:
- Which corruption types occur most frequently
- Which cases generate the highest financial impact
- Which corruption categories achieve higher recovery rates
As a result, agencies can prioritize resources toward high-risk corruption areas.
Click to buy Anti-Corruption Units Dashboard in Power BI
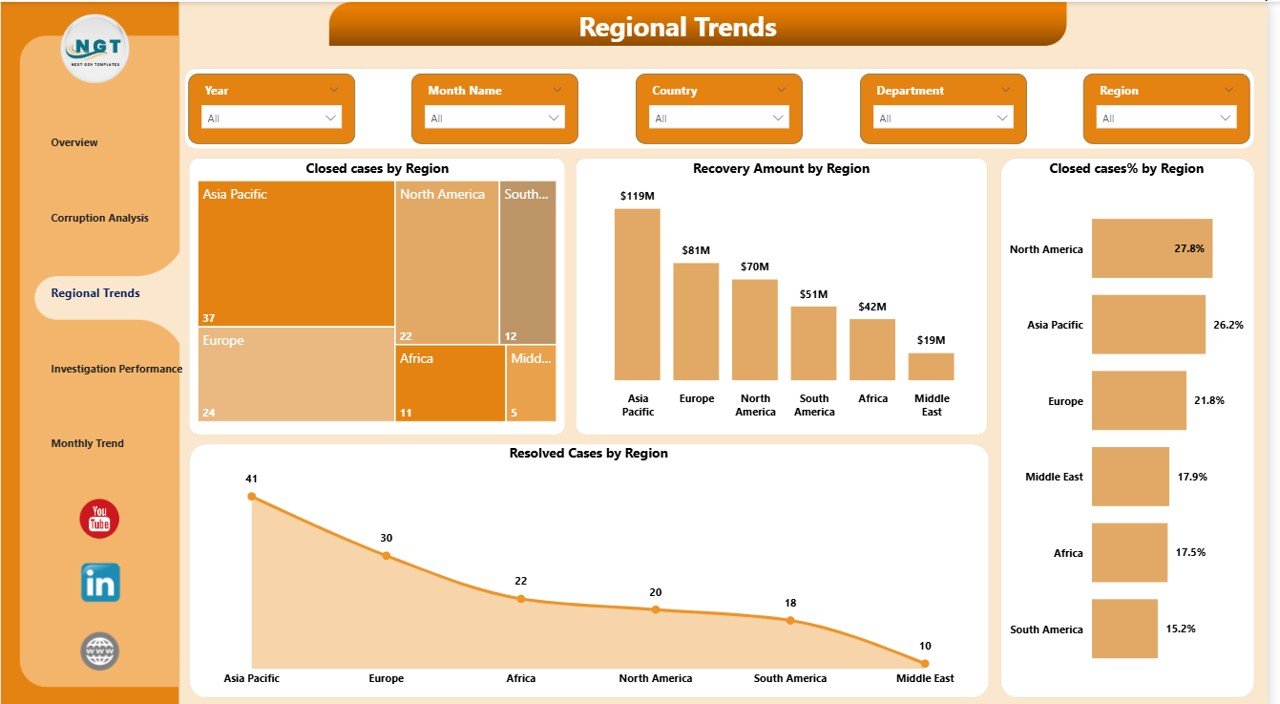
Regional Trends – Which Regions Have the Highest Corruption Cases?
Corruption trends often vary across regions. Therefore, analyzing geographical patterns becomes essential.
The Regional Trends Page helps authorities understand corruption activity across different regions.
Charts in the Regional Trends Page
This section includes four visual charts:
- Closed Cases by Region
- Recovery Amount by Region
- Closed Cases Percentage by Region
- Resolved Cases by Region
With these visuals, leaders can quickly identify:
- Regions with the highest corruption cases
- Regions generating the largest financial losses
- Regions with the strongest recovery performance
Consequently, governments and agencies can target anti-corruption initiatives more effectively.
Click to buy Anti-Corruption Units Dashboard in Power BI
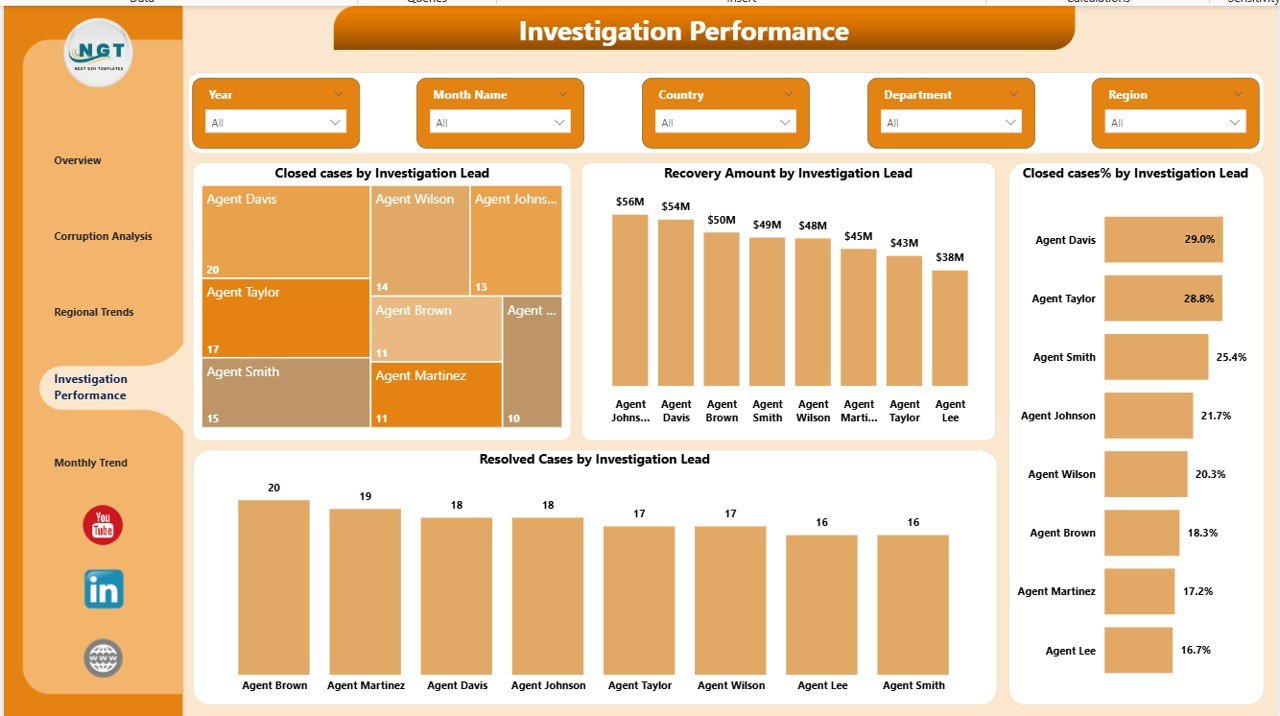
Investigation Performance – How Efficient Are Investigators?
Monitoring investigator performance remains essential for improving investigation efficiency.
The Investigation Performance Page evaluates how investigation teams handle corruption cases.
Charts on the Investigation Performance Page
This section includes four analytical charts:
- Closed Cases by Investigation Lead
- Recovery Amount by Investigation Lead
- Closed Cases Percentage by Investigation Lead
- Resolved Cases by Investigation Lead
These visuals allow supervisors to analyze:
- Investigator productivity
- Case closure rates
- Recovery performance
- Investigator workload distribution
As a result, management teams can optimize investigation strategies and improve performance.
Click to buy Anti-Corruption Units Dashboard in Power BI
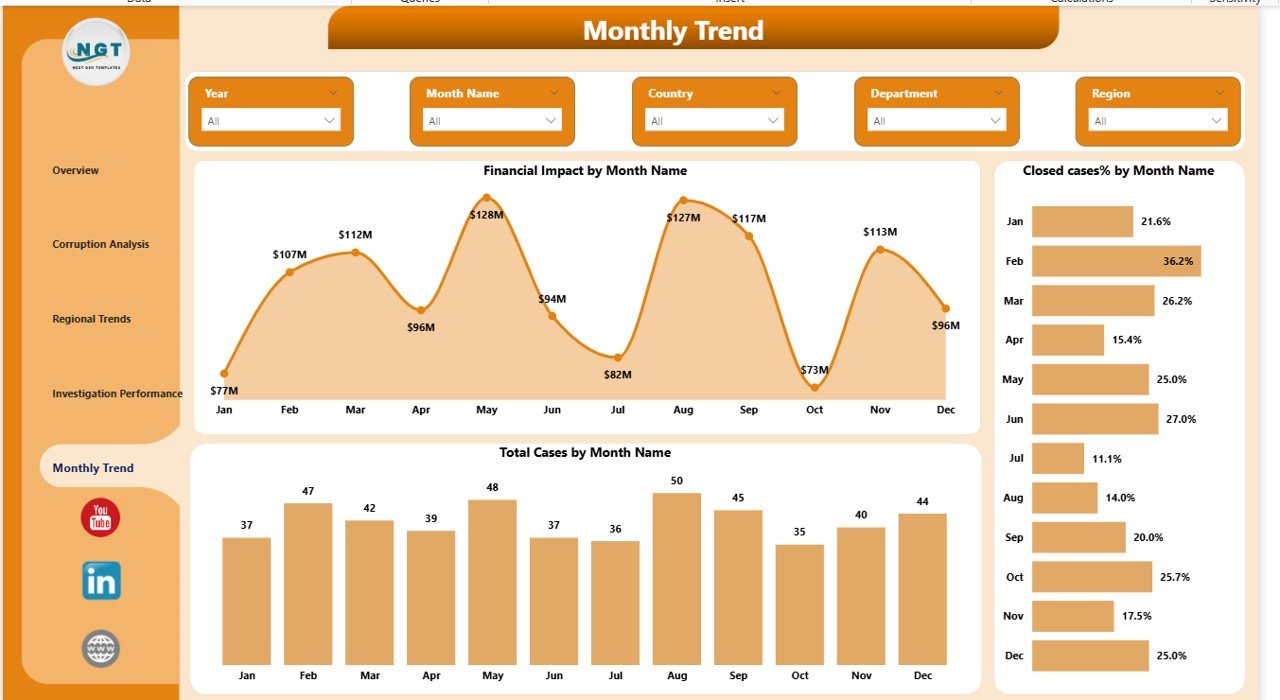
Month Analysis – How Do Corruption Trends Change Over Time?
Corruption investigations evolve over time. Therefore, time-based analysis helps authorities understand investigation progress and financial impact.
The Month Analysis Page focuses on monthly corruption trends.
Charts in the Month Analysis Page
The page includes three key charts:
- Financial Impact by Month
- Closed Cases Percentage by Month
- Total Cases by Month
These visuals help analysts identify:
- Seasonal corruption patterns
- Monthly investigation performance
- Changes in financial impact over time
Consequently, agencies can evaluate how anti-corruption efforts improve month by month.
Click to buy Anti-Corruption Units Dashboard in Power BI
Advantages of the Anti-Corruption Units Dashboard in Power BI
Organizations gain multiple benefits when they implement a Power BI corruption monitoring dashboard.
- Improved Transparency
The dashboard provides a clear view of corruption cases and investigation outcomes. Therefore, leadership teams can maintain transparency in reporting.
- Faster Decision-Making
Instead of analyzing spreadsheets manually, decision-makers can review real-time insights instantly.
- Better Financial Recovery Tracking
Authorities can easily monitor recovery amounts and evaluate investigation effectiveness.
- Improved Investigation Performance
The dashboard highlights investigator productivity and case resolution performance.
- Data-Driven Anti-Corruption Strategies
Because the dashboard reveals patterns and trends, agencies can design targeted anti-corruption policies.
Best Practices for the Anti-Corruption Units Dashboard
While dashboards provide powerful insights, organizations must follow best practices to maximize their effectiveness.
- Maintain Accurate Data Collection
Ensure that investigators enter case data consistently. Clean data improves dashboard accuracy.
- Use Standard Corruption Categories
Standardized corruption types help analysts compare trends across regions and time periods.
- Monitor Recovery Efficiency
Track recovery percentages regularly to evaluate investigation success.
- Update Data Frequently
Regular updates ensure the dashboard reflects the latest investigation status.
- Ensure Secure Data Access
Since corruption cases contain sensitive information, organizations must restrict access appropriately.
Who Can Benefit from the Anti-Corruption Units Dashboard?
Several organizations can benefit from this dashboard.
Government Anti-Corruption Agencies
Authorities can monitor corruption cases and recovery performance.
Law Enforcement Agencies
Investigation teams can track case progress and investigator performance.
Regulatory Authorities
Regulators can analyze corruption trends and compliance issues.
Internal Audit Departments
Audit teams can identify suspicious activities and financial irregularities.
Compliance Departments
Organizations can monitor anti-corruption compliance programs.
How Does Power BI Improve Anti-Corruption Reporting?
Power BI offers several advanced capabilities that make it ideal for corruption monitoring dashboards.
Interactive Visualizations
Users can explore corruption data using filters and drill-down analysis.
Real-Time Reporting
Power BI updates reports automatically when data changes.
Data Integration
The platform integrates data from multiple sources including Excel, databases, and ERP systems.
Advanced Analytics
Users can analyze trends, forecast corruption risks, and evaluate investigation performance.
Future of Anti-Corruption Analytics
Technology continues to transform corruption monitoring and investigation processes.
Several advanced technologies will shape the future of anti-corruption analytics:
- Artificial Intelligence for fraud detection
- Machine learning models for corruption risk prediction
- Automated case investigation systems
- Blockchain-based transparency systems
- Advanced data visualization platforms
Because of these innovations, data-driven corruption monitoring will become even more powerful.
Conclusion
Corruption investigations require accurate data tracking, efficient monitoring, and transparent reporting. Without proper analytical tools, agencies struggle to evaluate case progress and financial recovery.
The Anti-Corruption Units Dashboard in Power BI provides a centralized platform that transforms complex investigation data into meaningful insights. Through interactive visuals, KPI indicators, and detailed analytical pages, organizations can monitor corruption trends, evaluate investigator performance, and improve recovery outcomes.
Furthermore, the dashboard promotes transparency, accountability, and better decision-making across anti-corruption departments.
As organizations increasingly adopt data-driven strategies, Power BI dashboards will play a critical role in strengthening corruption monitoring systems worldwide.
Frequently Asked Questions (FAQs)
What is an Anti-Corruption Units Dashboard?
An Anti-Corruption Units Dashboard is an analytical reporting system that helps organizations monitor corruption cases, financial impact, recovery amounts, and investigation performance.
Why should organizations use Power BI for corruption monitoring?
Power BI provides interactive visuals, real-time reporting, and advanced analytics. Therefore, it becomes an excellent tool for monitoring corruption investigations.
What data is required for this dashboard?
Typical datasets include:
- Case ID
- Corruption type
- Investigation lead
- Region
- Case status
- Financial impact
- Recovery amount
- Investigation date
How does this dashboard improve investigation performance?
The dashboard tracks case closures, investigator performance, and financial recovery. As a result, agencies can identify inefficiencies and improve investigation processes.
Can organizations customize the dashboard?
Yes. Organizations can customize metrics, filters, and visualizations based on their investigation requirements.
Is Power BI secure for corruption investigation data?
Yes. Power BI provides role-based access control and data security features that protect sensitive investigation data.
Visit our YouTube channel to learn step-by-step video tutorials
Watch the step-by-step video tutorial:
Click to buy Anti-Corruption Units Dashboard in Power BI