Cities around the world are transforming rapidly. Governments and urban planners now focus on building smart cities that improve the quality of life for citizens while promoting sustainability, efficiency, and innovation. Smart city projects include initiatives such as smart transportation, renewable energy systems, digital governance, IoT infrastructure, and environmental sustainability programs.
However, managing multiple smart city initiatives becomes challenging without a proper monitoring system. Cities often run dozens or even hundreds of projects simultaneously. These projects involve different departments, budgets, timelines, risks, and measurable impacts.
Therefore, city administrators and project managers need a powerful tool to monitor and analyze project performance. This is where the Smart Cities Project Dashboard in Excel becomes extremely valuable.
The Smart Cities Project Dashboard in Excel is a ready-to-use analytics template that helps organizations track urban development projects, monitor budgets, evaluate environmental impact, and measure citizen benefits. By organizing all project data into a structured dashboard, decision-makers can quickly understand project performance and make data-driven decisions.
In this article, we will explore what the Smart Cities Project Dashboard in Excel is, why organizations need it, how it works, its key features, advantages, best practices, and frequently asked questions.
Click to Purchases Smart Cities Project Dashboard in Excel
What is a Smart Cities Project Dashboard in Excel?
A Smart Cities Project Dashboard in Excel is a data visualization and project monitoring tool designed to track urban development initiatives.
Cities implement many projects related to infrastructure, sustainability, digital transformation, and citizen services. Managing these initiatives requires clear insights into project progress, budgets, environmental impact, and operational risks.
This Excel dashboard helps organizations monitor these metrics in a centralized and interactive format.
Through this dashboard, decision-makers can:
-
Track total smart city projects
-
Monitor project budgets and spending
-
Measure environmental impact such as energy savings and CO₂ reduction
-
Evaluate project risks and delivery performance
-
Analyze trends across months and regions
Because Excel offers powerful data analysis and visualization capabilities, this dashboard allows users to monitor city development initiatives efficiently.
Why Do Cities Need a Smart Cities Project Dashboard?
Modern cities manage complex ecosystems that involve transportation systems, public utilities, environmental initiatives, and digital infrastructure.
Without a structured monitoring system, administrators often face several challenges.
Common Challenges Without Project Dashboards
-
Difficulty tracking multiple projects across departments
-
Lack of transparency in budget utilization
-
Limited visibility into project performance
-
Inefficient reporting processes
-
Difficulty measuring citizen impact and sustainability outcomes
However, when cities implement a Smart Cities Project Dashboard, they can solve these challenges effectively.
Benefits of Using a Smart Cities Dashboard
-
Centralized project monitoring
-
Improved transparency in government initiatives
-
Better resource allocation
-
Faster decision-making
-
Improved project accountability
As a result, city administrators can manage smart city initiatives more efficiently.
Click to Purchases Smart Cities Project Dashboard in Excel
Key Features of Smart Cities Project Dashboard in Excel
This Smart Cities Project Dashboard in Excel is a ready-to-use template that helps organizations monitor urban projects in a structured format.
The dashboard includes five analytical pages designed to provide insights from different perspectives.
Additionally, a Page Navigator located on the left side allows users to switch between analytical pages easily.
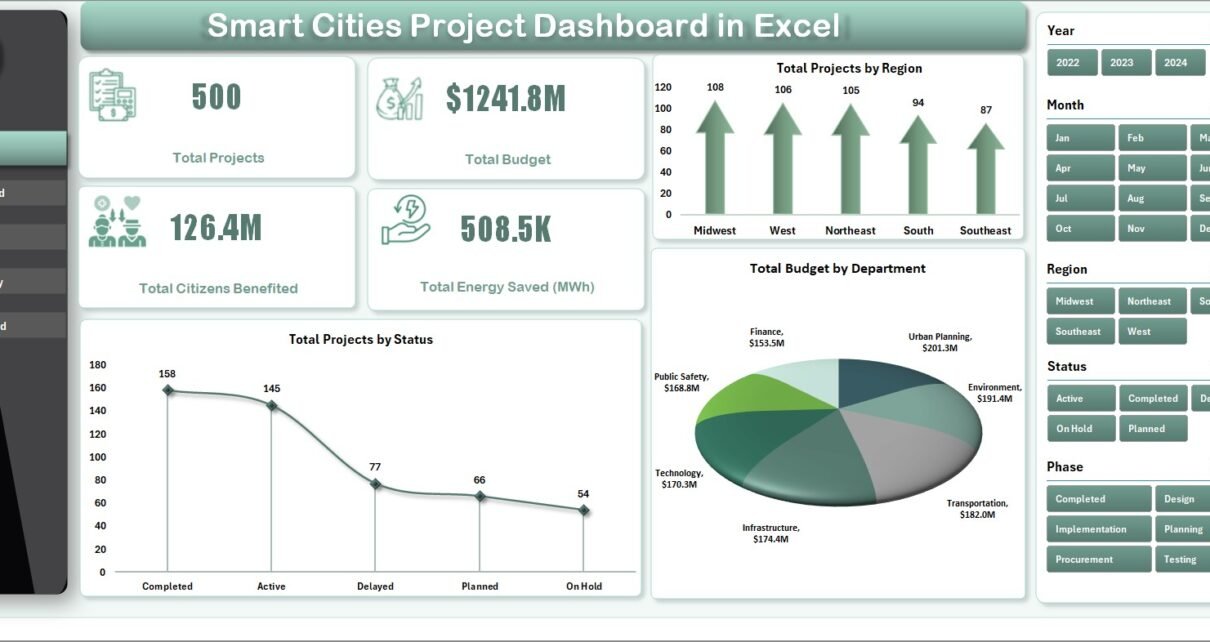
1. Overview Page – Complete Snapshot of Smart City Projects

The Overview Page serves as the main dashboard of the system. It provides a high-level summary of smart city initiatives.
On the right side of the dashboard, users can find slicers that allow them to filter data dynamically.
KPI Cards on the Overview Page
This page displays four key metrics:
-
Total Projects – Total number of smart city initiatives
-
Total Budget – Total allocated budget for all projects
-
Total Citizens Benefited – Number of citizens impacted by the projects
-
Total Energy Saved (MWh) – Total energy savings achieved
These KPI cards allow decision-makers to quickly understand the overall impact of city initiatives.
Charts on the Overview Page
The Overview page includes three charts:
Total Projects by Region
This chart shows how projects are distributed across different geographic regions.
Total Projects by Status
This chart helps administrators track project progress, such as:
-
Completed projects
-
Ongoing projects
-
Planned projects
Total Budget by Department
This chart shows which departments receive the largest project budgets.
Because of these visual insights, administrators can easily evaluate project distribution and financial allocation.
2. Budget Spend Analysis Page – Financial Monitoring
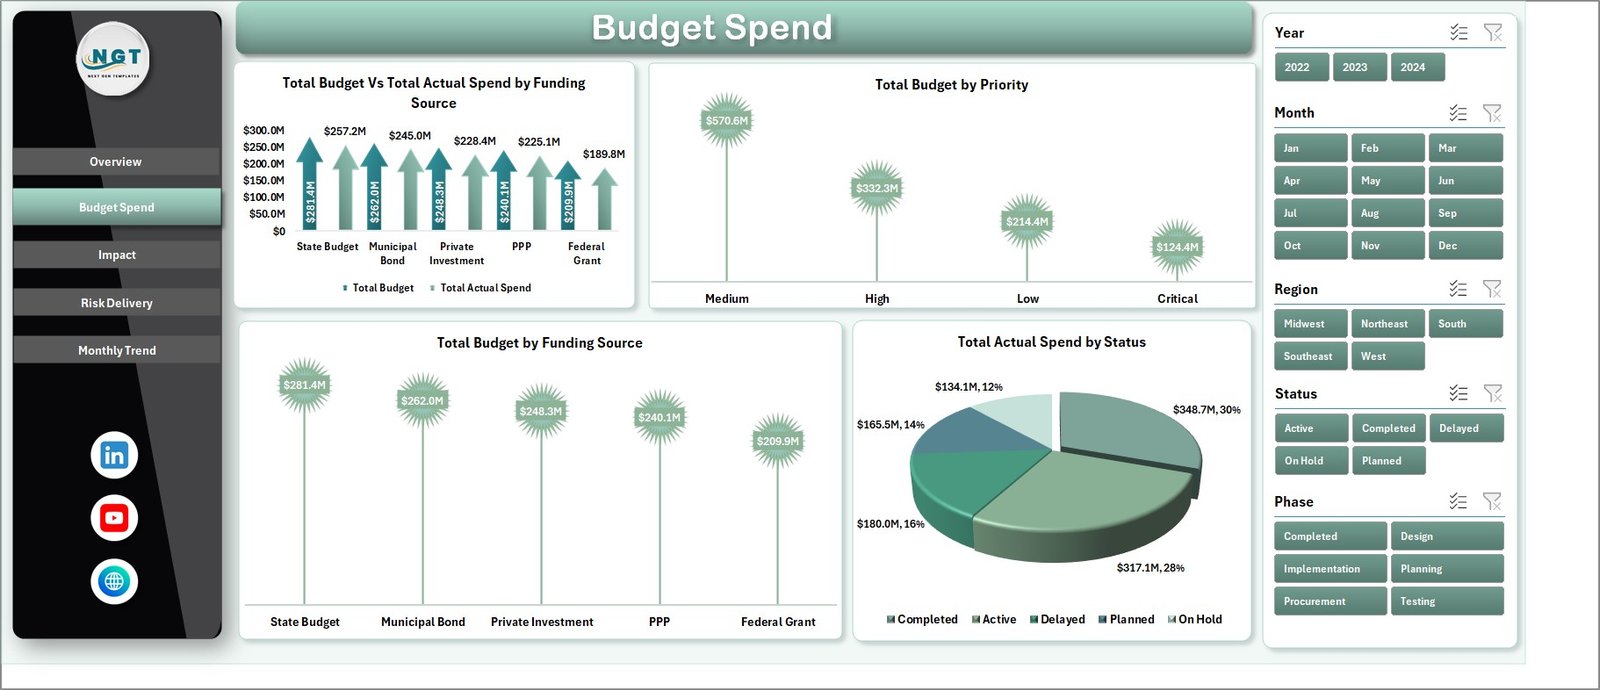
Budget management plays a crucial role in smart city initiatives. Therefore, the dashboard includes a Budget Spend Analysis page to monitor financial performance.
Users can filter data using slicers located on the right side.
Charts Available on This Page
Total Budget vs Actual Spend by Funding Source
This chart compares allocated budgets with actual spending across different funding sources.
Total Budget by Priority
This chart shows how funds are allocated based on project priority levels.
Total Budget by Funding Source
This chart highlights how projects receive funding from various sources such as government grants, private partnerships, or development funds.
Total Actual Spend by Status
This chart shows how much budget has been spent on completed, ongoing, or delayed projects.
As a result, financial managers can monitor budget efficiency and ensure responsible spending.
3. Impact Analysis Page – Measuring Smart City Benefits
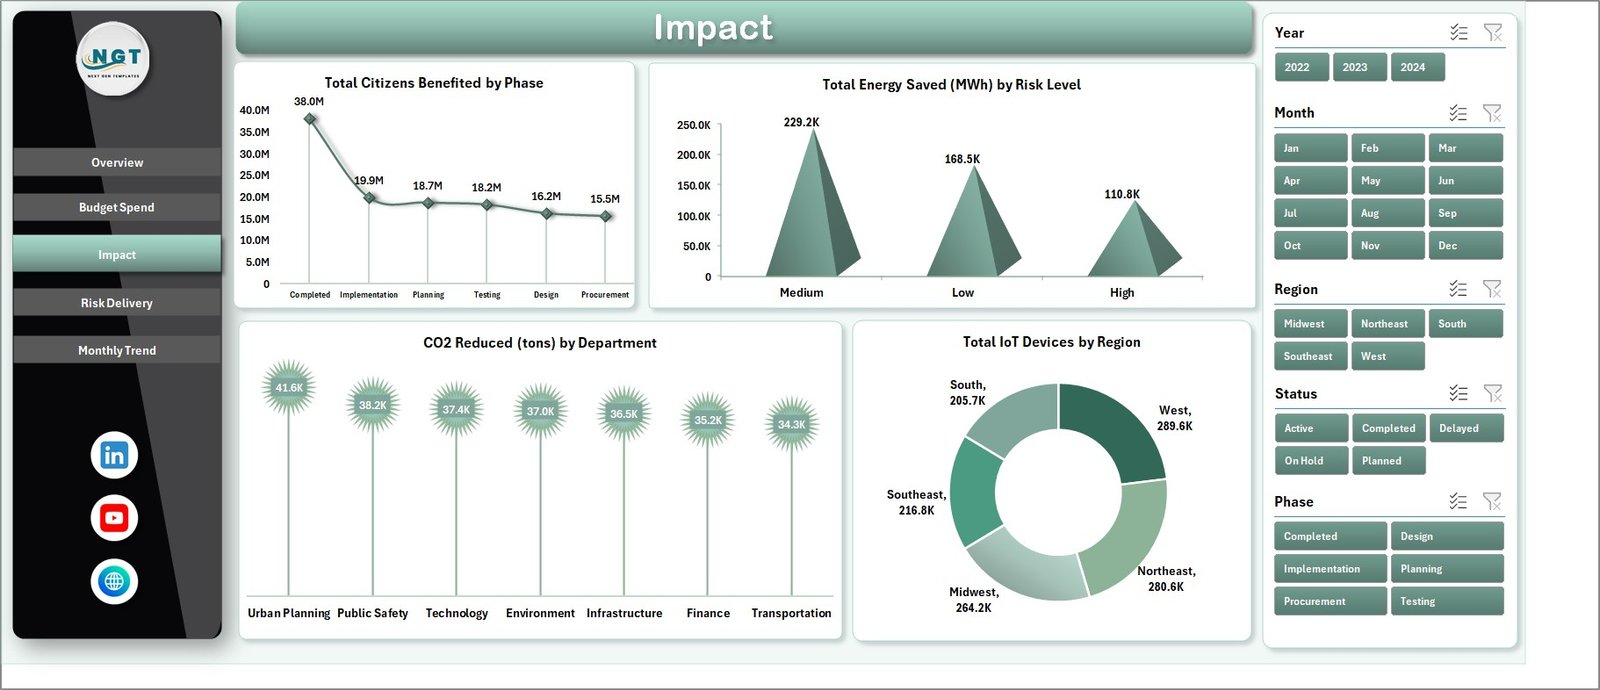
Smart city initiatives aim to improve citizens’ lives while promoting sustainability.
The Impact Analysis Page helps organizations measure the real-world impact of city projects.
Charts on This Page
Total Citizens Benefited by Phase
This chart measures how many citizens benefit from projects in different phases.
Total Energy Saved (MWh) by Risk Level
This chart shows the relationship between project risk levels and energy savings.
CO₂ Reduced (Tons) by Department
Environmental sustainability remains a key goal of smart cities. This chart tracks carbon emission reductions achieved by different departments.
Total IoT Devices by Region
IoT devices power many smart city services such as smart lighting, traffic monitoring, and environmental sensors.
This chart shows the distribution of IoT devices across regions.
Because of these insights, decision-makers can evaluate environmental and social benefits effectively.
Click to Purchases Smart Cities Project Dashboard in Excel
4. Risk Delivery Page – Monitoring Project Risks
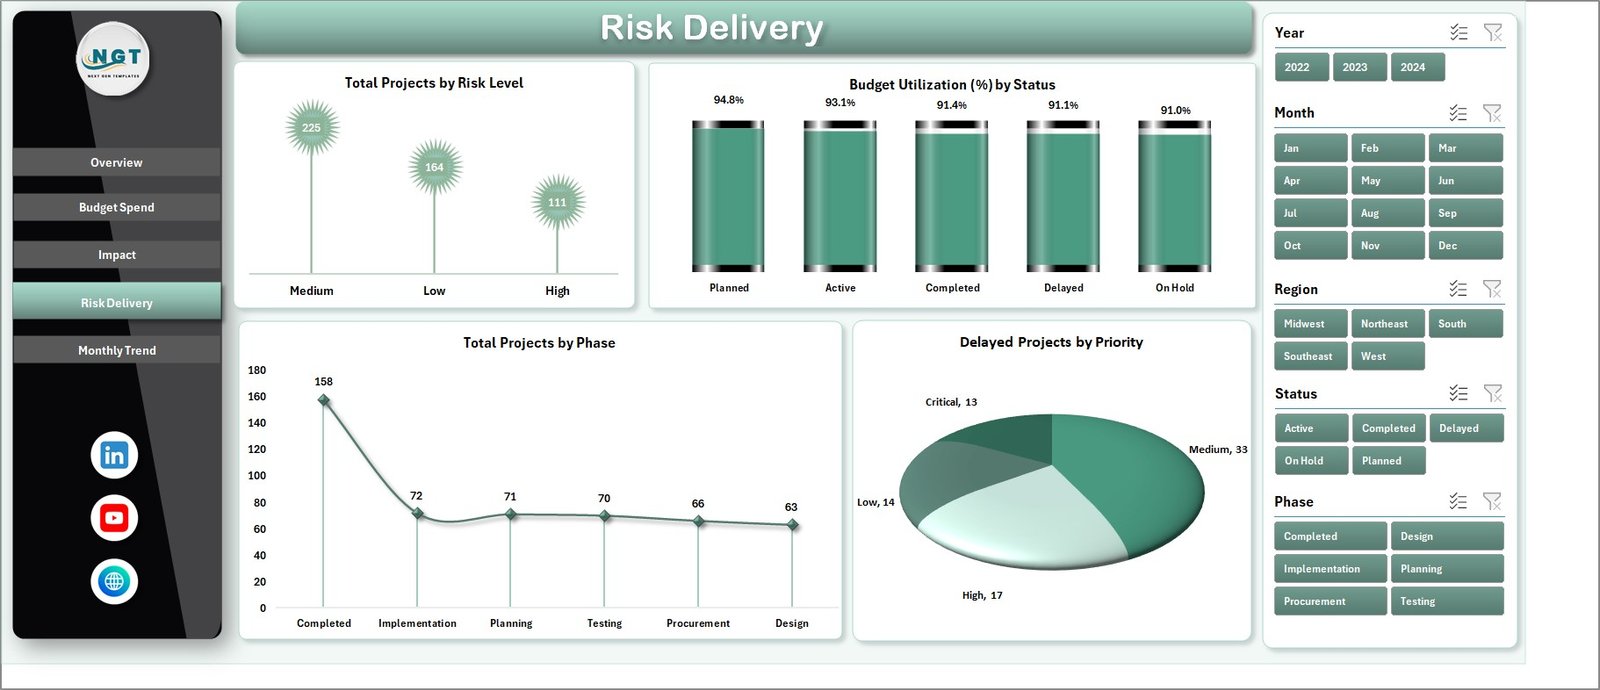
Project risks can delay city initiatives and increase costs. Therefore, cities must track project risks carefully.
The Risk Delivery Page provides insights into project risk levels and delivery performance.
Charts Included on This Page
Total Projects by Risk Level
This chart categorizes projects based on risk levels such as low, medium, or high risk.
Budget Utilization (%) by Status
This chart measures how efficiently projects utilize allocated budgets.
Total Projects by Phase
This chart tracks project progress through phases such as planning, implementation, and completion.
Delayed Projects by Priority
This chart identifies high-priority projects that experience delays.
By analyzing these insights, project managers can identify risks early and take corrective action.
5. Monthly Trends Page – Monitoring Project Progress Over Time

City development projects often span several months or years. Therefore, tracking monthly trends becomes essential.
The Monthly Trends Page allows administrators to analyze project performance across time.
Charts on This Page
Total Projects by Month
This chart shows how many projects start or progress each month.
Total Budget by Month
This chart tracks budget allocation over time.
Milestone Completion (%) by Month
This chart measures how effectively projects complete milestones each month.
These trend insights help decision-makers evaluate long-term project progress.
Advantages of Smart Cities Project Dashboard in Excel
Implementing this dashboard provides several benefits.
Centralized Project Monitoring
All smart city projects can be tracked in a single dashboard.
Improved Decision-Making
Visual analytics help leaders make faster and better decisions.
Financial Transparency
Budget analysis ensures responsible financial management.
Better Risk Management
Early detection of risks prevents project delays.
Sustainability Tracking
Cities can measure environmental benefits such as energy savings and CO₂ reduction.
Improved Accountability
Departments become responsible for project performance.
Click to Purchases Smart Cities Project Dashboard in Excel
Best Practices for Using the Smart Cities Project Dashboard
Organizations should follow best practices to maximize dashboard effectiveness.
Maintain Accurate Data
Always update the data source regularly to ensure accurate reporting.
Define Clear KPIs
Cities should define measurable indicators such as energy savings, citizen impact, and project completion rates.
Monitor Projects Regularly
Administrators should review dashboard insights frequently.
Train Users
Teams must understand how to interpret dashboard insights.
Align Projects with Strategic Goals
Smart city initiatives should align with long-term urban development plans.
How Does a Smart Cities Dashboard Improve Urban Governance?
A Smart Cities dashboard significantly improves governance and project management.
Improves Transparency
Citizens and government officials gain better visibility into development initiatives.
Enhances Strategic Planning
Decision-makers can plan future initiatives based on data insights.
Supports Sustainability Goals
Environmental metrics help cities track sustainability targets.
Optimizes Resource Allocation
Cities can allocate budgets and resources more effectively.
Conclusion
Smart cities rely heavily on data-driven decision-making. With multiple projects running simultaneously across departments, city administrators must monitor performance carefully.
The Smart Cities Project Dashboard in Excel provides a powerful solution for tracking urban development initiatives. Through interactive charts, KPI cards, and detailed analysis pages, the dashboard helps organizations monitor budgets, evaluate environmental impact, manage project risks, and measure citizen benefits.
Because the dashboard consolidates all project data into one visual platform, decision-makers gain valuable insights that support better planning and governance.
Therefore, organizations that implement this dashboard can significantly improve project transparency, operational efficiency, and sustainability outcomes.
Click to Purchases Smart Cities Project Dashboard in Excel
Frequently Asked Questions (FAQs)
What is a Smart Cities Project Dashboard?
A Smart Cities Project Dashboard is a tool that tracks urban development initiatives such as infrastructure projects, sustainability programs, and smart technology implementations.
Why do cities use project dashboards?
Cities use dashboards to monitor project progress, track budgets, evaluate risks, and measure environmental impact.
Can Excel handle large smart city datasets?
Yes. Excel can manage structured datasets and visualize them through charts, pivot tables, and dashboards.
What types of projects can be tracked in this dashboard?
Cities can track infrastructure, transportation, sustainability, IoT implementation, and digital governance projects.
Who should use this dashboard?
City administrators, urban planners, project managers, and government departments responsible for smart city initiatives can use this dashboard.
Can the dashboard be customized?
Yes. Organizations can customize metrics, charts, and filters according to project requirements.
Click to Purchases Smart Cities Project Dashboard in Excel
Visit our YouTube channel to learn step-by-step video tutorials