Startup Hubs KPI Dashboard — Introduction
The Startup Hubs KPI Dashboard is a ready-to-use template designed to track, visualize, and analyze the critical metrics that matter for startup support hubs. This dashboard helps program managers, analysts, and leadership quickly assess performance across Monthly-to-Date (MTD), Year-to-Date (YTD), and Previous Year (PY) comparisons with visual cues and trend analysis.
Click to Purchases Startup Hubs KPI Dashboard in Excel
Key Features of Startup Hubs KPI Dashboard
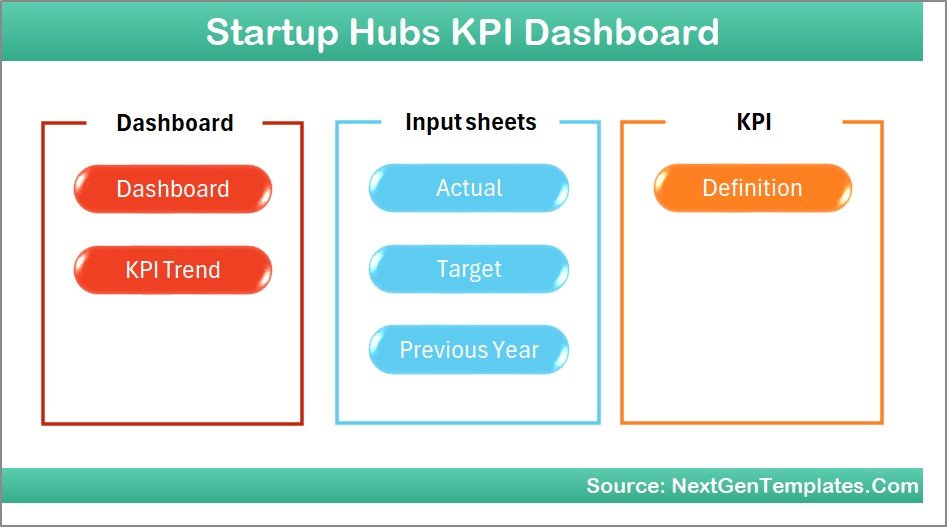
- Seven integrated worksheets covering home, dashboard, trends, inputs, targets, previous year data, and KPI definitions.
- Dynamic month selector to instantly update all MTD and YTD values.
- Conditional formatting with up/down arrows for quick visual interpretation of Target vs Actual and PY vs Actual.
- MTD and YTD comparisons shown side-by-side for rapid performance review.
- Trend charts for Actual, Target, and PY allowing deeper time-based insight.
- Simple input sheets for Actual, Target, and PY numbers—built for easy data entry and month shifts.
Dashboard Pages Explanation
This dashboard contains 7 worksheets. Below is a page-by-page explanation with visuals and captions.
1. Home Sheet
The Home sheet acts as the index for the workbook with navigation buttons linking to the six functional sheets. Use it as your starting point.
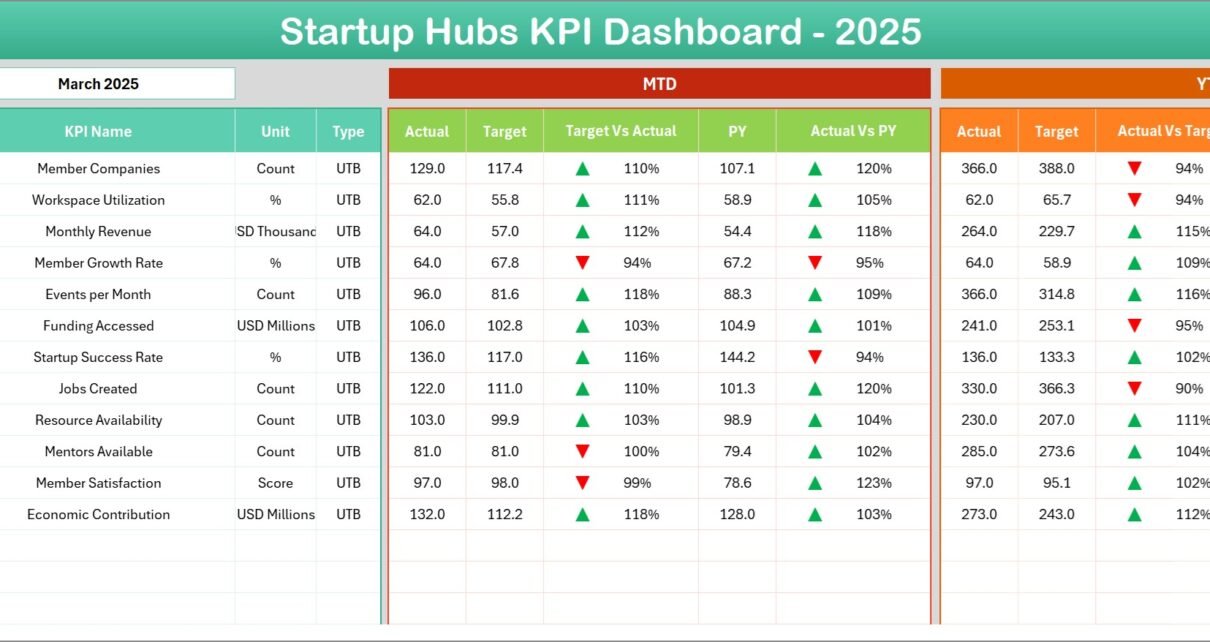
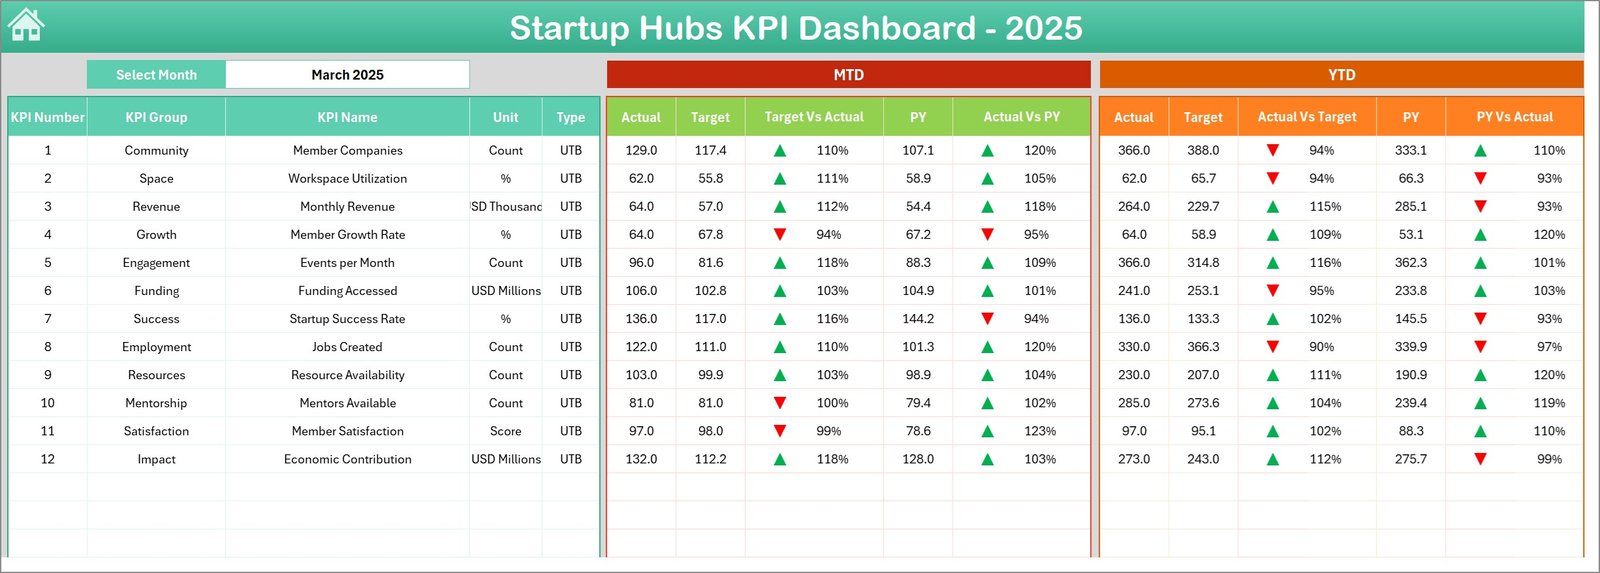
2. Dashboard Sheet
This is the main reporting sheet. Select the month from the drop-down at cell D3 to update the entire dashboard. It shows:
- MTD: Actual, Target, Previous Year values.
- YTD: Actual, Target, Previous Year values.
- Target vs Actual and PY vs Actual comparisons with conditional up/down arrows.
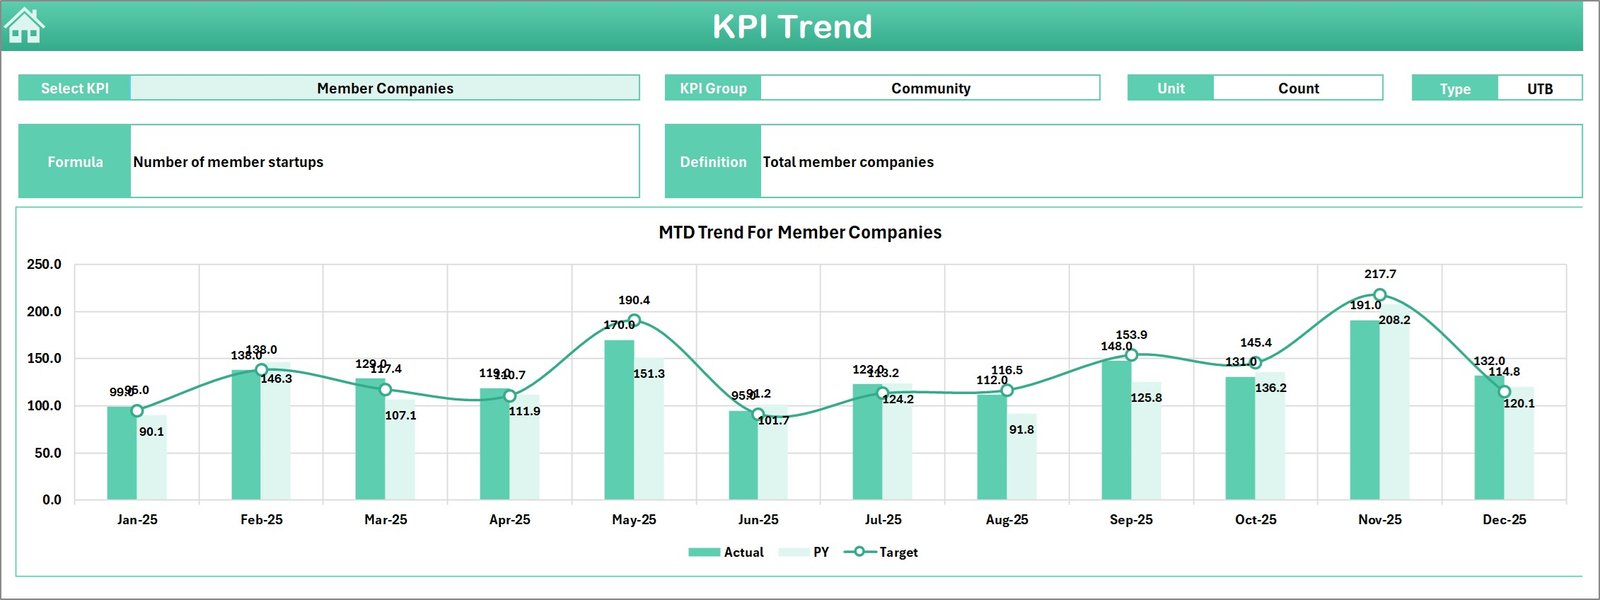
3. KPI Trend Sheet
Select a KPI from the drop-down at C3 to view the KPI Group, Unit, KPI Type (LTB or UTB), formula, and definition. The sheet displays MTD and YTD trend charts for Actual, Target, and PY to help identify patterns.
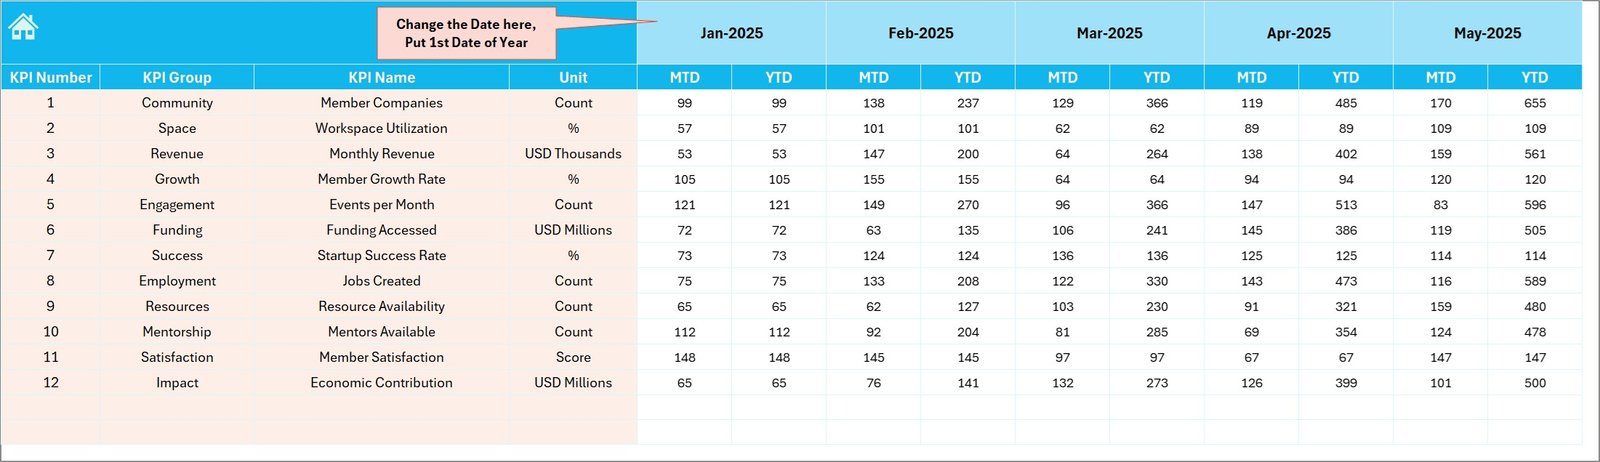
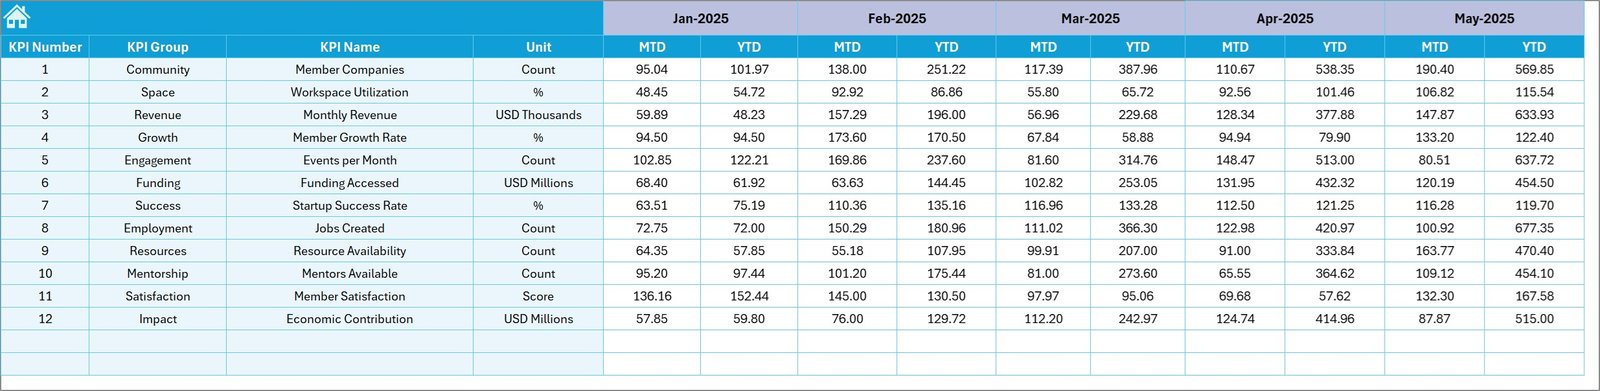
4. Actual Numbers Input Sheet
Enter the actual performance numbers here for both MTD and YTD. You can change the starting month of the year via cell E1—set the first month and the sheet will align the YTD calculations accordingly.
5. Target Number Input Sheet
Enter monthly Target numbers for each KPI as both MTD and YTD values. Targets drive the comparison metrics and the conditional formatting on the Dashboard sheet.
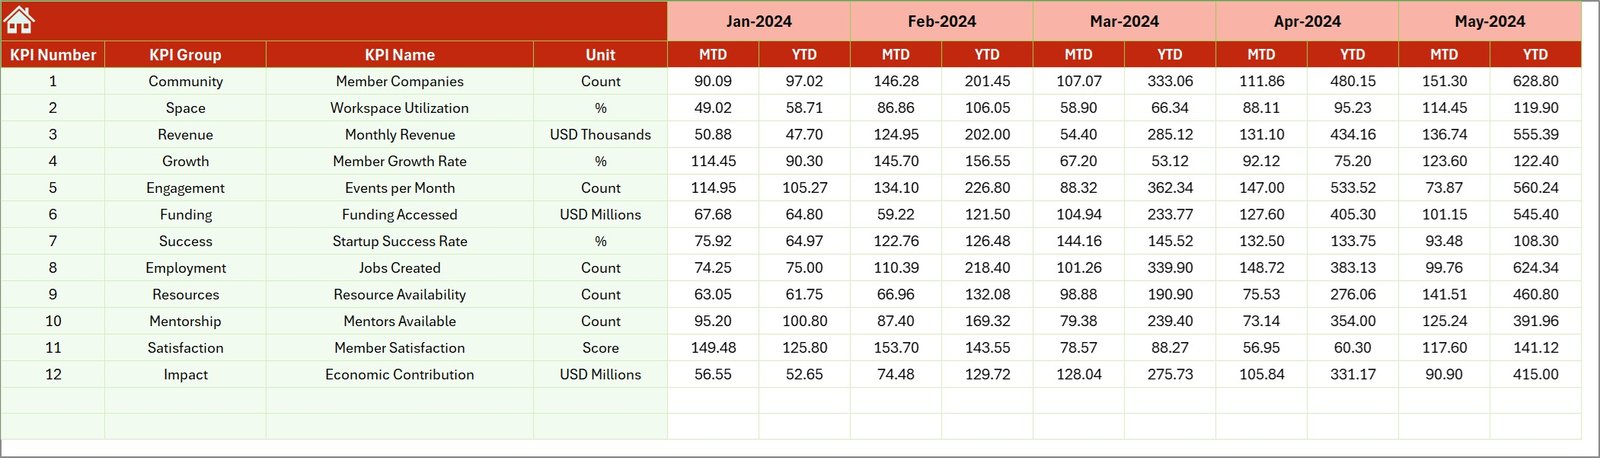
6. Previous Year Number Sheet
Populate the prior year numbers in the same format as current year inputs. These values power the PY vs Actual comparisons and trend analysis.
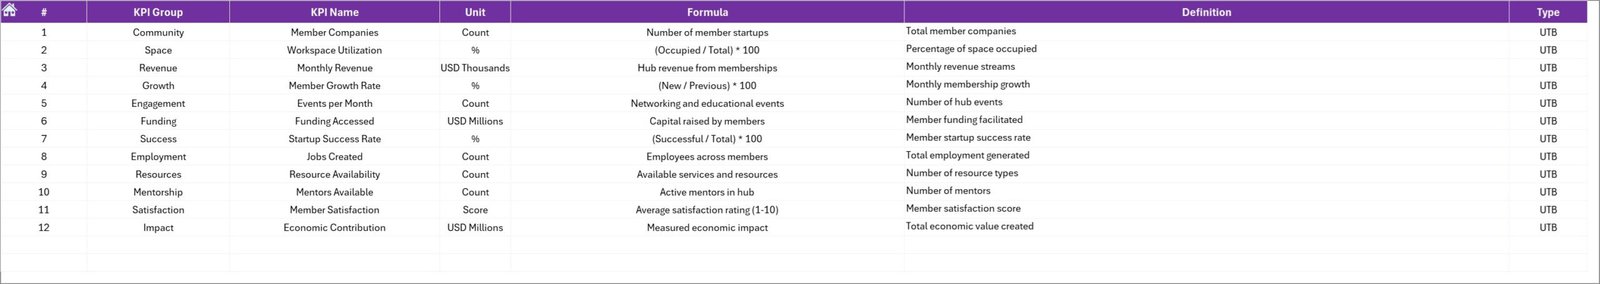
7. KPI Definition Sheet
Define each KPI including name, group, unit, formula, and narrative definition. In the final column specify KPI type as LTB (Lower The Better) or UTB (Upper The Better) so conditional formatting interprets directionality correctly.
Advantages of Startup Hubs KPI Dashboard
- Fast decision-making with clear MTD and YTD snapshots.
- Standardized data entry keeps numbers consistent and auditable.
- Visual cues reduce time spent interpreting results—colors and arrows highlight where to dig deeper.
- Scalable: add new KPIs or months with minimal setup work.
- Designed for Excel users—no advanced scripting required.
Opportunities for Improvement
- Automate data ingestion from CRM or program management tools to reduce manual input and errors.
- Integrate with Power BI for interactive online dashboards and role-level access.
- Add user-level permissions or a protected input area to prevent accidental changes to formulas or definitions.
- Include rolling 12-month charts to highlight seasonality more clearly.
Best Practices
- Keep a single source of truth: store raw data in the input sheets and avoid overwriting values directly in reports.
- Standardize units and KPI definitions to ensure consistent interpretation across teams.
- Set review cadences—weekly for operational KPIs, monthly for strategic KPIs.
- Use the KPI Definition sheet to document owners, calculation notes, and data sources.
- Back up the workbook before making structural changes like adding KPIs or months.
FAQs
How do I change the reporting month?
Use the month drop-down at cell D3 on the Dashboard sheet. All MTD and YTD numbers will update accordingly.
Can I add new KPIs?
Yes. Add the KPI row to the KPI Definition sheet and then populate targets, actuals, and PY values in the corresponding input sheets. Update any named ranges if required.
Is the dashboard compatible with Power BI?
Yes. Export the input sheets or connect directly to the workbook if you host it in OneDrive or SharePoint. For best results, move the model to Power BI Desktop and build visuals there.
Click to Purchases Startup Hubs KPI Dashboard in Excel
Conclusion
Startup Hubs KPI Dashboard provides a practical, Excel-based framework to monitor the performance of startup support programs. With distinct input sheets, clear definitions, and visual trends, it reduces noise and surfaces the metrics that matter most. Use the template as-is or extend it with automated connections and Power BI for enterprise-level reporting.
For best practices and tutorials on dashboards and analytics, visit Microsoft Power BI documentation: https://learn.microsoft.com/en-us/power-bi/.
Visit our YouTube channel to watch the demo: Youtube.com/@NextGenTemplates