Paediatrics Clinics KPI Dashboard — Introduction
Paediatrics Clinics KPI Dashboard is a ready-to-use template designed to help clinics track performance, compare against targets, and analyze trends month-to-date (MTD) and year-to-date (YTD). Below you will find a clear breakdown of the dashboard pages, features, best practices, and step-by-step usage guidance.
Click to Purchases Paediatrics Clinics KPI Dashboard in Excel
Key Features of Paediatrics Clinics KPI Dashboard
- Seven worksheet tabs covering Home, Dashboard, KPI Trends, Actual Input, Target Input, Previous Year Input, and KPI Definitions.
- Interactive month selector to switch MTD and YTD numbers across the dashboard.
- Conditional formatting with up/down arrows for Target vs Actual and PY vs Actual comparisons.
- MTD and YTD Actual, Target, and Previous Year values shown side-by-side for fast insight.
- KPI trend charts that plot Actual, Target, and PY for MTD and YTD periods.
- Input sheets structured for quick data entry of monthly and cumulative values.
- Clear KPI definitions with unit, formula, group, and whether lower-the-better (LTB) or upper-the-better (UTB).
Dashboard Pages Explanation
1. Home Sheet — Paediatrics Clinics KPI Dashboard
The Home sheet acts as an index with navigation buttons for each worksheet. Use this page to quickly jump to the desired area of the file.
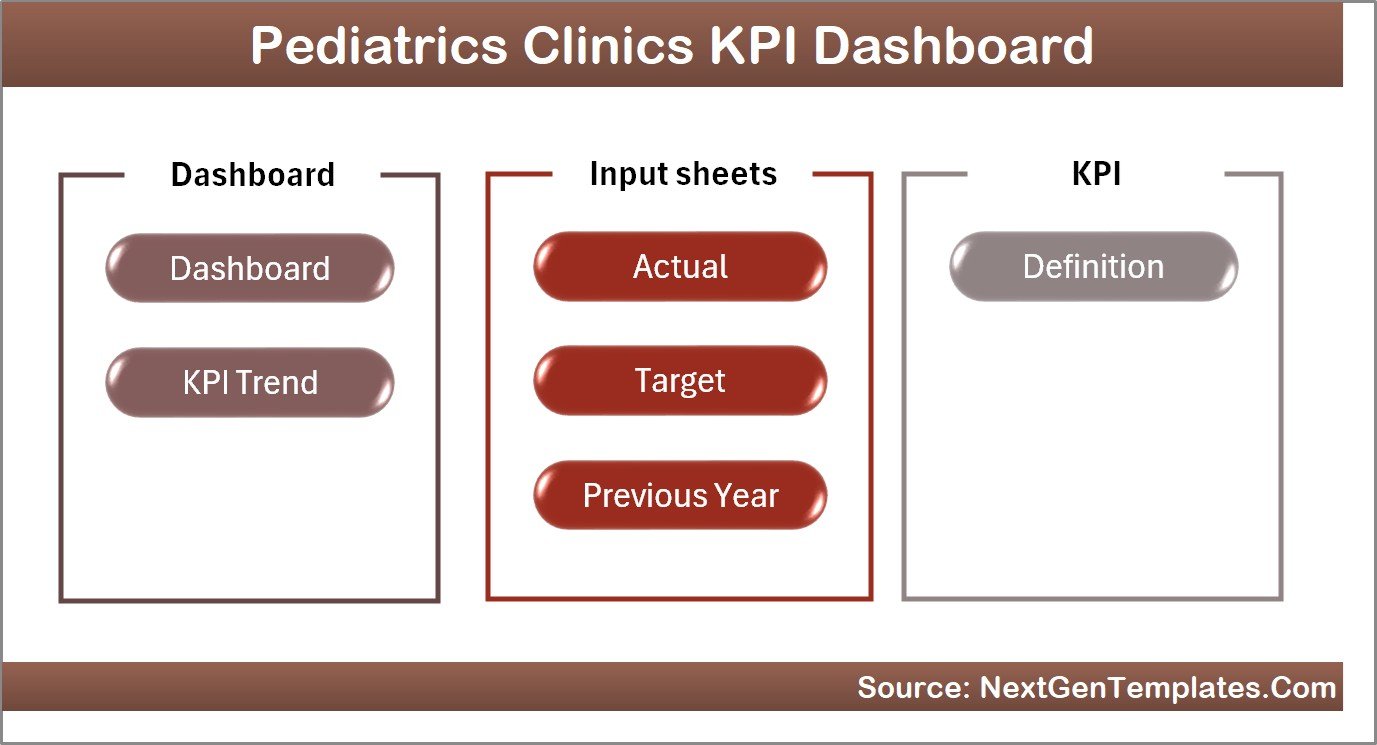
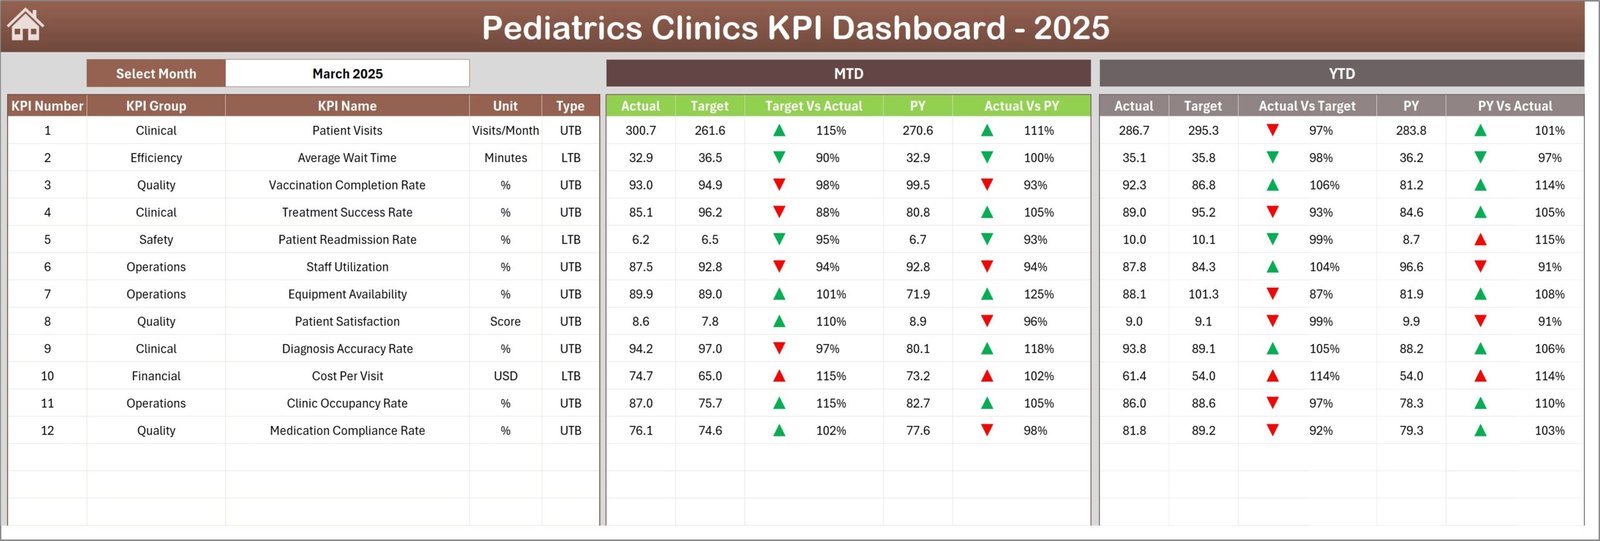
2. Dashboard Sheet Tab — Paediatrics Clinics KPI Dashboard
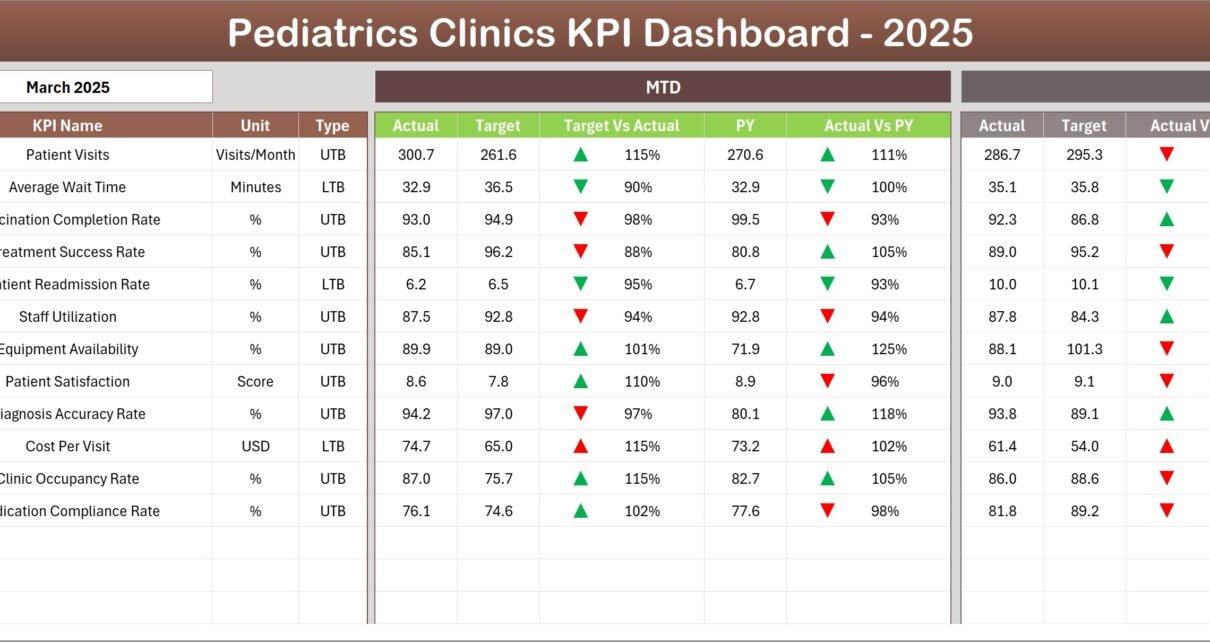
The main overview sheet presents all KPI information for the selected month (selectable in cell D3). It includes:
- MTD: Actual, Target, Previous Year (PY) with Target vs Actual and PY vs Actual indicators.
- YTD: Actual, Target, Previous Year with the same comparative indicators and conditional formatting arrows.
- Quick glance cards and tables to identify top performing and underperforming KPIs.
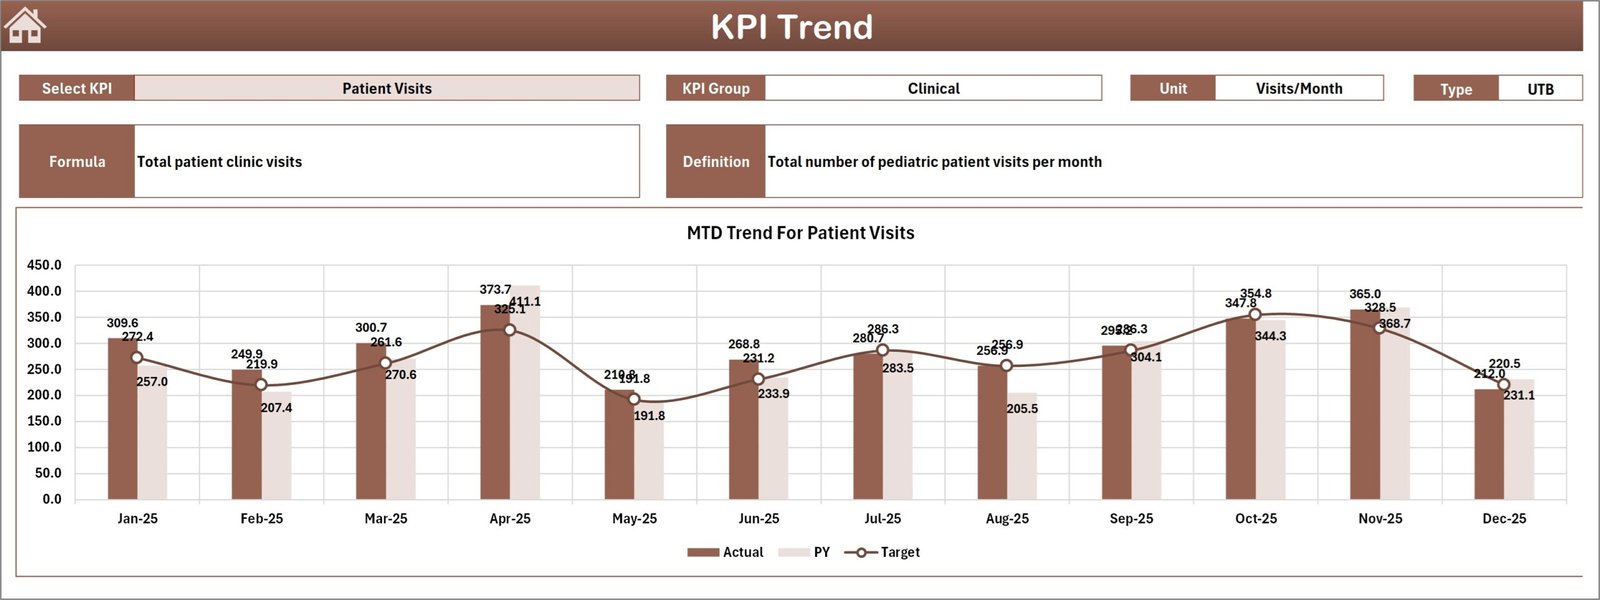
3. KPI Trend Sheet — Paediatrics Clinics KPI Dashboard
Select a KPI from the dropdown in cell C3 to view details. This sheet shows:
- KPI Group, Unit, Type (LTB or UTB), formula, and a short definition.
- MTD and YTD trend charts comparing Actual, Target, and PY.
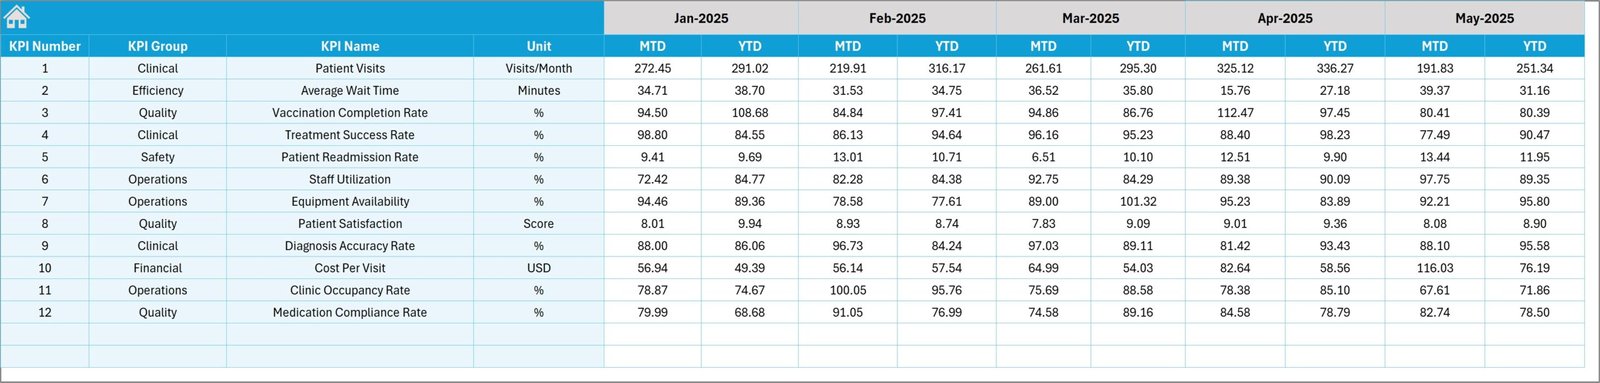
4. Actual Numbers Input Sheet — Paediatrics Clinics KPI Dashboard
Enter the clinic’s actuals here for both MTD and cumulative YTD. Set the first month of the year in cell E1 to align cumulative calculations.

5. Target Number Input Sheet — Paediatrics Clinics KPI Dashboard
Populate monthly Target (MTD) and cumulative Target (YTD) values for each KPI to enable automated target comparisons on the Dashboard.
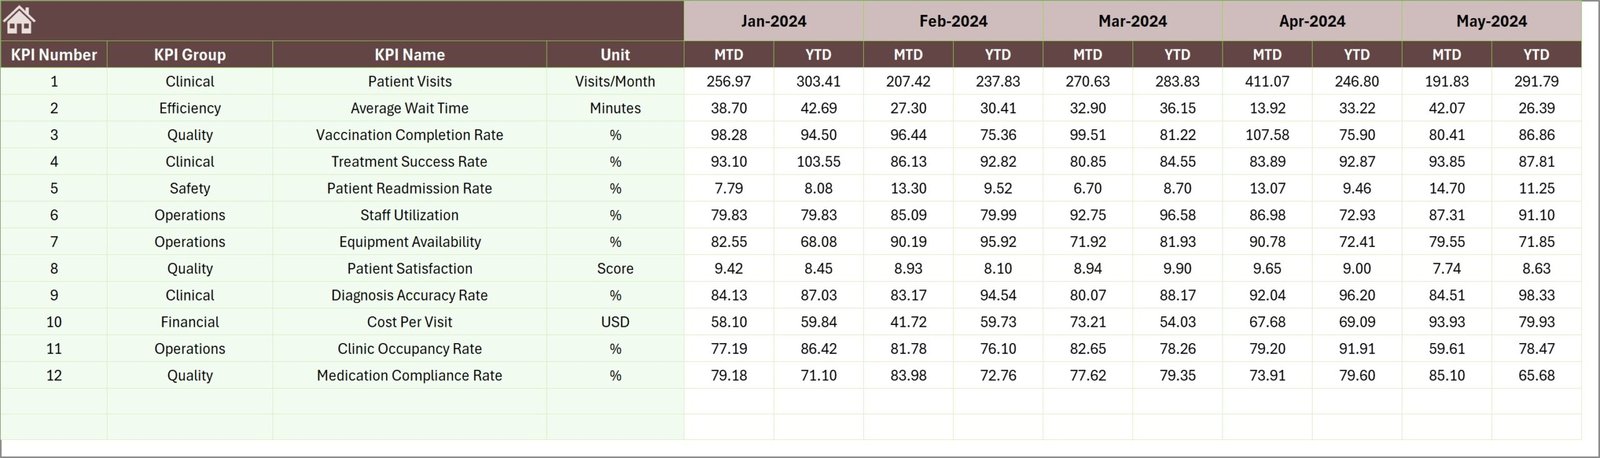
6. Previous Year Number Input Sheet — Paediatrics Clinics KPI Dashboard
Enter the previous year’s monthly and cumulative values here so the dashboard can show year-over-year comparisons for context.
7. KPI Definition Sheet — Paediatrics Clinics KPI Dashboard
Define each KPI with its name, group, measurement unit, calculation formula, definition, and whether it is LTB (Lower The Better) or UTB (Upper The Better). This drives labels, units and chart behavior in the dashboard.

How to Use This Paediatrics Clinics KPI Dashboard
- Open the file and set the fiscal starting month in the Actual Numbers Input sheet (cell E1).
- Populate the Actual, Target and Previous Year sheets with monthly data.
- Use the Dashboard D3 month dropdown to view MTD and YTD results for any month.
- Visit the KPI Trend sheet to deep-dive into a single KPI’s performance and trends.
- Adjust KPI Definitions if you add or remove metrics; ensure UTB/LTB is correct so conditional formatting works.
Advantages of Paediatrics Clinics KPI Dashboard
- Fast insights: side-by-side MTD/YTD and YOY comparisons accelerate decision-making.
- Standardized KPI definitions reduce ambiguity across teams.
- Interactive selection for months and KPIs lets managers focus on specific areas quickly.
- Simple input sheets make monthly updates straightforward and repeatable.
Opportunities for Improvement
- Integrate with EHR or practice management systems to auto-refresh actuals.
- Add role-based dashboards (e.g., clinician view, admin view) with filters for departments.
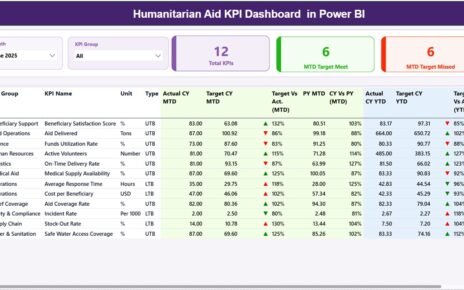
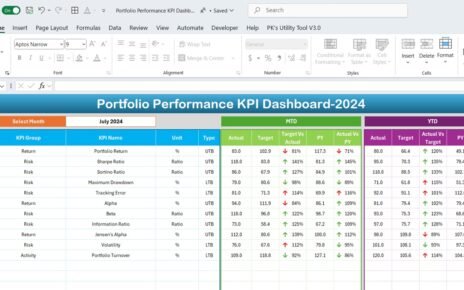
- Enhance visuals with live Power BI or Tableau versions for real-time interactivity.
- Include targets by service type or patient cohort for more granular analysis.
Best Practices
- Keep the KPI Definition sheet up to date and document any formula changes.
- Assign a data owner responsible for monthly uploads to maintain data quality.
- Validate totals on input sheets against source systems before finalizing the month.
- Use consistent units and rounding rules to avoid misleading comparisons.
FAQs
- Q: Can I add new KPIs?
A: Yes — add rows in the KPI Definition, Actual, Target and PY sheets, then refresh any dropdown ranges used to populate KPI selectors. - Q: Does this template support multiple clinics?
A: The current file is set up for a single clinic. To support multiple clinics, add a clinic column to input sheets and adjust lookup formulas or create separate dashboards per clinic. - Q: How do conditional arrows work?
A: Arrows are applied via conditional formatting rules that compare Actual vs Target and Actual vs PY; ensure KPI type (LTB/UTB) is correct for the expected direction.
Conclusion
This Paediatrics Clinics KPI Dashboard template provides a practical, structured way to track clinic performance and communicate results effectively. With clear input sheets, automated comparisons, and trend visualizations, you can focus on improving clinical operations and patient outcomes.
Click to Purchases Paediatrics Clinics KPI Dashboard in Excel
Suggested permalink (use in your site): /paediatrics-clinics-kpi-dashboard
External resources for further improvement and integration:
- Microsoft Power BI documentation — for dashboards with live data and enhanced interactivity.
- Microsoft Excel support — for formula help, tables, and conditional formatting guidance.
Visit our YouTube channel to watch the demo: Youtube.com/@NextGenTemplates