Managing a paediatrics clinic requires precision, care, and timely decision-making. Clinics deal with sensitive patient data, treatment outcomes, appointment schedules, and operational efficiency daily. However, many clinics still rely on manual reports or scattered Excel sheets. As a result, they often miss critical insights.
Therefore, healthcare providers now shift toward data-driven dashboards. One of the most effective solutions is the Paediatrics Clinics KPI Dashboard in Power BI.
In this comprehensive guide, you will learn everything about this dashboard. You will understand its features, benefits, structure, and best practices. Moreover, this article will help you use the dashboard effectively to improve clinic performance.
Click to Purchases Paediatrics Clinics KPI Dashboard in Power BI
What is a Paediatrics Clinics KPI Dashboard in Power BI?
A Paediatrics Clinics KPI Dashboard in Power BI is an interactive reporting tool designed to monitor key performance indicators in paediatric healthcare settings.
It collects data from Excel or other systems and converts it into visual insights. As a result, clinic managers can track performance, identify trends, and make faster decisions.
With this dashboard, you can:
-
Monitor patient care quality
-
Track clinic performance
-
Compare targets vs actual results
-
Analyze trends over time
-
Improve operational efficiency
Because Power BI provides real-time analytics, decision-makers can act quickly and confidently.
Why Do Paediatrics Clinics Need a KPI Dashboard?
Paediatrics clinics face unique challenges. They must ensure high-quality care while managing patient flow and resources.
However, without proper tools:
-
Data becomes difficult to manage
-
Reports take too much time
-
Errors increase in manual tracking
-
Insights remain hidden
Therefore, a KPI dashboard becomes essential.
Key Reasons to Use This Dashboard
-
It centralizes all clinic data
-
It improves visibility across KPIs
-
It helps track performance instantly
-
It supports better decision-making
-
It reduces manual work
As a result, clinics can focus more on patient care instead of data management.
Key Features of the Paediatrics Clinics KPI Dashboard in Power BI
This dashboard comes with a structured design and powerful features. It includes 3 main pages that provide complete insights.
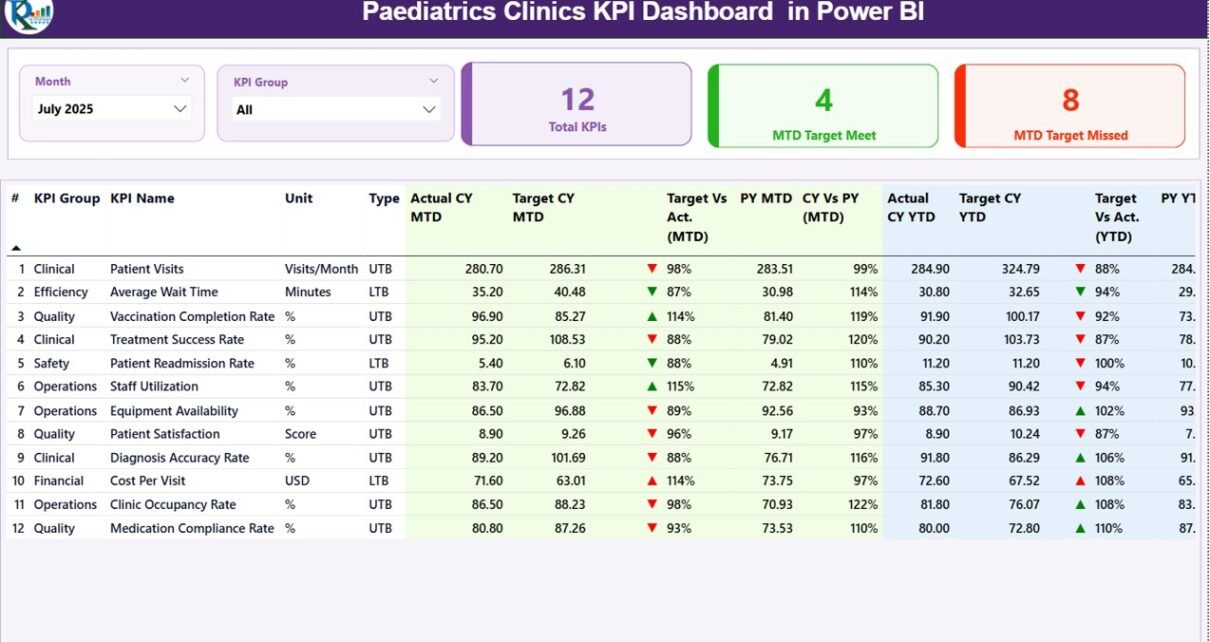
1. Summary Page – Central Overview of KPIs
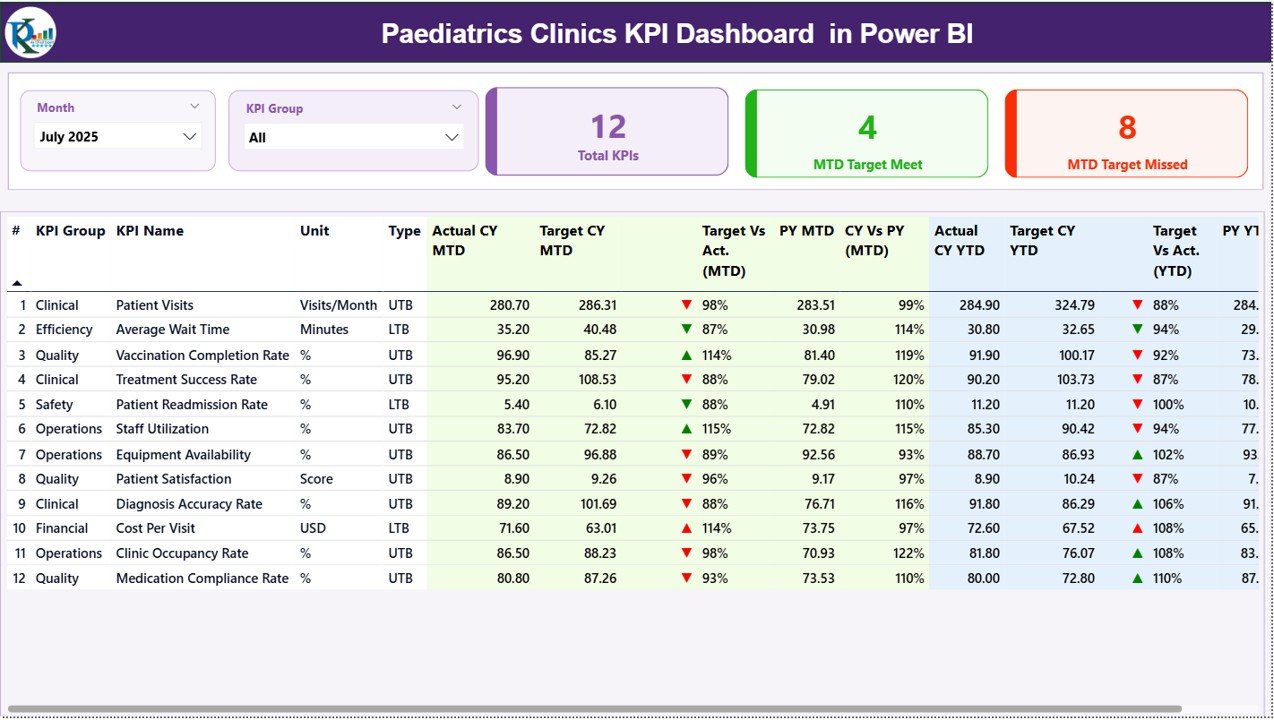
The Summary Page works as the main dashboard. It provides a complete overview of all KPIs in one place.
Key Elements:
-
📅 Month Slicer – Select the month to update all data instantly
-
📊 KPI Group Slicer – Filter KPIs based on categories
-
📌 KPI Cards:
-
Total KPIs Count
-
MTD Target Met Count
-
MTD Target Missed Count
-
Detailed KPI Table Includes:
-
KPI Number
-
KPI Group
-
KPI Name
-
Unit of Measurement
-
KPI Type (LTB or UTB)
Performance Metrics:
-
✅ Actual CY MTD vs Target CY MTD
-
🔺 MTD Status Icons (▲/▼) for quick performance view
-
📉 Target vs Actual % (MTD)
-
🔁 Current Year vs Previous Year (MTD)
YTD Analysis:
-
Actual CY YTD
-
Target CY YTD
-
YTD Status Icons
-
Target vs Actual % (YTD)
-
Current Year vs Previous Year (YTD)
Because of this structured view, users can quickly identify which KPIs perform well and which need attention.
2. KPI Trend Page – Performance Over Time
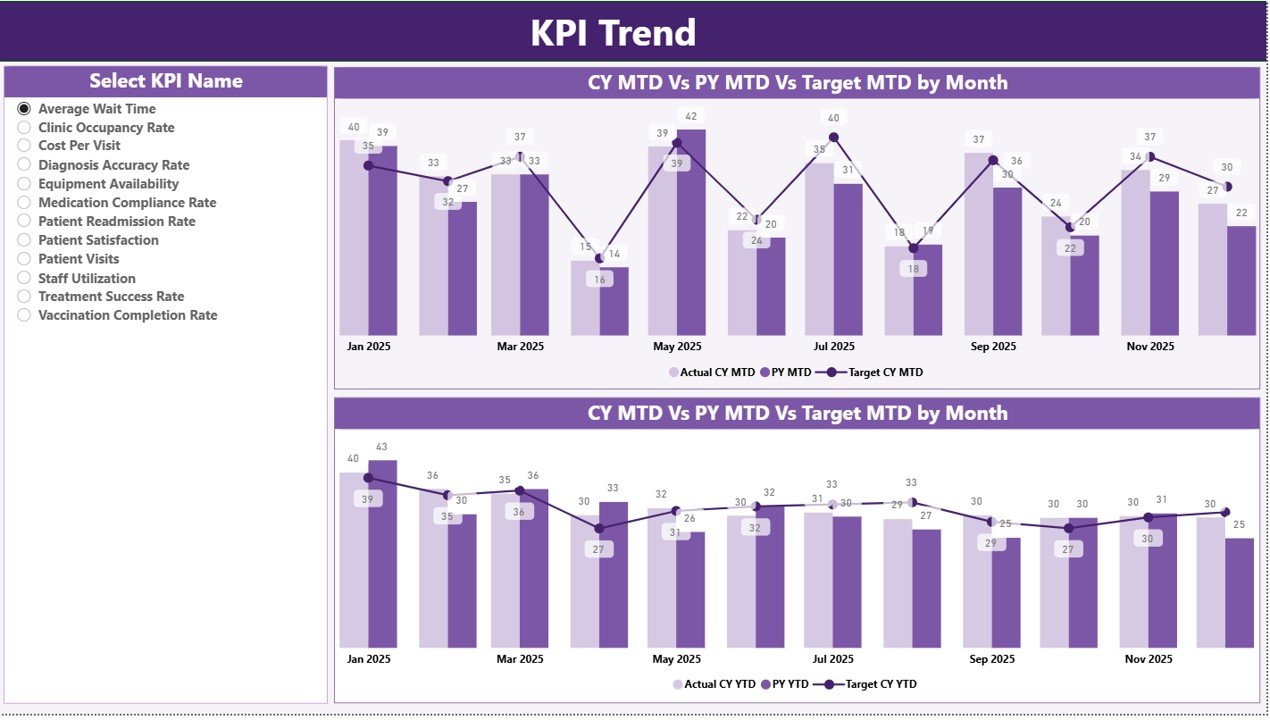
The KPI Trend Page helps users analyze trends and patterns.
Key Features:
-
📈 Combo Charts for MTD and YTD
-
Comparison between:
-
Current Year Actual
-
Previous Year Actual
-
Target Values
-
-
🎯 KPI Selection Slicer – Choose any KPI to view trends
Because of these visual charts, users can easily track progress over time and identify performance patterns.
3. KPI Definition Page – Detailed KPI Insights
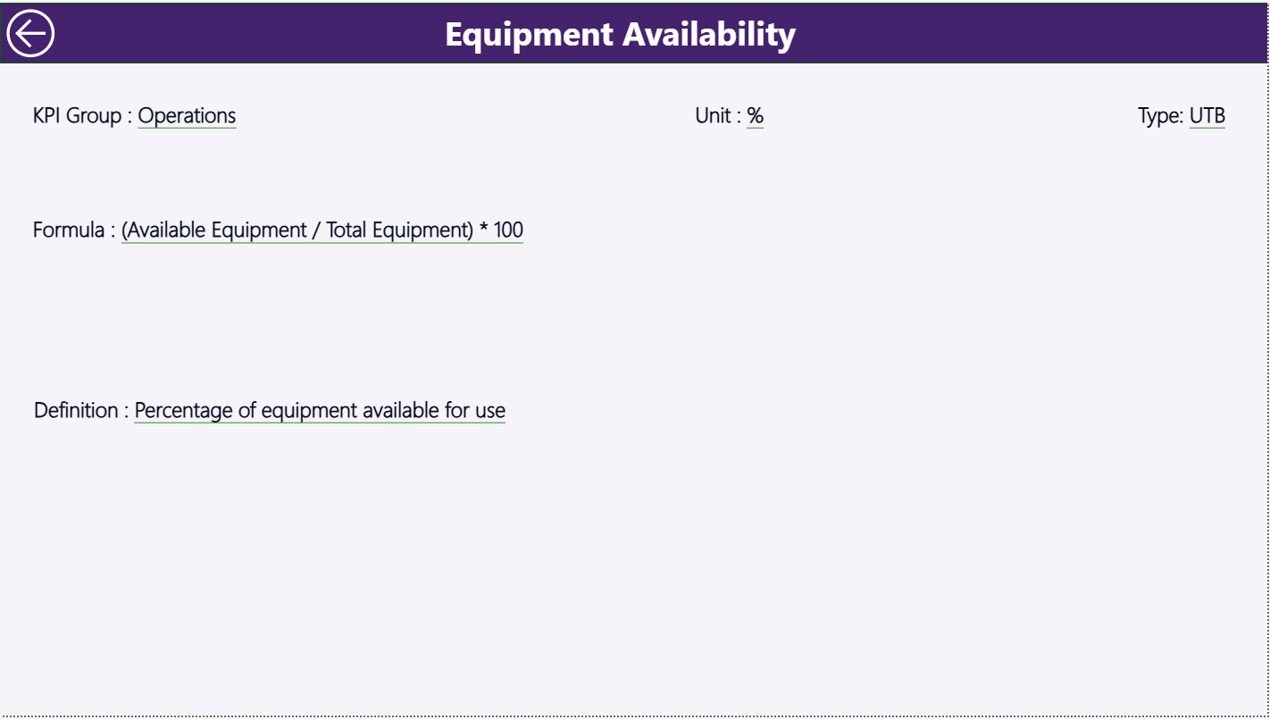
The KPI Definition Page is a hidden drill-through page.
What You Can See:
-
KPI Formula
-
KPI Definition
-
KPI Type (LTB or UTB)
-
Business logic behind each KPI
This page ensures complete transparency. Therefore, users understand exactly how each KPI works.
Excel Data Structure Used in the Dashboard
This dashboard uses Excel as the data source. You need to maintain three sheets.
1. Input_Actual Sheet
Here, you enter actual performance data.
Required Fields:
-
KPI Name
-
Month (first date of month)
-
MTD Value
-
YTD Value
2. Input_Target Sheet
This sheet stores target values.
Required Fields:
-
KPI Name
-
Month
-
Target MTD
-
Target YTD
3. KPI Definition Sheet
This sheet defines each KPI.
Required Fields:
-
KPI Number
-
KPI Group
-
KPI Name
-
Unit
-
Formula
-
Definition
-
Type (LTB or UTB)
Because of this structured data model, the dashboard remains dynamic and scalable.
How Does This Dashboard Improve Clinic Performance?
This dashboard offers multiple performance benefits.
Key Improvements:
-
Better monitoring of patient care
-
Faster identification of issues
-
Improved resource allocation
-
Accurate performance tracking
-
Enhanced decision-making
As a result, clinics operate more efficiently and deliver better patient outcomes.
Advantages of Paediatrics Clinics KPI Dashboard in Power BI
Using this dashboard provides several benefits.
🚀 Improved Data Visibility
-
All KPIs appear in one place
-
Users can analyze data quickly
-
No need to open multiple files
📊 Real-Time Insights
-
Data updates instantly
-
Managers can take quick actions
-
Trends become easy to identify
⏱ Time Saving
-
Reduces manual reporting
-
Automates calculations
-
Saves hours of work
🎯 Better Decision Making
-
Data-driven decisions become easier
-
Performance gaps become visible
-
Managers act based on facts
🔍 Enhanced Accuracy
-
Reduces human errors
-
Ensures consistent calculations
-
Improves data reliability
Best Practices for the Paediatrics Clinics KPI Dashboard in Power BI
To get the best results, you must follow certain best practices.
✅ Maintain Clean Data
-
Always use structured Excel data
-
Avoid missing values
-
Ensure consistent formats
📅 Update Data Regularly
-
Update MTD and YTD data monthly
-
Keep targets aligned with goals
🎯 Define Clear KPIs
-
Use meaningful KPIs
-
Align KPIs with clinic objectives
-
Avoid unnecessary metrics
📊 Use Filters Effectively
-
Use slicers to focus on specific KPIs
-
Analyze data by group and time
🔄 Monitor Trends Consistently
-
Check KPI trends regularly
-
Identify patterns early
🧠 Train Your Team
-
Ensure staff understands the dashboard
-
Provide training on KPI interpretation
Common KPIs for Paediatrics Clinics
To make the dashboard effective, clinics should track relevant KPIs.
Example KPIs:
-
Patient Visit Count
-
Average Waiting Time
-
Treatment Success Rate
-
Patient Satisfaction Score
-
Appointment Cancellation Rate
-
Vaccination Coverage Rate
-
Readmission Rate
Because these KPIs focus on patient care, they help clinics improve service quality.
How to Use the Dashboard Effectively?
Using the dashboard correctly ensures maximum benefits.
Step-by-Step Approach:
-
Update Excel data regularly
-
Refresh Power BI dashboard
-
Select month and KPI group
-
Analyze KPI performance
-
Check trend charts
-
Drill through for details
-
Take action based on insights
By following these steps, clinics can improve both efficiency and patient care.
Challenges Without a KPI Dashboard
Without a dashboard, clinics face many issues.
Common Problems:
-
Delayed decision-making
-
Inaccurate reports
-
Data scattered across systems
-
Lack of performance visibility
Therefore, adopting a KPI dashboard becomes essential.
Future Scope of KPI Dashboards in Healthcare
Healthcare analytics continues to grow rapidly.
Future Trends:
-
Integration with AI tools
-
Real-time patient monitoring
-
Predictive analytics
-
Cloud-based dashboards
As technology advances, dashboards will become even more powerful.
Conclusion
The Paediatrics Clinics KPI Dashboard in Power BI transforms how clinics manage data and performance. It provides a centralized, interactive, and efficient way to track key metrics.
Because it combines data visualization with real-time insights, it helps clinics improve patient care, optimize operations, and make better decisions.
If you want to modernize your clinic operations, this dashboard offers a powerful and practical solution.
Click to Purchases Paediatrics Clinics KPI Dashboard in Power BI
Frequently Asked Questions (FAQs)
1. What is a KPI dashboard in healthcare?
A KPI dashboard is a tool that tracks key performance indicators. It helps healthcare providers monitor performance and improve patient care.
2. Why should paediatrics clinics use Power BI?
Power BI offers interactive visuals, real-time insights, and easy data integration. Therefore, it helps clinics analyze performance effectively.
3. What data is required for this dashboard?
You need:
-
Actual KPI data
-
Target KPI data
-
KPI definitions
All data should be maintained in Excel.
4. What is the difference between MTD and YTD?
-
MTD (Month-to-Date) shows performance for the current month
-
YTD (Year-to-Date) shows performance for the entire year
5. What does LTB and UTB mean?
-
LTB (Lower the Better) – Lower values indicate better performance
-
UTB (Upper the Better) – Higher values indicate better performance
6. Can this dashboard be customized?
Yes, you can customize:
-
KPIs
-
Charts
-
Filters
-
Data sources
7. How often should the dashboard be updated?
You should update it monthly. However, you can also update it weekly or daily based on your needs.
8. Is Power BI difficult to use?
No, Power BI is user-friendly. With basic training, anyone can use it effectively.
Click to Purchases Paediatrics Clinics KPI Dashboard in Power BI
Visit our YouTube channel to learn step-by-step video tutorials