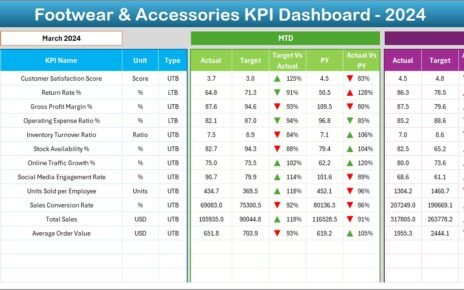
In today’s fast-moving tech world, startups grow rapidly. However, managing data across funding, revenue, employees, and churn becomes difficult. Many startup founders and analysts struggle to track everything in one place.
Because of that, businesses now prefer smart dashboards that turn complex data into simple insights. That’s exactly where the Avatar Tech Startups Dashboard in Power BI becomes a game-changer.
In this detailed guide, you will learn everything about this powerful dashboard. Moreover, you will understand its structure, features, advantages, best practices, and how it helps you make better business decisions.
Click to Purchases Avatar Tech Startups Dashboard in Power BI
📊 What is an Avatar Tech Startups Dashboard in Power BI?
An Avatar Tech Startups Dashboard in Power BI is an interactive reporting solution designed to track and analyze startup performance.
It combines multiple data points such as:
-
Revenue growth
-
Funding rounds
-
Employee distribution
-
Churn rate
-
Industry performance
-
Regional insights
Instead of using multiple spreadsheets, you can monitor everything in one centralized dashboard. As a result, you gain better visibility and control over your startup ecosystem.
🤔 Why Do Tech Startups Need a Dashboard?
Startups generate a huge amount of data daily. However, without proper visualization, that data becomes useless.
Therefore, a Power BI dashboard helps you:
-
Understand performance instantly
-
Track growth trends
-
Identify risks early
-
Make faster decisions
Moreover, it eliminates manual reporting and saves valuable time.
🧩 Key Features of Avatar Tech Startups Dashboard in Power BI
This dashboard includes 5 powerful and interactive pages. Each page focuses on a specific area of analysis.
📌 1. Overview Page – Get a Complete Snapshot
The Overview Page works as the central hub of the dashboard.
🔹 Key Highlights:
-
Interactive slicers for filtering data
-
5 KPI cards for quick insights
📊 KPI Cards Include:
-
Revenue by Region
-
Churn Rate %
-
Employee Count by Status
-
Total Funding by Industry Sector
🎯 Why It Matters:
Because this page gives a quick summary, you can instantly understand the overall performance without diving into details.
Click to Purchases Avatar Tech Startups Dashboard in Power BI
💰 2. Funding Round Analysis – Track Investment Trends
This page focuses on how startups raise capital across different funding stages.
📊 Key Charts:
-
Revenue by Funding Round
-
Employee Count by Funding Round
-
Total Funding by Funding Round
🔍 Insights You Can Get:
-
Which funding stage generates the most revenue
-
How employee growth aligns with funding
-
Which rounds attract the highest investments
💡 Why It Matters:
Funding plays a crucial role in startup growth. Therefore, this page helps you analyze investment efficiency.
🌍 3. Region Analysis – Understand Geographic Performance
The Region Analysis Page shows how startups perform across different locations.
📊 Key Charts:
-
Churn Rate % by Region
-
Employee Count by Region
-
Total Funding by Region
🔍 Key Benefits:
-
Identify high-performing regions
-
Detect regions with high churn
-
Compare funding distribution globally
🚀 Why It Matters:
Because location impacts growth, this page helps businesses expand strategically.
🏭 4. Industry Sector Analysis – Compare Startup Segments
Different industries perform differently. Therefore, this page helps you compare them.
📊 Key Charts:
-
Churn Rate % by Industry Sector
-
Employee Count by Industry Sector
-
Revenue by Industry Sector
🔍 Insights:
-
Which industry generates the most revenue
-
Which sector has higher employee strength
-
Which industries face higher churn
-
Click to Purchases Avatar Tech Startups Dashboard in Power BI
🎯 Why It Matters:
As a result, investors and founders can focus on high-growth sectors.
📅 5. Month Analysis – Track Trends Over Time
This page focuses on time-based performance.
📊 Key Charts:
-
Revenue by Month
-
Valuation by Month
-
Total Funding by Month
🔍 Insights:
-
Monthly growth trends
-
Seasonal performance changes
-
Funding and valuation patterns
📈 Why It Matters:
Because trends matter, this page helps you predict future performance.
⚙️ How Does This Dashboard Work?
The dashboard works using Power BI’s interactive features.
🔧 Core Components:
-
Data Model (Excel or database source)
-
DAX Measures for calculations
-
Visual Charts for insights
-
Slicers for filtering
🔄 Workflow:
-
Upload data
-
Clean and transform data
-
Build relationships
-
Create visuals
-
Apply filters and slicers
As a result, users can interact with data in real time.
🌟 Advantages of Avatar Tech Startups Dashboard in Power BI
Using this dashboard provides several benefits.
🚀 Key Advantages:
-
📊 Centralized Data View
You can track all startup metrics in one place. -
⚡ Real-Time Insights
You get instant updates and faster decisions. -
📉 Better Risk Management
You can detect churn and performance issues early. -
📈 Improved Growth Tracking
You can monitor revenue, funding, and valuation trends. -
🌍 Global Performance Analysis
You can compare regions and markets easily. -
🧠 Data-Driven Decisions
You can rely on insights instead of assumptions.
🔧 Opportunities for Improvement
Even though the dashboard is powerful, you can enhance it further.
💡 Possible Improvements:
-
Add AI-based forecasting
-
Include customer acquisition metrics
-
Integrate live data sources
-
Add drill-through pages
-
Use advanced DAX measures
As a result, you can make the dashboard even more intelligent.
🛠️ Best Practices for the Avatar Tech Startups Dashboard
To get the best results, you should follow these best practices.
✅ Best Practices:
-
📊 Use Clean and Structured Data
Always maintain data consistency. -
🔄 Update Data Regularly
Keep your dashboard up to date. -
🎯 Focus on Key KPIs
Avoid adding unnecessary visuals. -
📌 Use Meaningful Visuals
Choose charts that clearly explain data. -
⚡ Optimize Performance
Reduce heavy calculations and unused fields. -
🔍 Enable Drill-Down Features
Allow deeper analysis when needed. -
🎨 Maintain Consistent Design
Use uniform colors and layouts.
👥 Who Can Use This Dashboard?
Click to Purchases Avatar Tech Startups Dashboard in Power BI
This dashboard suits multiple users.
👨💼 Ideal Users:
-
Startup founders
-
Venture capitalists
-
Business analysts
-
Finance teams
-
Data analysts
-
Investors
Because it provides detailed insights, anyone involved in startup growth can benefit.
📈 How This Dashboard Improves Decision-Making?
Decision-making becomes easier when you have clear insights.
🎯 Key Improvements:
-
You can identify profitable sectors quickly
-
You can track employee growth effectively
-
You can optimize funding strategies
-
You can reduce churn rates
-
You can forecast future growth
As a result, your business becomes more efficient and data-driven.
🔮 Future Scope of Startup Dashboards
Technology continues to evolve. Therefore, dashboards will become more advanced.
🚀 Future Trends:
-
AI-powered insights
-
Predictive analytics
-
Real-time data streaming
-
Integration with SaaS tools
-
Automated reporting
Because of these advancements, dashboards will play a bigger role in business success.
🏁 Conclusion
The Avatar Tech Startups Dashboard in Power BI is a powerful solution for tracking startup performance. It simplifies complex data and turns it into meaningful insights.
Moreover, it helps businesses monitor funding, revenue, employees, and churn in one place. As a result, you can make faster and smarter decisions.
If you want to scale your startup or manage investments efficiently, this dashboard becomes an essential tool.
❓ Frequently Asked Questions (FAQs)
1. What is the main purpose of this dashboard?
The main purpose is to track startup performance using key metrics like revenue, funding, and churn.
2. Can beginners use this dashboard?
Yes, beginners can use it easily because Power BI provides an interactive interface.
3. What data source is required?
You can use Excel, SQL databases, or cloud-based data sources.
4. How often should I update the dashboard?
You should update it regularly, preferably weekly or monthly.
5. Can I customize this dashboard?
Yes, you can modify charts, KPIs, and layouts based on your needs.
6. Does it support real-time data?
Yes, Power BI supports real-time data integration.
7. Is this dashboard useful for investors?
Yes, investors can analyze funding trends and startup performance effectively.
8. What makes this dashboard unique?
It combines multiple startup metrics into one interactive and easy-to-use interface.
Visit our YouTube channel to learn step-by-step video tutorials