In today’s evolving workforce landscape, organizations focus heavily on apprenticeship programs to build skilled talent. However, managing apprentices, tracking training performance, monitoring costs, and analyzing placement outcomes can quickly become overwhelming.
Many organizations still rely on disconnected reports and manual spreadsheets. As a result, they struggle to gain clear insights and make timely decisions.
That’s exactly where the Apprenticeship Programs Dashboard in Power BI becomes a powerful solution. 🚀
This ready-to-use dashboard helps you monitor apprentices, analyze performance, track costs, and evaluate placements—all in one interactive platform. Moreover, it converts complex data into simple visuals, so you can make smarter and faster decisions.
In this complete guide, you will learn everything about this dashboard, including features, structure, advantages, best practices, and FAQs.
Click to Purchases Apprenticeship Programs Dashboard in Power BI
🤔 What is an Apprenticeship Programs Dashboard in Power BI?
An Apprenticeship Programs Dashboard in Power BI is an interactive data visualization tool designed to track and analyze apprenticeship program performance.
Instead of managing multiple Excel files, you can centralize all your apprenticeship data into one dashboard. Therefore, you improve efficiency, reduce errors, and gain better insights.
This dashboard helps you monitor:
-
👨🎓 Total Apprentices
-
💰 Training Cost & Stipend Amount
-
📊 Performance & Satisfaction Scores
-
🎯 Placement Outcomes
-
📍 Department & Regional Analysis
-
📅 Monthly Trends
Because Power BI supports real-time updates and dynamic visuals, you can analyze data instantly.
🚀 Why Do You Need an Apprenticeship Dashboard in Power BI?
Managing apprenticeship programs without proper tools creates confusion. However, a Power BI dashboard simplifies everything.
✅ Key Reasons:
-
Centralizes all apprenticeship data
-
Provides real-time insights
-
Improves training performance tracking
-
Helps control costs effectively
-
Enhances placement analysis
-
Speeds up decision-making
As a result, organizations can improve both training quality and workforce outcomes.
🧩 Key Features of Apprenticeship Programs Dashboard in Power BI
This dashboard includes 5 powerful pages, each designed for specific insights and analysis.
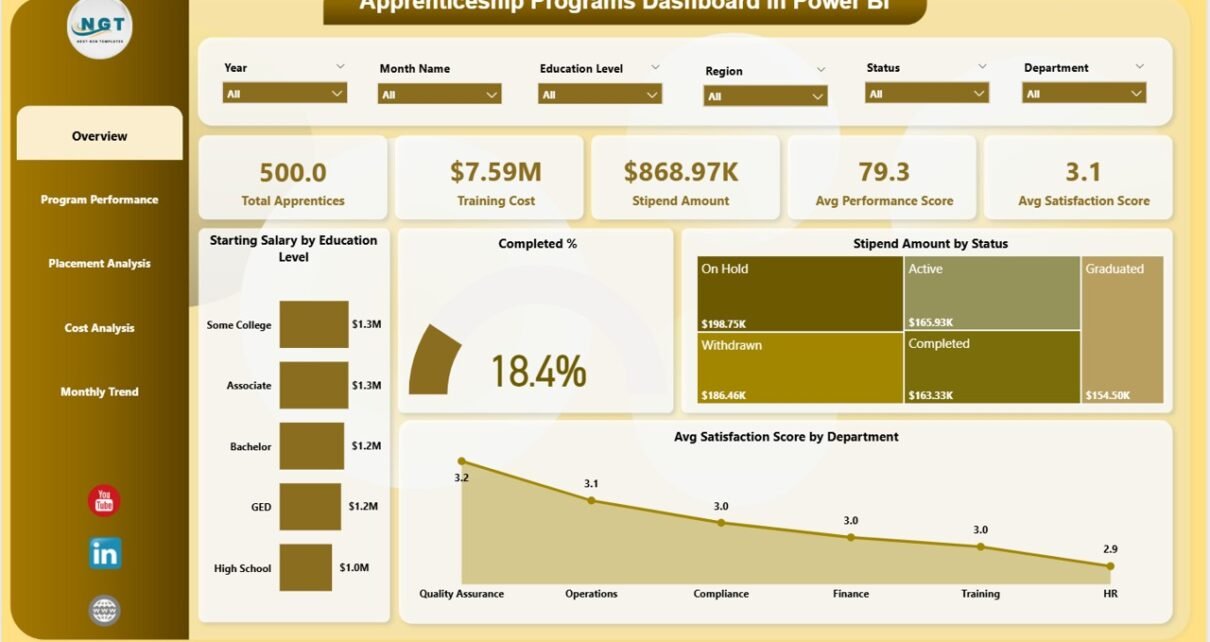
📌 1. Overview Page – Your Complete Program Snapshot
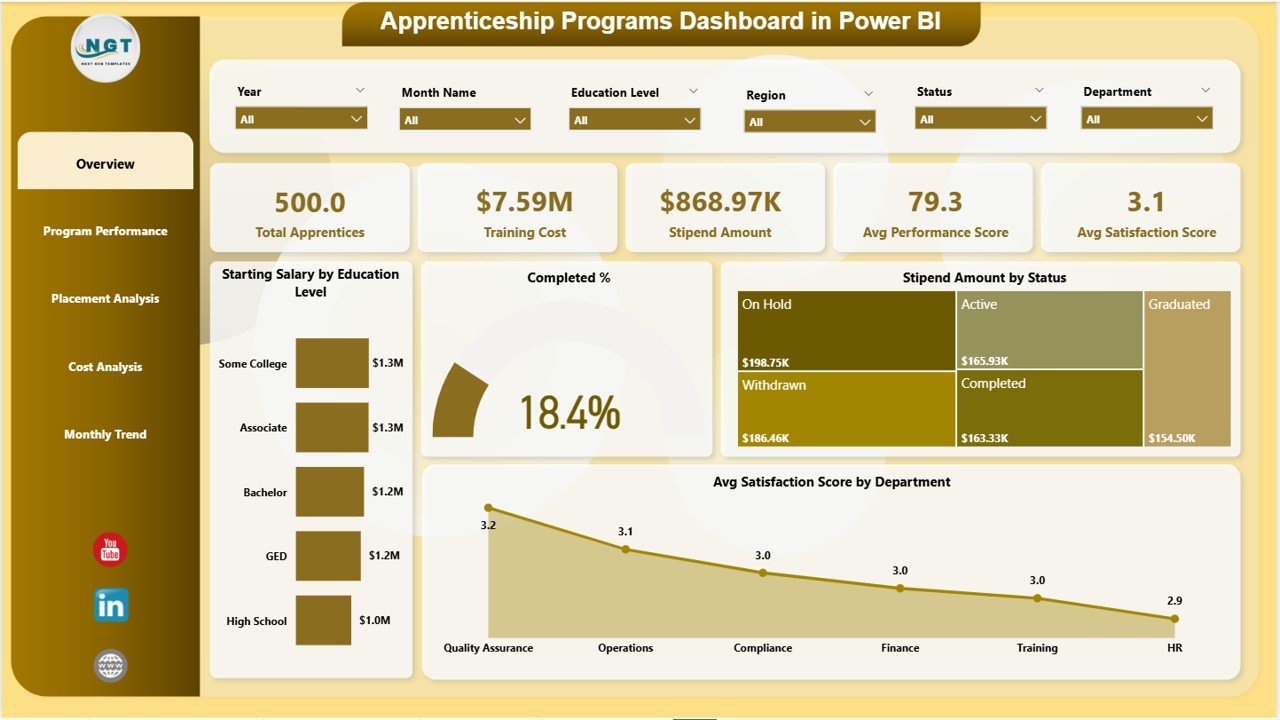
The Overview Page gives a quick summary of overall performance.
🔹 KPI Cards:
-
👨🎓 Total Apprentices
-
💰 Training Cost
-
💵 Stipend Amount
-
📊 Avg. Performance Score
-
⭐ Avg. Satisfaction Score
📊 Charts:
-
Starting Salary by Education Level
-
Completed %
-
Stipend Amount by Status
-
Avg. Satisfaction Score by Department
👉 Therefore, this page helps you quickly understand program performance.
Click to Purchases Apprenticeship Programs Dashboard in Power BI
📈 2. Program Performance – Measure Training Effectiveness
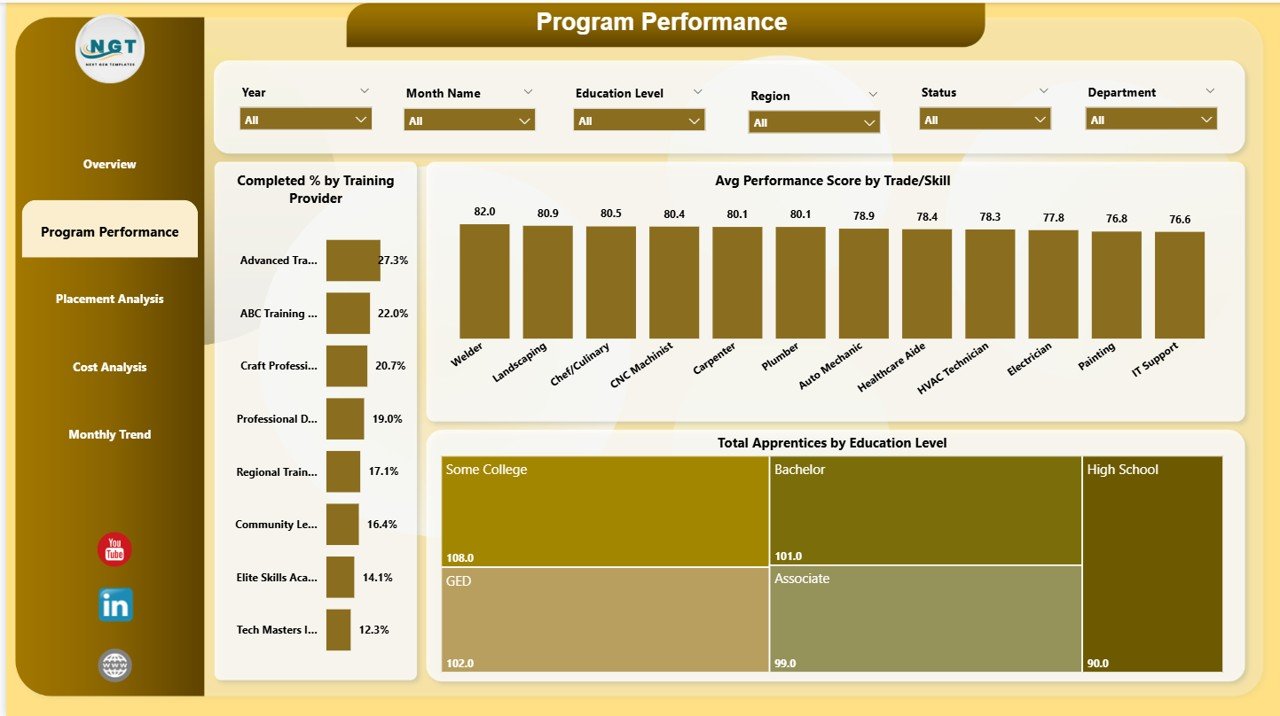
This page focuses on training outcomes and performance.
📊 Charts Included:
-
Completed % by Training Provider
-
Avg. Performance Score by Trade/Skill
-
Total Apprentices by Education Level
👉 As a result, you can identify which programs perform best.
🎯 3. Placement Analysis – Track Employment Outcomes
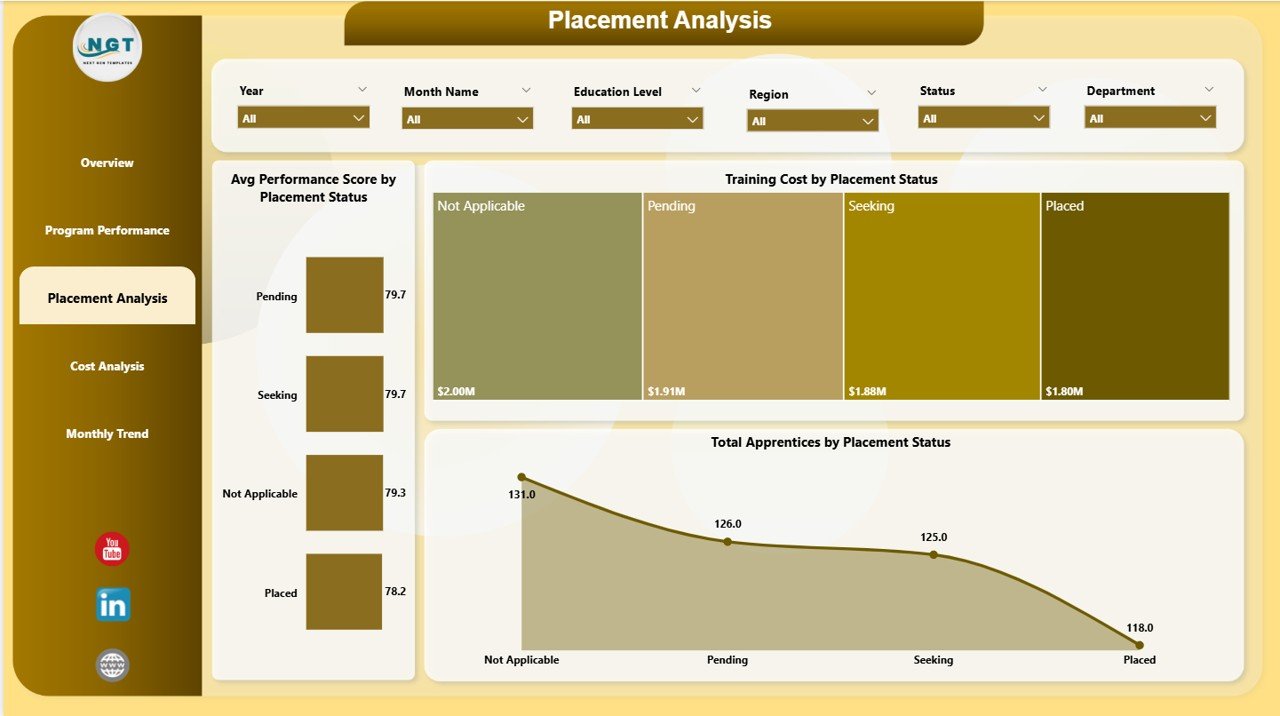
The Placement Analysis Page helps evaluate placement success.
📊 Charts Included:
-
Avg. Performance Score by Placement Status
-
Training Cost by Placement Status
-
Total Apprentices by Placement Status
👉 Therefore, you can analyze placement effectiveness and improve outcomes.
💰 4. Cost Analysis – Control Training Expenses
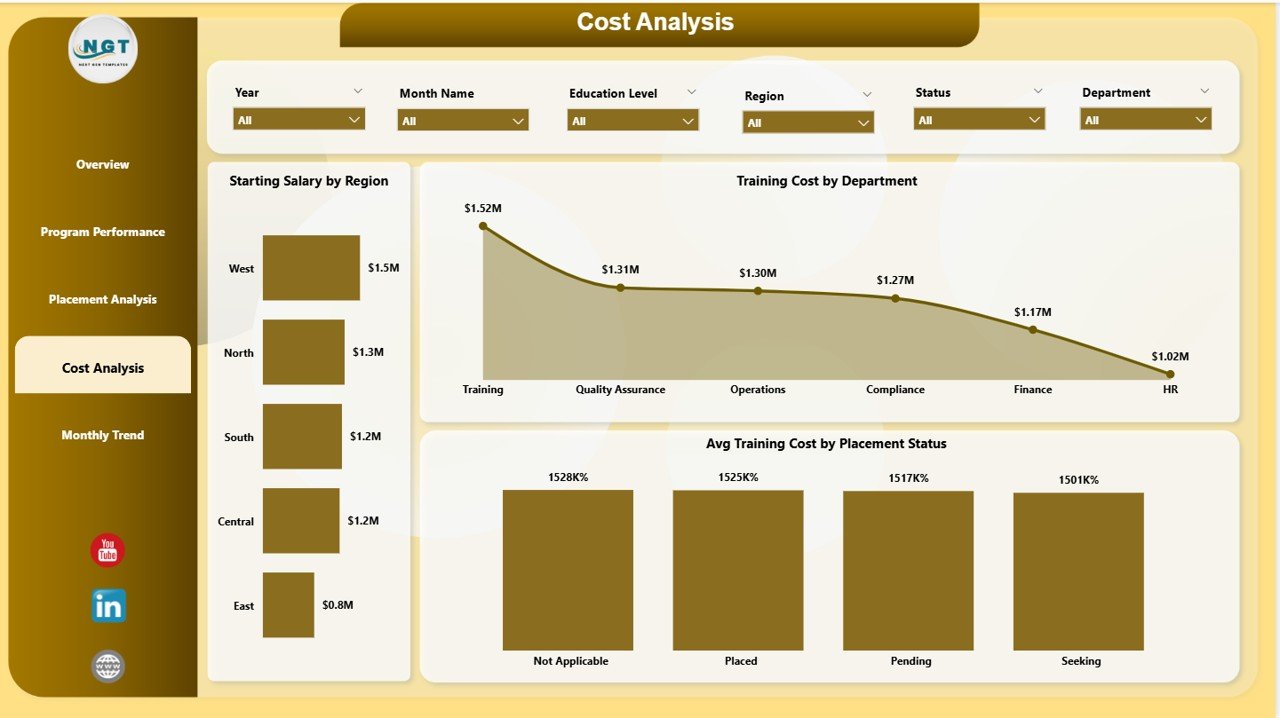
This page focuses on cost optimization.
📊 Charts Included:
-
Starting Salary by Region
-
Training Cost by Department
-
Avg. Training Cost by Placement Status
👉 As a result, you can track spending and optimize budgets.
📅 5. Monthly Trends – Monitor Progress Over Time
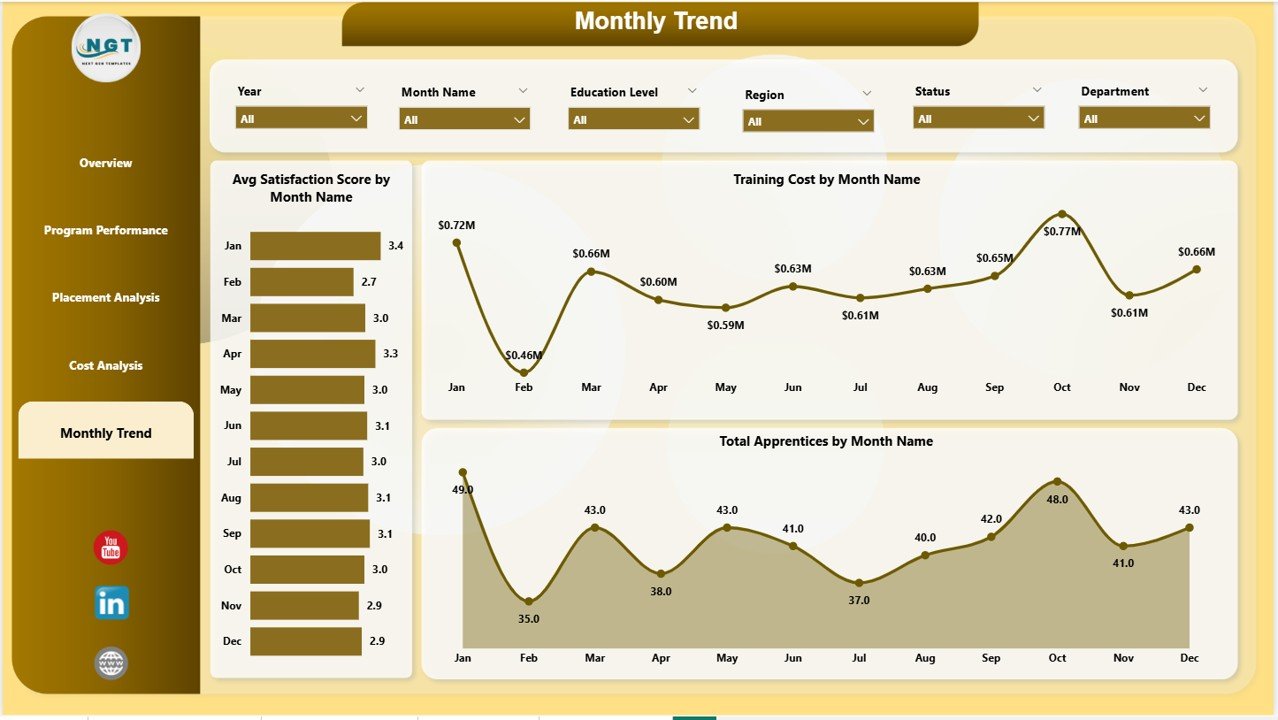
The Monthly Trends Page helps you track performance trends.
📊 Charts Included:
-
Avg. Satisfaction Score by Month
-
Training Cost by Month
-
Total Apprentices by Month
👉 Therefore, you can analyze growth and identify patterns.
🌟 Advantages of Apprenticeship Programs Dashboard in Power BI
Using this dashboard offers several benefits.
💡 Key Advantages:
-
Real-Time Insights
You get instant data updates for better decisions. -
Centralized Data Management
You manage everything in one place. -
Improved Performance Tracking
You monitor training and apprentice progress easily. -
Better Cost Control
You analyze training expenses effectively. -
Enhanced Placement Analysis
You track job placement success clearly. -
Interactive Visualization
You explore data with filters and drill-downs.
⚙️ How to Use the Apprenticeship Programs Dashboard in Power BI?
Using this dashboard is simple and effective.
📌 Step-by-Step Guide:
-
Load Your Data
Import apprenticeship data into Power BI. -
Connect Data Sources
Link your datasets with the dashboard. -
Use Filters (Slicers)
Analyze data by region, department, or trade. -
Review KPI Cards
Monitor key metrics like cost and performance. -
Explore Visuals
Drill down into charts for deeper insights. -
Track Trends
Monitor monthly changes and improvements.
👉 As a result, you can quickly convert data into actionable insights.
Click to Purchases Apprenticeship Programs Dashboard in Power BI
📊 Best Practices for the Apprenticeship Programs Dashboard
To maximize effectiveness, follow these best practices:
✅ Best Practices:
-
Keep data updated regularly
-
Focus on key performance indicators
-
Use filters to analyze specific segments
-
Monitor monthly trends consistently
-
Compare performance across providers
-
Keep visuals simple and clean
👉 Therefore, you ensure accurate and meaningful insights.
🔍 Opportunities for Improvement in Apprenticeship Programs
Even with a dashboard, improvement remains important.
💡 Key Improvement Areas:
-
Increase completion rates
-
Improve satisfaction scores
-
Reduce training costs
-
Enhance placement success
-
Optimize training provider performance
👉 As a result, organizations can achieve better outcomes.
👥 Who Can Benefit from This Dashboard?
This dashboard is useful for many users.
🎯 Ideal Users:
-
HR Managers
-
Training Coordinators
-
Educational Institutions
-
Government Skill Programs
-
Workforce Development Organizations
👉 Therefore, anyone managing apprenticeship programs can benefit.
🔮 Future of Apprenticeship Analytics with Power BI
The future of workforce development depends on data. Therefore, dashboards will play a critical role.
With Power BI:
-
You can use predictive analytics
-
You can automate reporting
-
You can improve workforce planning
-
You can enhance training efficiency
👉 As a result, data-driven apprenticeship programs will become the standard.
📝 Conclusion
The Apprenticeship Programs Dashboard in Power BI is a powerful tool that helps organizations track training, monitor costs, and analyze placement outcomes.
It simplifies complex data and provides actionable insights. Moreover, it improves decision-making and program efficiency.
If you want to improve your apprenticeship programs and achieve better results, this dashboard is the perfect solution. 🚀
Click to Purchases Apprenticeship Programs Dashboard in Power BI
❓ Frequently Asked Questions (FAQs)
1. What is an Apprenticeship Programs Dashboard in Power BI?
It is an interactive tool used to track apprentices, training performance, costs, and placements.
2. Who can use this dashboard?
HR teams, training institutes, and organizations can use it.
3. Does Power BI support real-time updates?
Yes, Power BI allows real-time or near real-time data updates.
4. Can I customize the dashboard?
Yes, you can modify visuals, KPIs, and filters.
5. What are the key KPIs in this dashboard?
Total apprentices, training cost, stipend, performance score, and satisfaction score.
6. Is Power BI required to use this dashboard?
Yes, Power BI Desktop or Service is required.
7. How does this dashboard improve decision-making?
It provides clear insights, enabling faster and smarter decisions.
Click to Purchases Apprenticeship Programs Dashboard in Power BI
Visit our YouTube channel to learn step-by-step video tutorials