In today’s rapidly evolving transportation industry, autonomous vehicles are transforming how businesses operate. Companies now rely heavily on data to monitor vehicle performance, track costs, and improve operational efficiency. However, when this data remains scattered across multiple spreadsheets, it becomes difficult to analyze and make informed decisions.
So, how can you manage autonomous vehicle data, reduce operational costs, and improve performance—all in one place?
👉 The answer is the Autonomous Vehicles Dashboard in Excel.
This ready-to-use and interactive Excel dashboard helps you track key metrics like fuel cost, maintenance cost, revenue, and vehicle performance. Moreover, it converts complex data into easy-to-understand visuals. Therefore, you can make faster, smarter, and more effective decisions.
In this detailed guide, you will explore everything about this dashboard, including its features, benefits, best practices, and frequently asked questions.
Click to Purchases Autonomous Vehicles Dashboard in Excel
📊 What is an Autonomous Vehicles Dashboard in Excel?
An Autonomous Vehicles Dashboard in Excel is a structured and interactive tool designed to track and analyze fleet performance using Excel.
Instead of manually analyzing multiple reports, this dashboard allows you to:
- 🚗 Monitor total vehicles and fleet size
- 💰 Track fuel/energy and maintenance costs
- 📉 Analyze operating expenses
- 📊 Evaluate revenue generation
- 🌍 Understand performance across regions and manufacturers
As a result, businesses can streamline operations and improve efficiency.
🚀 Why Do You Need an Autonomous Vehicles Dashboard?
Managing autonomous vehicle data without a dashboard can lead to confusion, errors, and missed opportunities. However, when you use an Excel dashboard, you gain full control over your data.
Because:
- You centralize all information in one place
- You reduce manual effort and errors
- You improve decision-making speed
- You gain real-time insights
Therefore, you can optimize your fleet performance and reduce unnecessary costs.
📌 Key Features of Autonomous Vehicles Dashboard in Excel
This dashboard includes 5 powerful analytical pages, along with a data sheet and support sheet. In addition, it features a left-side page navigator, which makes navigation easy and user-friendly.
🧭 1. Overview Page – Get a Complete Business Snapshot
The Overview Page provides a quick summary of your entire fleet performance.

🔢 KPI Cards:
- 🚗 Total Vehicles
- ⚡ Fuel / Energy Cost
- 🔧 Maintenance Cost
- 💸 Operating Cost
- 💰 Revenue Generated
📊 Charts:
- Operating Cost by Priority
- Revenue Generated by Sensor Type
- Maintenance Cost by Compliance Status
- Fuel/Energy Cost by Manufacturer
👉 Therefore, this page helps you quickly understand your overall business performance.
🚘 2. Vehicle Type Analysis – Which Vehicles Perform Best?
The Vehicle Type Analysis Page focuses on performance across different vehicle categories.
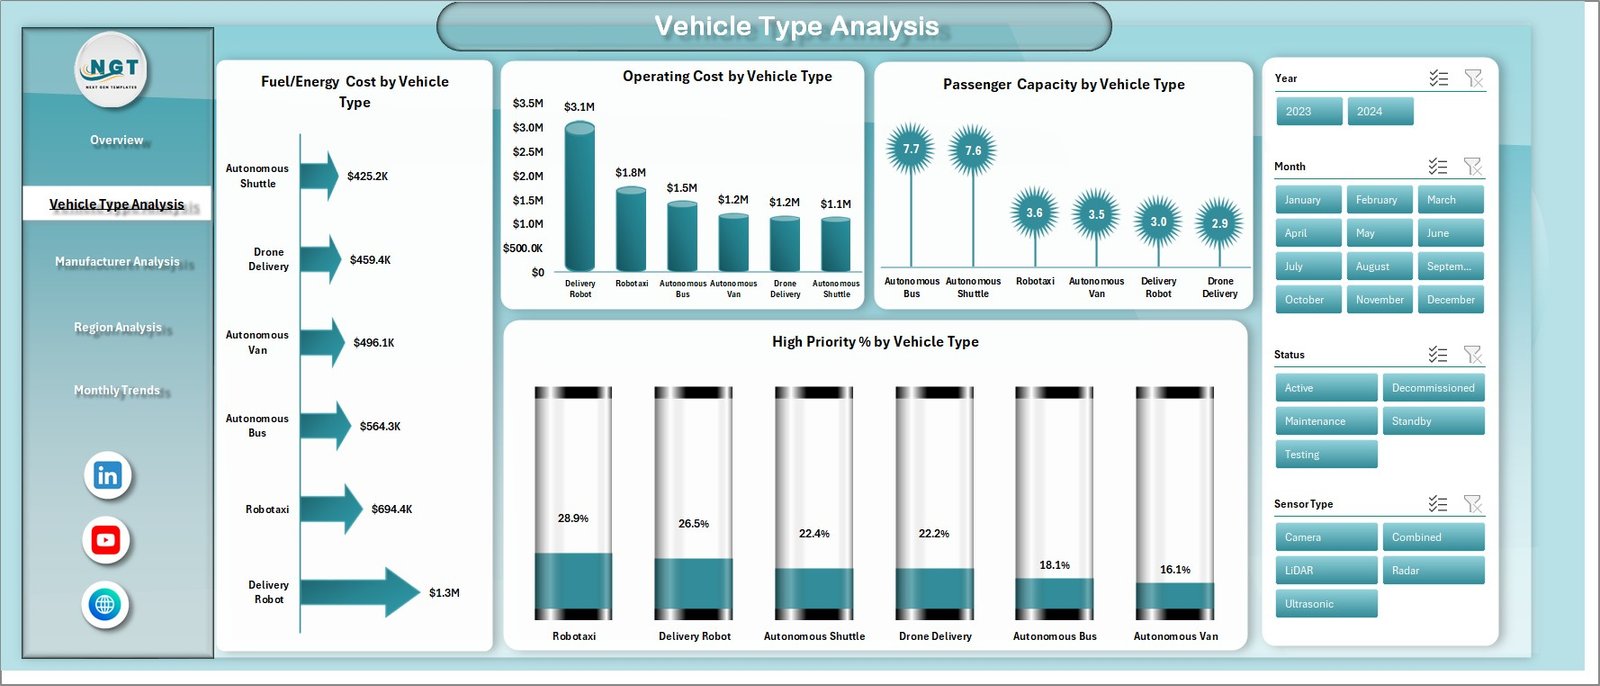
📊 Charts:
- Fuel/Energy Cost by Vehicle Type
- Operating Cost by Vehicle Type
- Passenger Capacity by Vehicle Type
- High Priority % by Vehicle Type
👉 As a result, you can identify which vehicle types are cost-efficient and high-performing.
🏭 3. Manufacturer Analysis – Which Manufacturer Delivers the Best Results?
The Manufacturer Analysis Page helps you evaluate performance based on vehicle manufacturers.

📊 Charts:
- Maintenance Cost by Manufacturer
- Revenue Generated by Manufacturer
- Total Vehicles by Manufacturer
- Operating Cost by Manufacturer
👉 Therefore, you can compare manufacturers and choose the most efficient partners.
🌍 4. Region Analysis – How Does Performance Vary by Location?
The Region Analysis Page provides insights into geographical performance.

📊 Charts:
- High Priority by Region
- Fuel/Energy Cost by Region
- Operating Cost by Region
- Total Vehicles by Region
👉 As a result, you can identify high-performing regions and areas that need improvement.
📅 5. Monthly Trends – Track Performance Over Time
The Monthly Trends Page helps you monitor trends and patterns over time.

📊 Charts:
- Fuel/Energy Cost by Month
- Maintenance Cost by Month
- Revenue Generated by Month
👉 Therefore, you can analyze trends and plan your future strategy accordingly.
💡 How Does This Dashboard Improve Fleet Management?
This dashboard goes beyond basic reporting. It helps you take action.
Because:
- You can track costs in real time
- You can monitor vehicle efficiency
- You can optimize maintenance schedules
- You can improve revenue strategies
As a result, your fleet becomes more efficient and profitable.
✅ Advantages of Autonomous Vehicles Dashboard in Excel
Using this dashboard provides several benefits:
🎯 Better Decision Making
- You get clear insights instantly
- You make faster decisions
💰 Cost Optimization
- You monitor fuel and maintenance costs
- You reduce unnecessary expenses
📊 Easy Data Visualization
- You simplify complex data
- You improve understanding
🚗 Improved Fleet Performance
- You track vehicle efficiency
- You enhance operations
📈 Increased Revenue
- You identify profitable segments
- You optimize strategies
⚙️ How to Use the Autonomous Vehicles Dashboard?
Using this dashboard is simple and user-friendly.
Step-by-Step Guide:
- 📥 Enter your data into the Data Sheet
- 🔄 Refresh pivot tables (Support Sheet)
- 🎛️ Use slicers to filter data
- 📊 Analyze insights on each page
- 🎯 Take action based on results
👉 Therefore, even beginners can easily use this dashboard.
🔥 Best Practices for the Autonomous Vehicles Dashboard
To maximize the benefits, follow these best practices:
📌 Keep Data Accurate
- Always update your data
- Avoid errors and duplicates
📊 Focus on Key Metrics
- Track important KPIs only
- Avoid unnecessary clutter
🔄 Update Regularly
- Refresh data frequently
- Monitor trends continuously
🎯 Use Filters Effectively
- Apply slicers smartly
- Drill down into insights
📈 Analyze Trends
- Monitor monthly changes
- Identify patterns early
📉 Common Challenges and Solutions
Although dashboards are powerful, some challenges may arise.
❌ Data Overload
👉 Solution: Focus only on key metrics
❌ Poor Data Quality
👉 Solution: Maintain clean and updated data
❌ Lack of Insights
👉 Solution: Focus on actionable analysis
🎯 Who Can Benefit from This Dashboard?
This dashboard is ideal for:
- 🚗 Fleet Managers
- 📊 Data Analysts
- 🏢 Transportation Companies
- 🚀 Autonomous Vehicle Startups
- 💼 Business Owners
👉 Therefore, anyone managing vehicle operations can benefit from this tool.
📈 How Does It Improve Business Performance?
This dashboard directly impacts your business growth.
Because:
- You reduce operational costs
- You improve vehicle utilization
- You enhance decision-making
- You increase profitability
As a result, your business becomes more efficient and competitive.
🧠 Future of Autonomous Vehicle Analytics
The future of autonomous vehicles depends on data and analytics.
In the coming years:
- AI will enhance decision-making
- Real-time tracking will become standard
- Predictive analytics will improve efficiency
👉 Therefore, dashboards like this will become essential tools.
🏁 Conclusion
The Autonomous Vehicles Dashboard in Excel is a powerful and practical tool for managing fleet data effectively. It simplifies complex information and provides clear insights.
Moreover, it helps you track costs, analyze performance, and improve decision-making. As a result, you can optimize operations and increase profitability.
So, if you want to take your fleet management to the next level, this dashboard is a must-have solution.
Click to Purchases Autonomous Vehicles Dashboard in Excel
❓ Frequently Asked Questions (FAQs)
1. What is an Autonomous Vehicles Dashboard in Excel?
It is an Excel-based tool used to track and analyze vehicle performance, costs, and revenue.
2. Who should use this dashboard?
Fleet managers, analysts, and transportation companies can use it.
3. Is this dashboard beginner-friendly?
Yes, it is easy to use and requires basic Excel knowledge.
4. What data is required?
You need data related to vehicles, costs, revenue, and regions.
5. How often should I update it?
You should update it regularly for accurate insights.
6. Can I customize this dashboard?
Yes, you can modify it based on your needs.
7. Does it support automation?
Yes, it uses pivot tables and slicers for automation.
8. How does it improve efficiency?
It provides insights that help reduce costs and improve performance.
Click to Purchases Autonomous Vehicles Dashboard in Excel
Visit our YouTube channel to learn step-by-step video tutorials