Introduction
The Women in Tech Communities Dashboard is a versatile and ready-to-use Excel tool designed to provide comprehensive insights into the dynamics of women-led technology events and communities. By simply updating the data sheet and refreshing the dashboard, users can instantly visualize key metrics, enabling efficient tracking and analysis across various parameters. This dashboard aims to empower organizers, sponsors, and community managers to make data-driven decisions that enhance engagement and impact.
Click to Purchases Women in Tech Communities Dashboard in Excel
Key Features of Women in Tech Communities Dashboard
- Intuitive overview page with high-level KPI cards and interactive charts.
- Multiple pages focusing on community impact, regional analysis, event performance, and topic insights.
- Built-in slicers for rapid filtering and exploration of data subsets.
- Dynamic pivot tables powering the dashboard, ensuring smooth refresh after data updates.
- Easy data update process through a dedicated data sheet tab.
Dashboard Pages Explanation
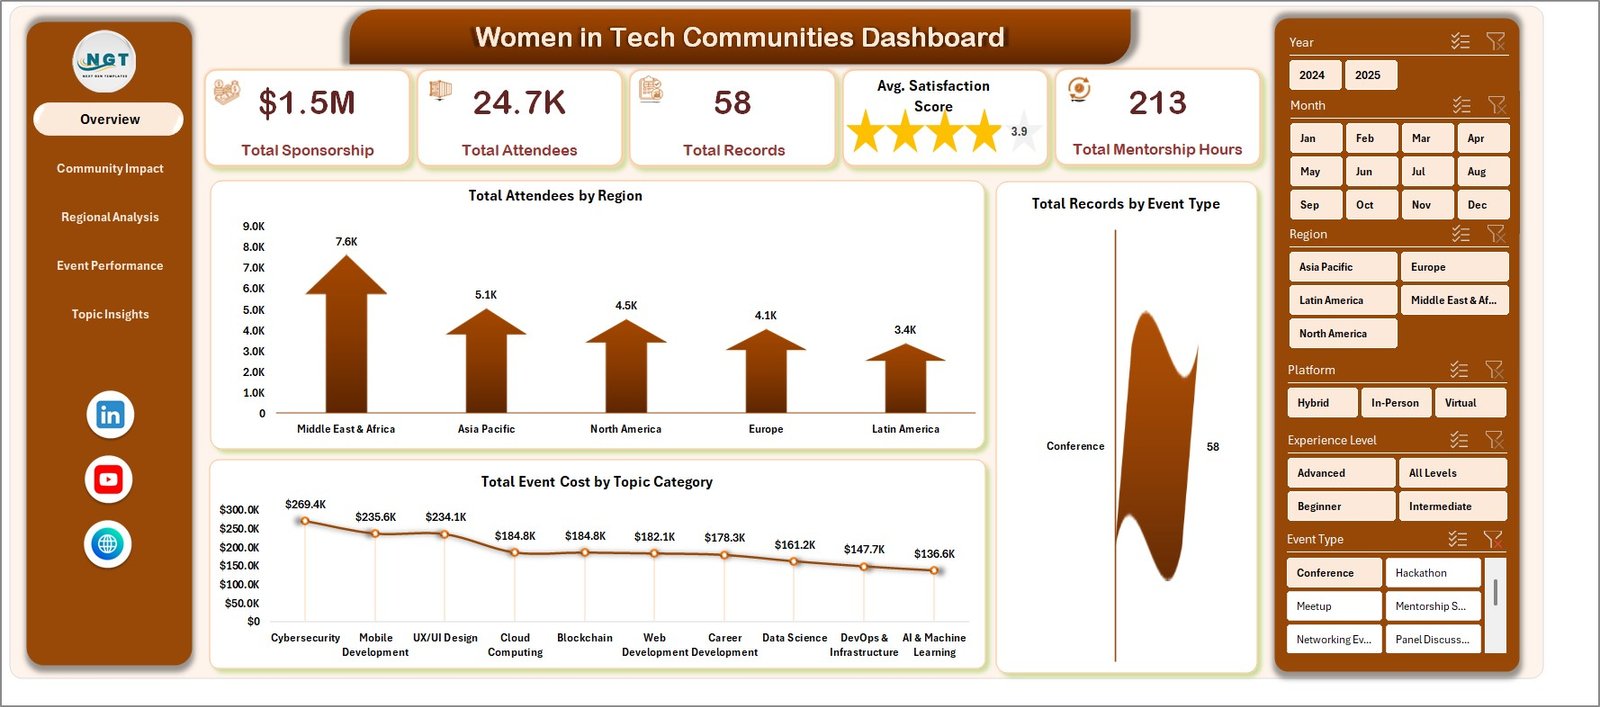
1. Overview Page
This is the primary dashboard page providing a snapshot of key performance indicators and charts for quick comprehension.
- Total Sponsorship: Displays the sum of all sponsorship amounts across events.
- Total Attendees: Shows the overall number of participants engaging in all community events.
- Total Records: Represents the total count of recorded entries or events in the dataset.
- Avg. Satisfaction Score: Highlights the average satisfaction rating given by attendees.
- Total Mentorship Hours: Measures the cumulative hours spent on mentorship programs.
Charts on the Overview Page:
- Total Attendance by Region: Visualizes attendee numbers distributed geographically across different regions.
- Total Records by Event Type: Breaks down event records by their respective types for categorization insight.
- Total Event Cost by Topic Category: Shows how event expenditures vary according to topic focus.
Women in Tech Communities Dashboard
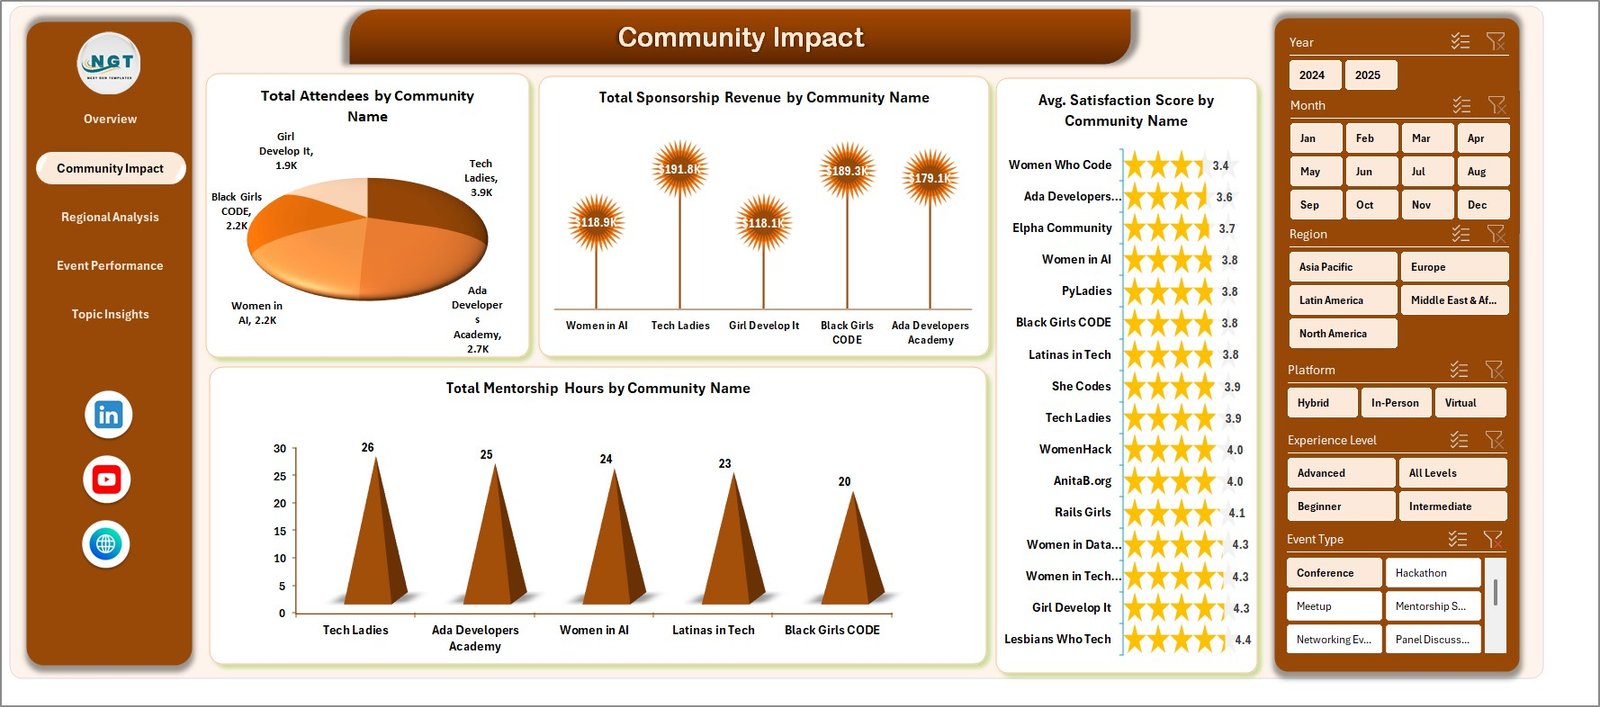
2. Community Impact
This page dives deeper into community-level analytics, offering insights related to attendance, sponsorship, satisfaction, and mentorship.
- Total Attendance by Community Name: Tracks how many attendees each community attracts.
- Total Sponsorship Revenue by Community Name: Measures financial support received by each community.
- Avg. Satisfaction Score by Community Name: Shows how pleased attendees are within each community.
- Total Mentorship Hours by Community Name: Quantifies the mentorship engagement level per community.
-
Click to Purchases Women in Tech Communities Dashboard in Excel
Community Impact Analysis
3. Regional Analysis
Focusing on geographic insights, this sheet helps identify regional trends and performance metrics.
- Total Sponsorship Revenue by Region: Analyzes the amount of sponsorship attracted in different regions.
- Total Attendees by County: Pinpoints attendee distribution down to the county level.
- Total Mentorship Hours by Region: Reflects mentorship contributions segmented regionally.
- Total Record by Region: Presents the count of events and activities per region.
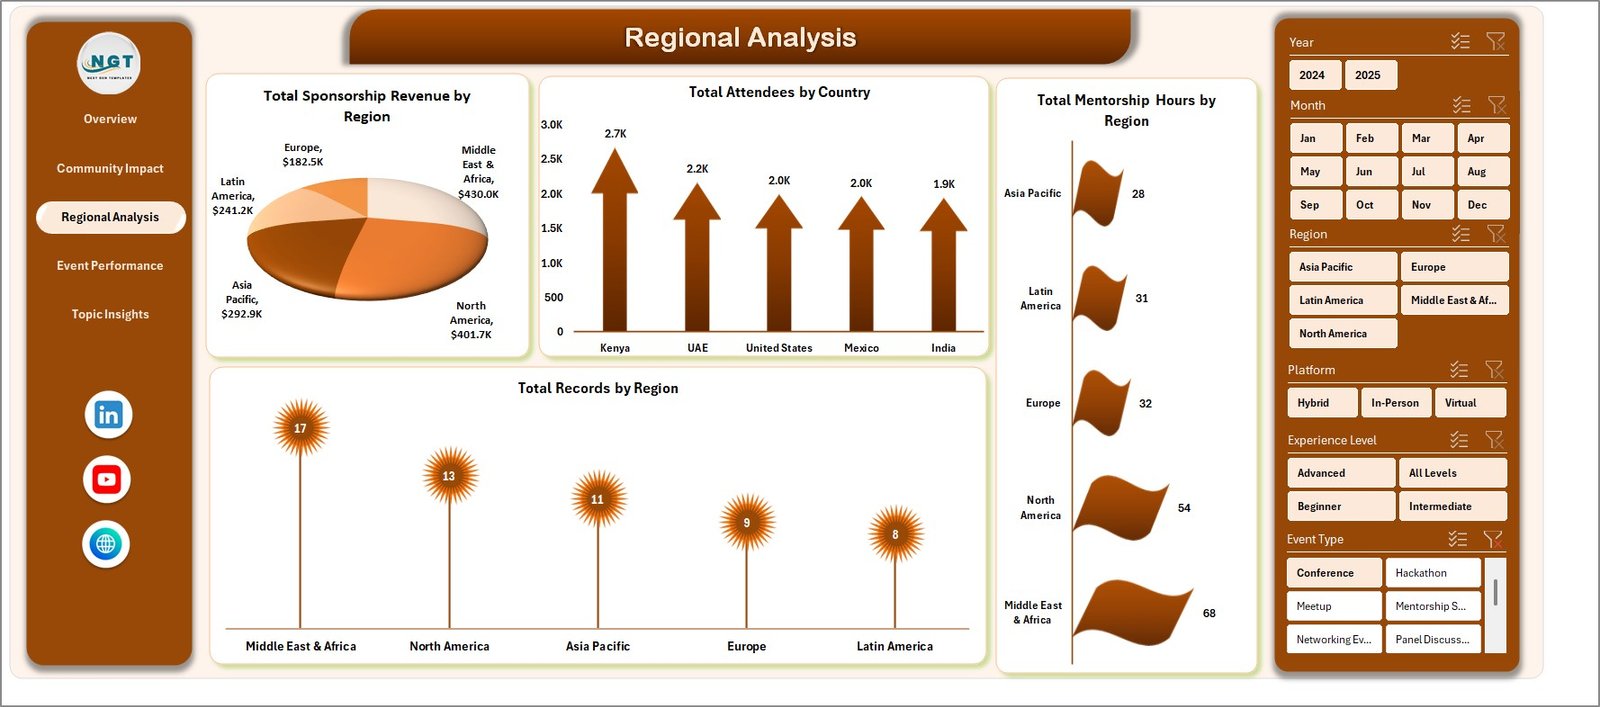
Regional Analysis
4. Event Performance
This tab provides analysis focused on event-specific metrics, helping evaluate event success and engagement.
- Total Sponsorship Revenue by Event Type: Breaks down the financial backing by event categories.
- Total Attendees by Event Type: Measures participant counts per event classification.
- High Engagement % by Event Type: Reflects the percentage of events achieving high attendee interaction.
- Total Record by Event Type: Shows the number of events held under each event type.
-
Click to Purchases Women in Tech Communities Dashboard in Excel
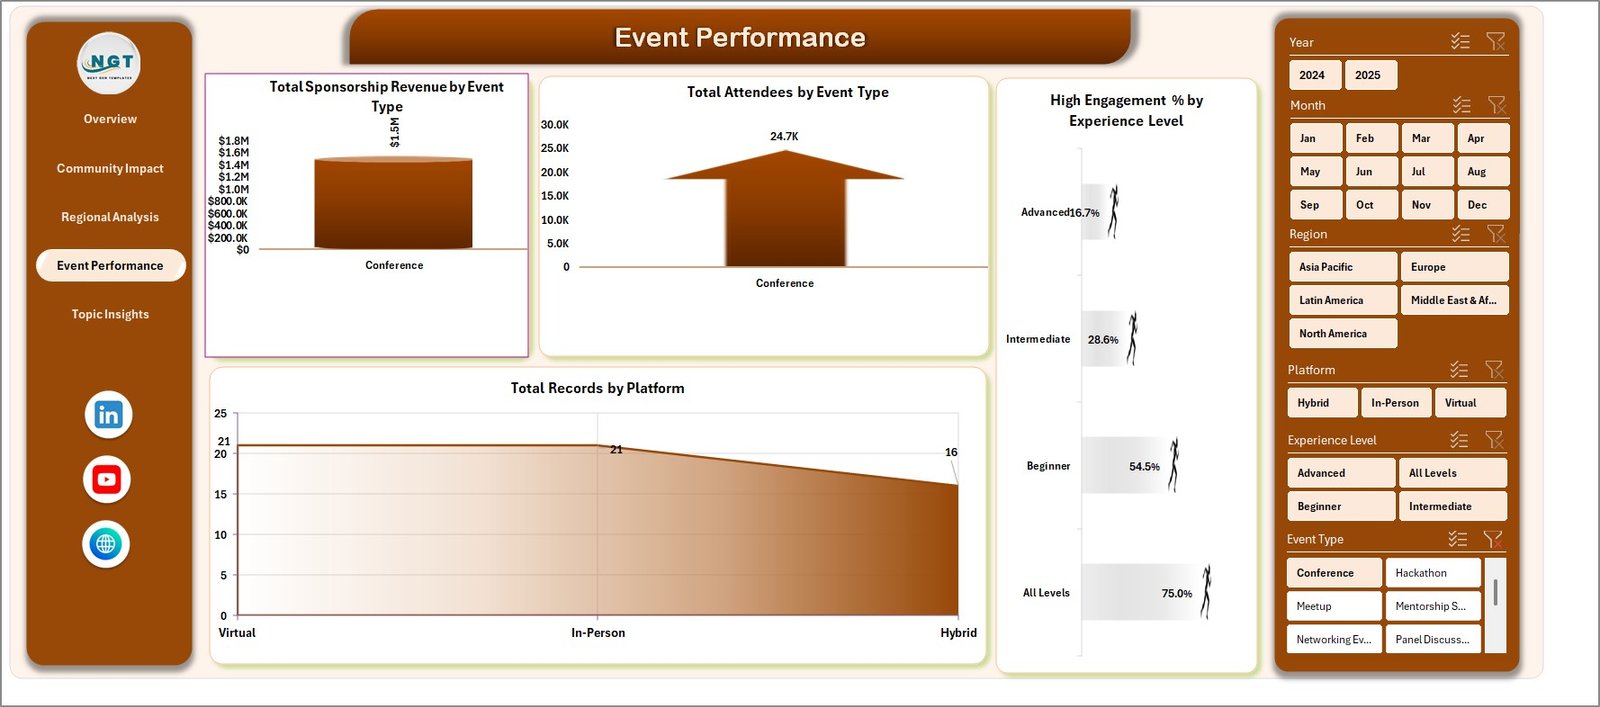
Event Performance Analysis
5. Topic Insights
Analyzing data from the perspective of subject matter, this page offers key details on topics driving sponsorship, event completion, and mentorship.
- Total Sponsorship Revenue by Topic Category: Shows how sponsorship is allocated across various thematic topics.
- Event Completed % by Topic Category: Indicates the percentage of events completed successfully under each topic.
- Total Mentorship Hours by Topic Category: Quantifies mentoring efforts focused by topic area.
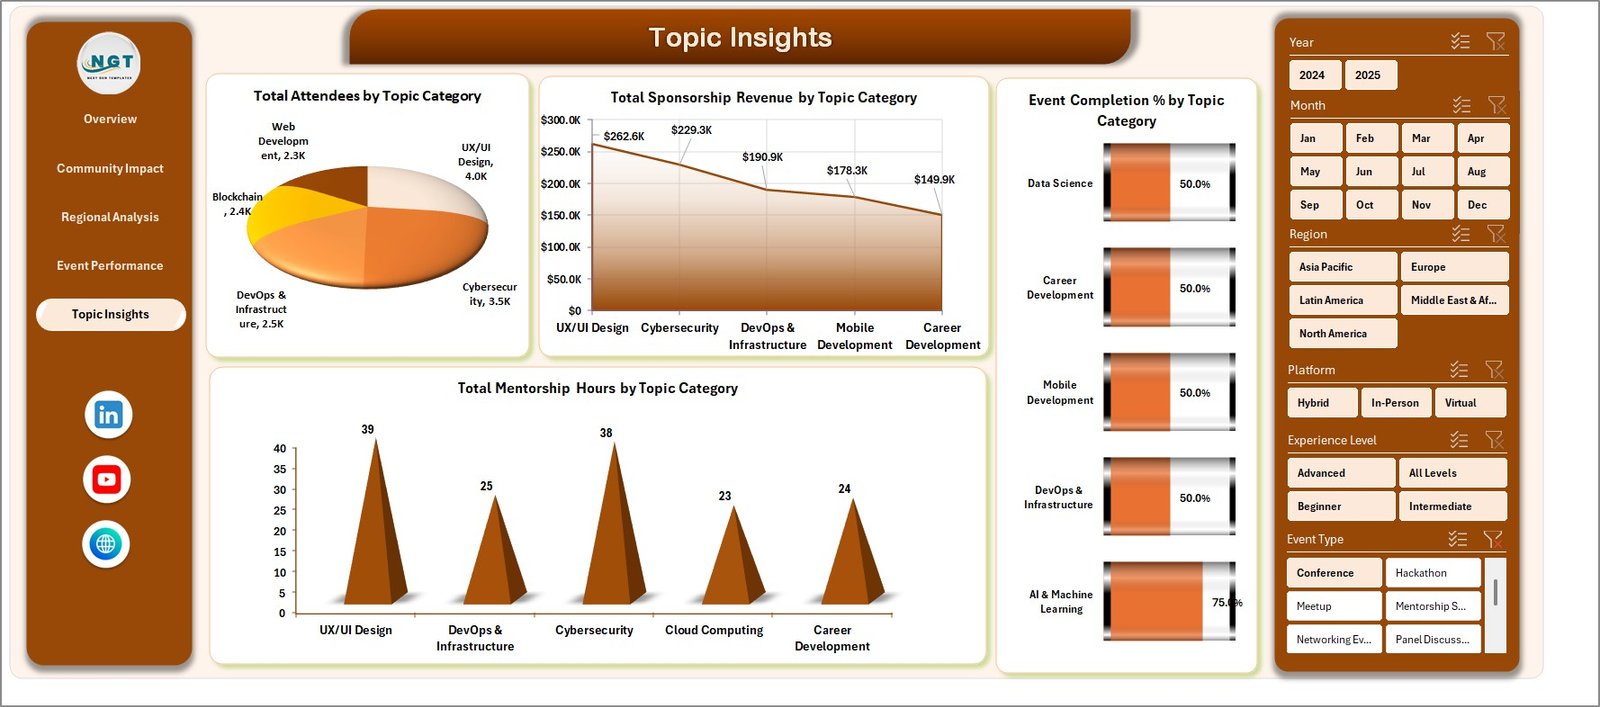
Topic Insights Analysis
6. Data Sheet Tab
The data sheet is the backbone of the dashboard. Users may input or update their raw data here. Ensure to maintain the provided format to keep dashboard functionality intact.

Data Sheet tab
7. Support Sheet
This tab contains multiple pivot tables that dynamically generate data for the dashboard charts and metrics. After updating your data, visit the Data tab in Excel Ribbon and click ‘Refresh All’ to update the entire dashboard. This sheet can be hidden for cleanliness.

Support sheet tab
Advantages of Women in Tech Communities Dashboard
- User-Friendly: Easy data entry and automatic dashboard refresh enhances accessibility.
- Comprehensive Insight: Multi-dimensional views help understand community performance at different levels.
- Time-Saving: Automated pivot refresh and slicers streamline analysis workflows.
- Customizable: Adaptable to different datasets following the provided data format.
- Visual Appeal: Intuitive charts and KPI cards provide a quick grasp of complex data.
Opportunities for Improvement
- Integration with live data sources or APIs could enhance real-time analytics capabilities.
- Adding predictive analytics could help forecast future event participation and sponsorship trends.
- Incorporation of social media sentiment analysis might reveal participant feedback trends beyond surveys.
- Mobile-friendly or web-based versions could increase accessibility outside of Excel.
-
Click to Purchases Women in Tech Communities Dashboard in Excel
Best Practices
- Maintain consistent data formatting in the Data Sheet tab for seamless dashboard updates.
- Refresh all pivot tables after each data change via the Excel Ribbon’s Data tab.
- Use slicers thoughtfully to filter views and uncover actionable insights quickly.
- Regularly backup your data file before making large-scale changes.
- Leverage the overview page for quick status updates, and dive into specific tabs for detailed analysis.
FAQs
- Q: How often should I update the data to keep the dashboard relevant?
A: Update data after every event cycle or as frequently as new data becomes available. - Q: Can I add new columns to the Data Sheet?
A: It’s recommended to avoid adding new columns as this may break pivot table references. - Q: Is this dashboard compatible with Google Sheets?
A: This dashboard is primarily designed for Excel, but can be adapted for Google Sheets with limited functionality. - Q: How do I share this dashboard with stakeholders?
A: Share the Excel file directly or export dashboards as PDF or images for presentations.
Conclusion
The Women in Tech Communities Dashboard offers a powerful quantitative tool for monitoring, evaluating, and enhancing women-led tech initiatives. With its ease of use, detailed multi-page insights, and visually rich reporting, it enables communities and organizers to identify growth opportunities and streamline decision-making. By leveraging this dashboard effectively, stakeholders can contribute to fostering stronger, more vibrant tech communities for women.