Managing blockchain development projects can quickly become complex. With multiple sprints, platforms, teams, and budgets involved, tracking everything manually often leads to confusion and inefficiency.
So, how can you simplify blockchain project management while improving visibility and decision-making?
👉 The answer is simple — Blockchain Development Dashboard in Excel.
In this detailed guide, you will learn everything about this powerful dashboard, including its features, pages, benefits, and best practices. Let’s dive in.
Click to Purchases Blockchain Development Dashboard in Excel
🔍 What is a Blockchain Development Dashboard in Excel?
A Blockchain Development Dashboard in Excel is a dynamic reporting tool that helps you track and analyze blockchain projects in one centralized place.
Instead of using scattered spreadsheets, you can monitor budgets, progress, team performance, and platform insights through interactive visuals.
Moreover, this dashboard transforms raw data into meaningful insights. As a result, you can make faster and smarter decisions.
❓ Why Should You Use a Blockchain Development Dashboard?
If you manage blockchain projects, then this dashboard becomes essential.
Here’s why:
- It centralizes all project data
- It improves visibility across teams and platforms
- It reduces manual reporting effort
- It enhances decision-making with real-time insights
- It helps track budget vs actual cost efficiently
Therefore, you not only save time but also improve project performance.
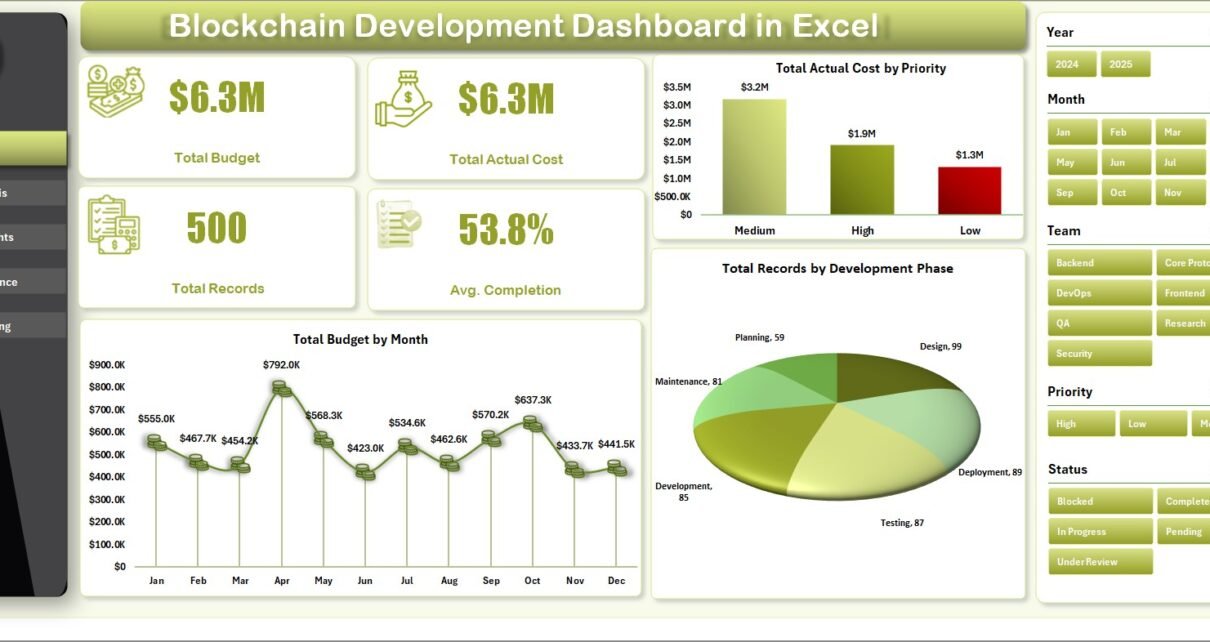
📊 Overview Page – What Insights Does It Provide?
The Overview Page gives you a high-level summary of your blockchain projects. It allows you to quickly understand the current status without diving into detailed sheets.
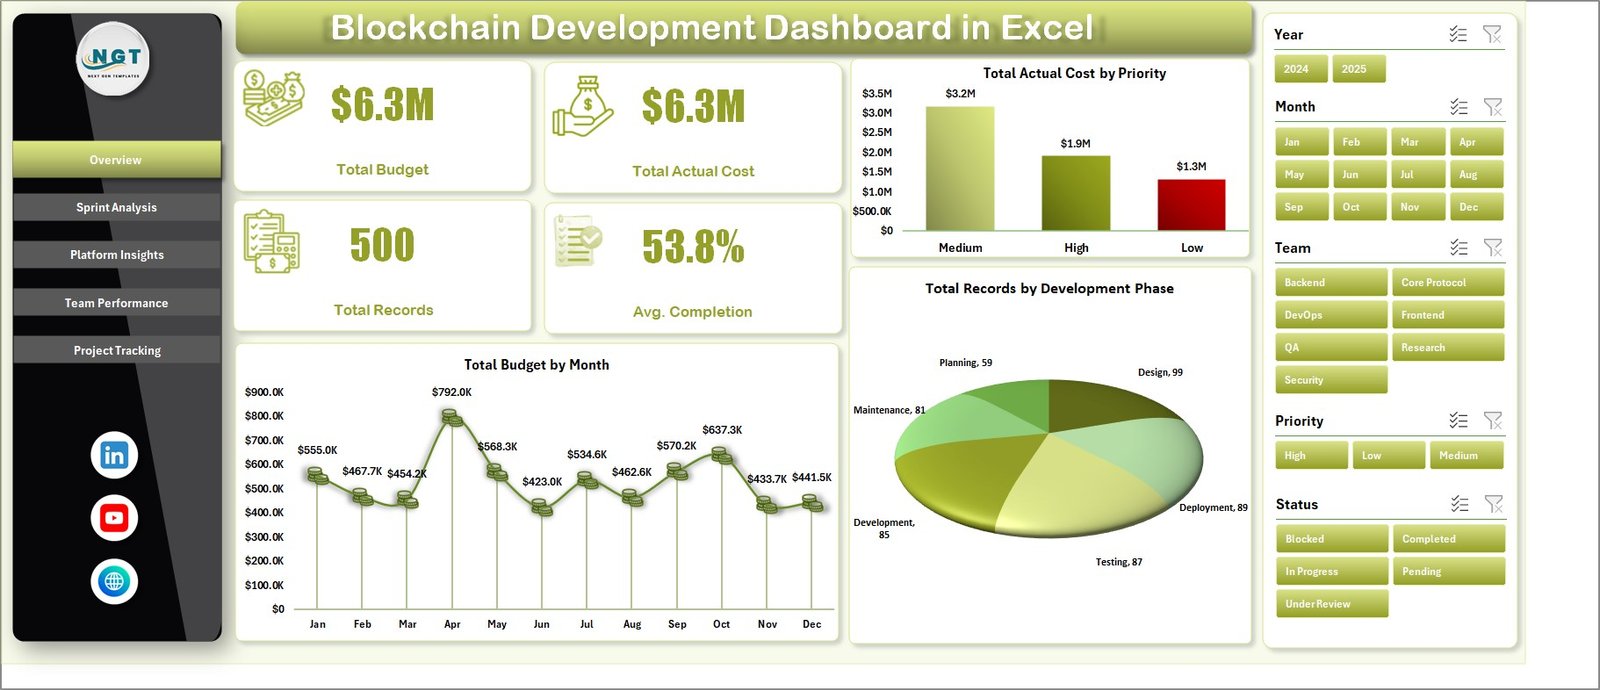
🔢 Key KPI Cards
At the top of the dashboard, you will find important KPI cards:
- Total Budget – Shows the overall allocated budget for all projects
- Total Actual Cost – Displays the total expenditure
- Total Records – Represents the total number of entries or tasks
- Average Completion (%) – Indicates overall project progress
These KPIs help you instantly evaluate performance.
📈 Charts on Overview Page
- Total Actual Cost by Priority
This chart shows how costs distribute across priority levels. It helps identify which priority projects consume more budget. - Total Budget by Month
This chart displays monthly budget allocation. Therefore, you can easily track spending trends over time. - Total Records by Development Phase
This chart highlights task distribution across phases. As a result, you can understand workload balance.
⚙️ Sprint Analysis – How to Track Development Progress?
The Sprint Analysis Page focuses on agile development tracking.
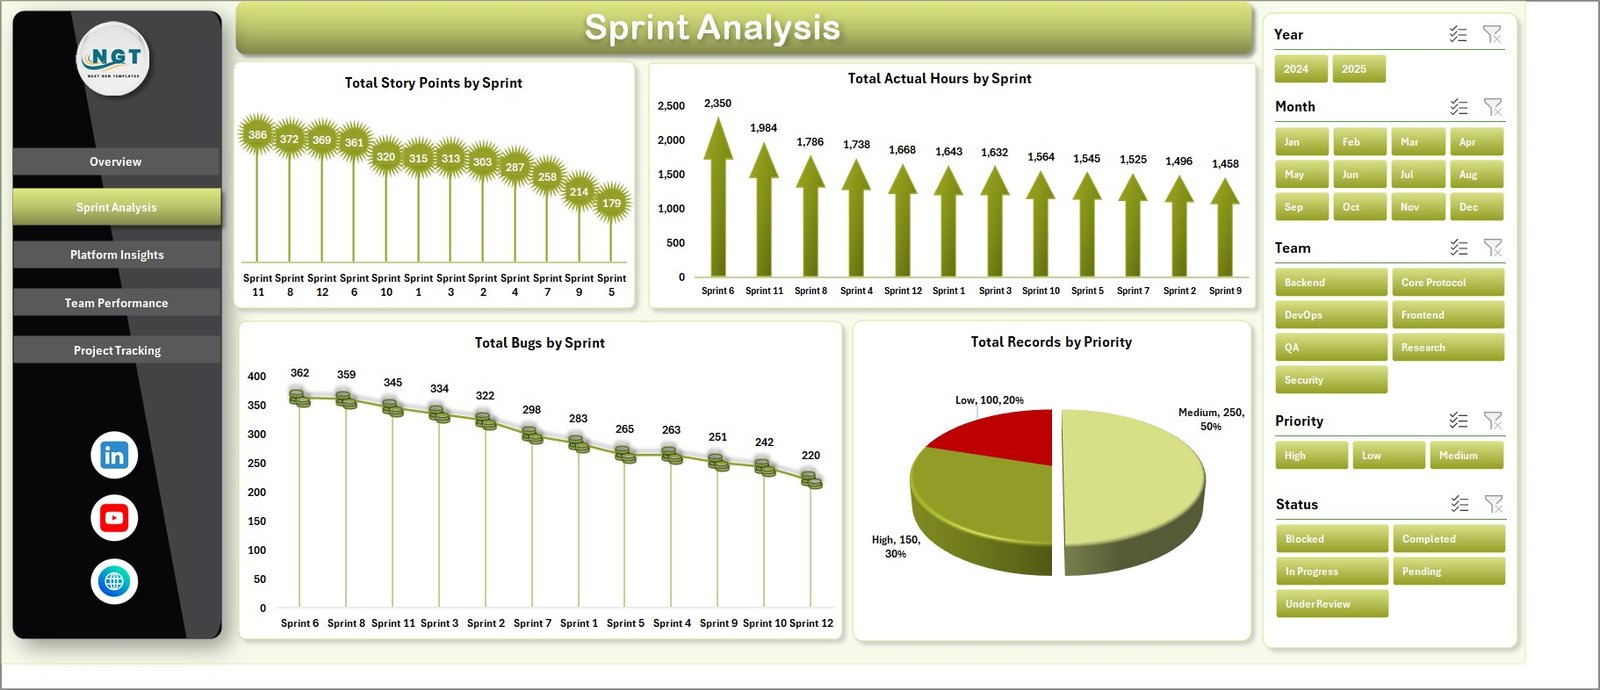
📊 Key Metrics
- Total Story Points by Sprint
This chart shows workload distribution across sprints. It helps evaluate sprint planning efficiency. - Total Actual Hours by Sprint
This metric tracks time spent in each sprint. Therefore, you can identify delays or inefficiencies. - Total Bugs by Sprint
This chart highlights bug trends. As a result, you can monitor quality improvements over time. - Total Records by Priority
This visual shows how tasks distribute by priority. It helps in prioritizing backlog effectively.
🌐 Platform Insights – Which Blockchain Platform Performs Best?
The Platform Insights Page helps you analyze performance across different blockchain platforms.
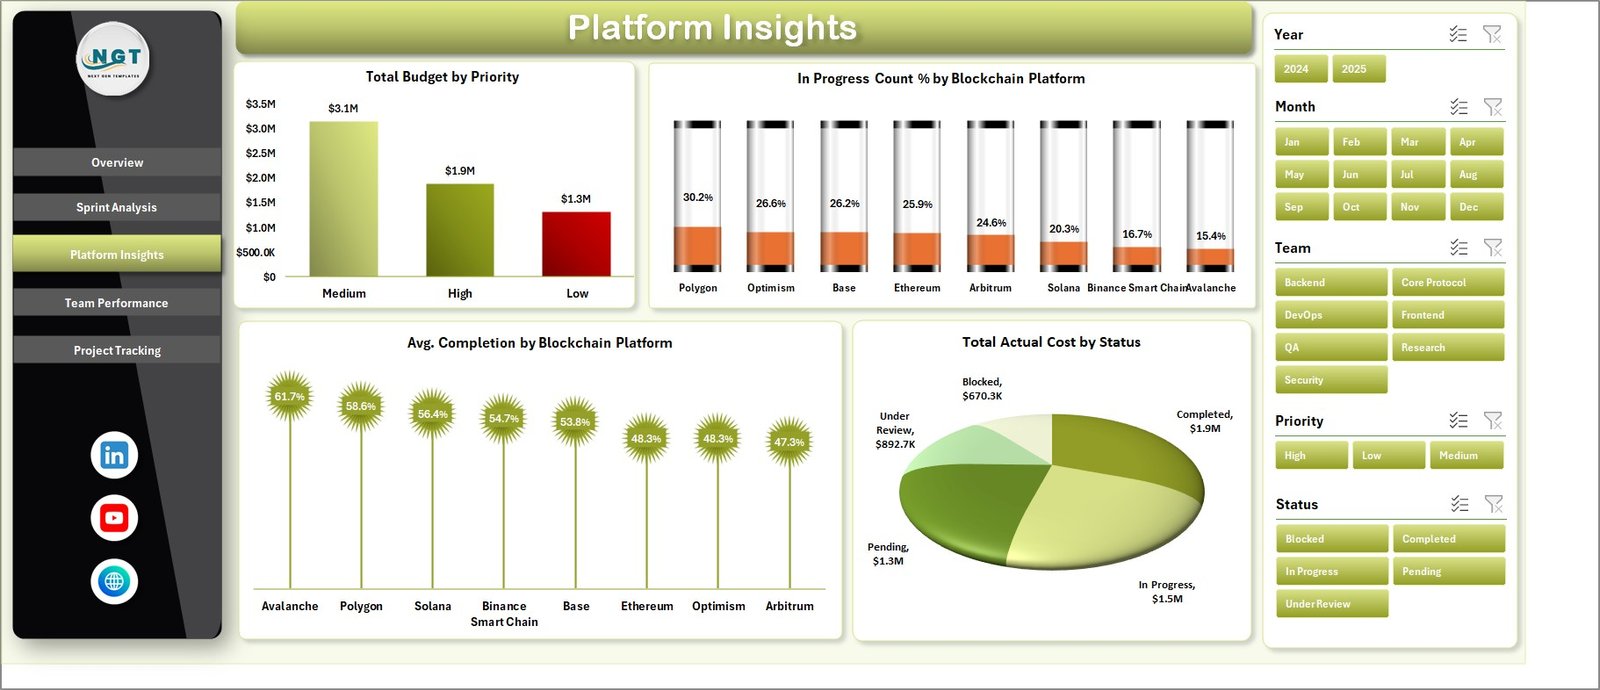
📊 Key Insights
- Total Budget by Priority
This chart shows budget allocation based on priority. It helps identify critical investment areas. - In Progress Count (%) by Blockchain Platform
This metric shows ongoing work across platforms. Therefore, you can compare platform activity levels. - Average Completion by Blockchain Platform
This chart evaluates completion efficiency. As a result, you can identify high-performing platforms. - Total Actual Cost by Status
This visual shows cost distribution across statuses. It helps track financial progress.
👨💻 Team Performance – How Efficient is Your Team?
The Team Performance Page focuses on evaluating team productivity.
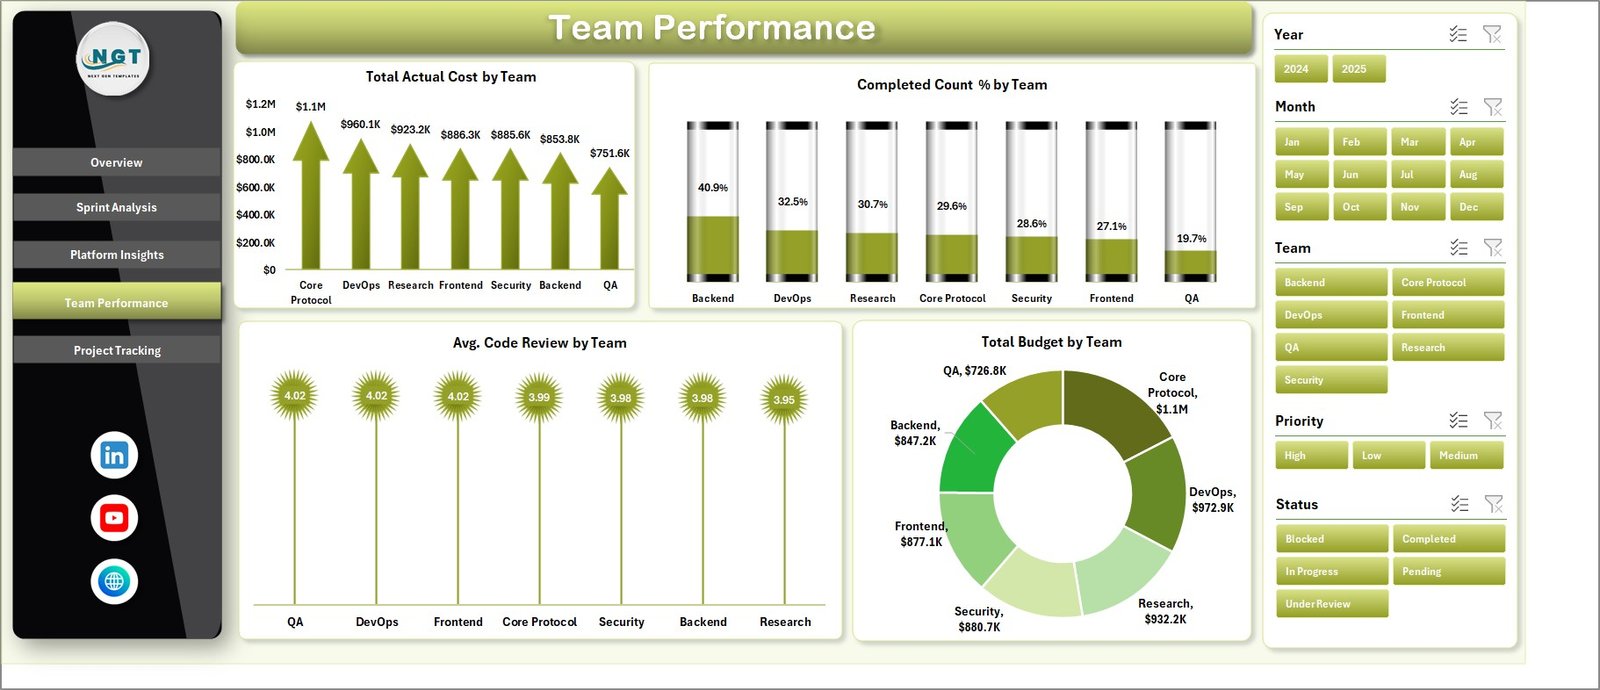
📊 Key Metrics
- Total Actual Cost by Team
This chart shows how much each team spends. It helps compare efficiency. - Completed Count (%) by Team
This metric shows completion rates. Therefore, you can identify high-performing teams. - Average Code Review by Team
This chart highlights code quality and review practices. - Total Budget by Team
This visual shows budget allocation across teams.
📁 Project Tracking – How to Monitor Project Status?
The Project Tracking Page helps you track project-level performance.
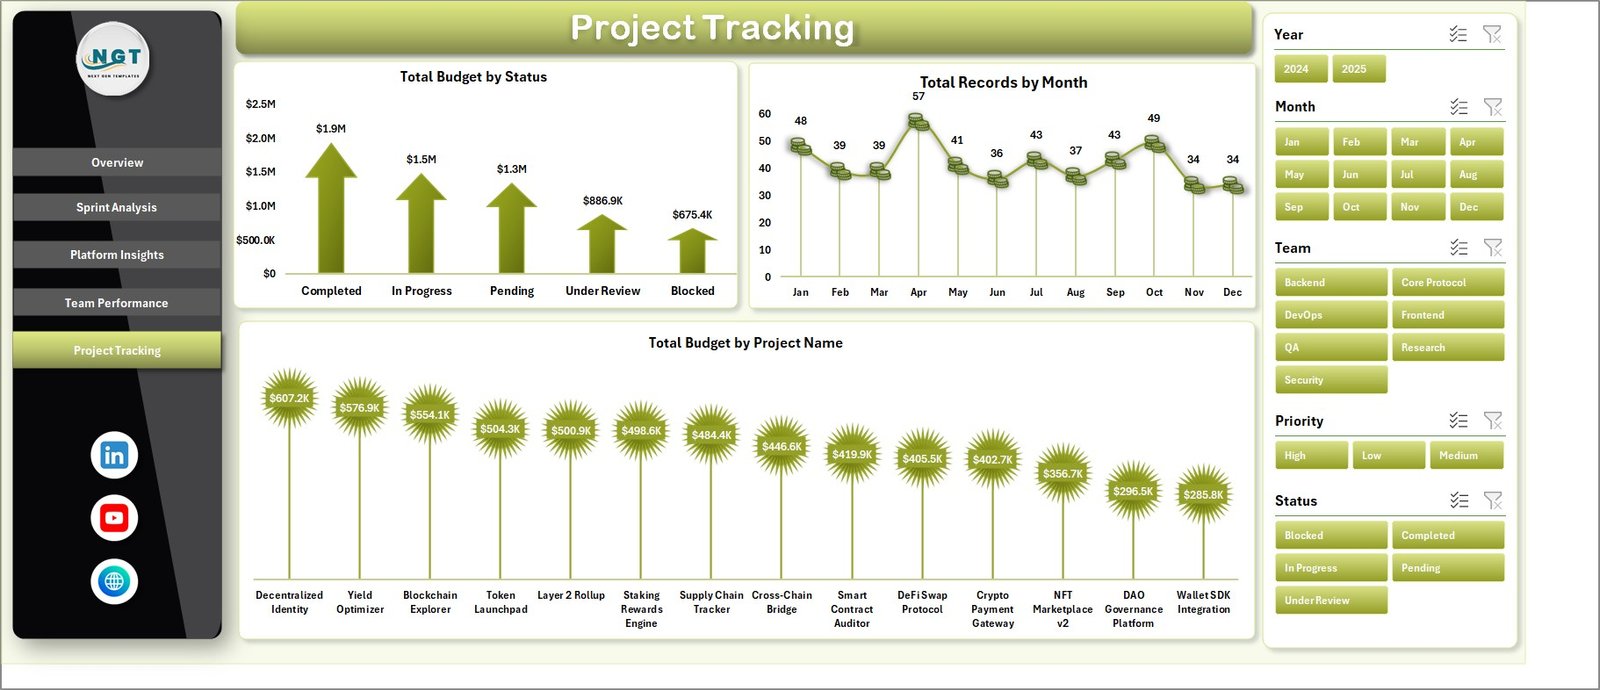
📊 Key Insights
- Total Budget by Status
This chart shows budget distribution across statuses like completed, in-progress, or pending. - Total Records by Month
This visual tracks monthly project activity. - Total Budget by Project Name
This chart highlights budget allocation across projects.
📄 Data Sheet Tab – Where Should You Add Data?
The Data Sheet is the backbone of the dashboard.
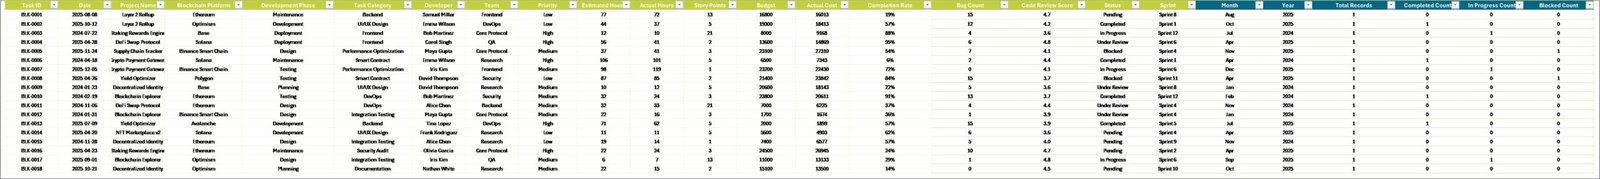
- You need to enter data in the same format
- It stores all raw project information
- It connects directly to pivot tables
Therefore, accurate data entry ensures accurate insights.
🔄 Support Sheet – How Does the Dashboard Work Dynamically?
The Support Sheet contains multiple pivot tables that power the entire dashboard.
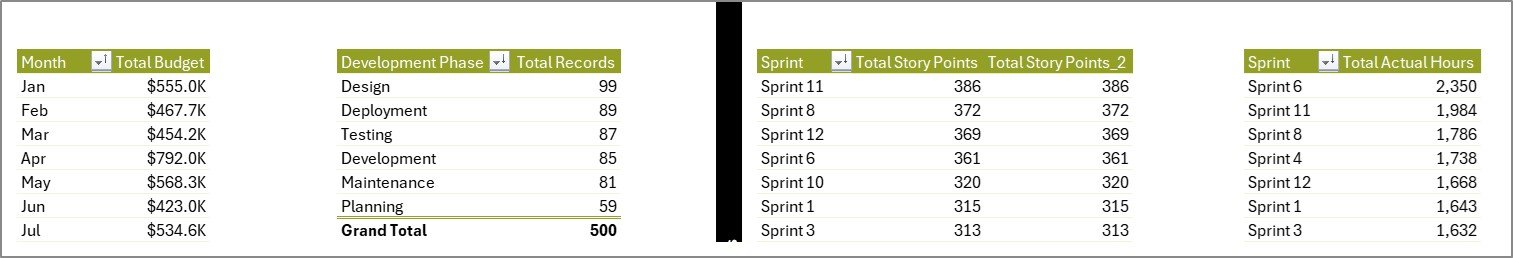
- It drives all charts and visuals
- It updates automatically after refresh
- You can hide this sheet for a cleaner interface
👉 Simply go to Data → Refresh All after updating the data.
🎯 Advantages of Blockchain Development Dashboard in Excel
Using this dashboard offers multiple benefits:
✅ Better Decision Making
- Provides real-time insights
- Helps identify trends quickly
✅ Improved Project Tracking
- Tracks budget vs actual cost
- Monitors progress efficiently
✅ Enhanced Team Productivity
- Evaluates team performance
- Identifies bottlenecks
✅ Time-Saving
- Reduces manual reporting
- Automates calculations
✅ Centralized Data Management
- Stores all data in one place
- Improves data accuracy
⚡ Best Practices for Blockchain Development Dashboard in Excel
To get the best results, follow these practices:
📌 Keep Data Clean
- Always use consistent formats
- Avoid duplicate entries
📌 Update Data Regularly
- Enter data daily or weekly
- Refresh dashboard frequently
📌 Use Filters Effectively
- Apply slicers for deeper insights
- Focus on specific metrics
📌 Monitor KPIs Closely
- Track budget and completion rates
- Identify issues early
📌 Customize as Needed
- Add new metrics if required
- Adjust visuals based on business needs
🔚 Conclusion – Why This Dashboard is a Must-Have?
The Blockchain Development Dashboard in Excel simplifies complex project management tasks.
Instead of struggling with multiple reports, you get a centralized, interactive, and easy-to-use solution.
Moreover, it helps you track performance, control costs, and improve decision-making.
So, if you want to manage blockchain projects efficiently, this dashboard becomes an essential tool.
Click to Purchases Blockchain Development Dashboard in Excel
❓ Frequently Asked Questions (FAQs)
1. What is a Blockchain Development Dashboard?
It is an Excel-based tool that helps track blockchain project performance, budget, and progress.
2. Can beginners use this dashboard?
Yes, the dashboard is user-friendly and easy to use.
3. How often should I update the data?
You should update data regularly, preferably daily or weekly.
4. Does this dashboard support multiple projects?
Yes, it can handle multiple blockchain projects at once.
5. Can I customize the dashboard?
Yes, you can modify charts, KPIs, and layouts based on your needs.
6. How do I refresh the dashboard?
Go to the Data tab and click on Refresh All.
Click to Purchases Blockchain Development Dashboard in Excel
Visit our YouTube channel to learn step-by-step video tutorials