International Arbitration Panels Dashboard in Power BI is a ready-to-use PBIX report for arbitration teams that need clear reporting across legal cost, claim amount, award amount, case status, settlement count, institution, region, seat, industry, risk level, case duration, recovery rate, settlement rate, and satisfaction score. The dashboard includes 5 Power BI report pages, 5 headline cards, multiple slicers, and 13 chart views. Instead of building arbitration reporting from scratch, users can open the report in Power BI Desktop, connect or replace structured data, refresh the model, and review portfolio performance quickly.
Power BI is a practical analytics layer for legal and finance teams because it supports interactive visuals, reusable report pages, and publishable dashboards. Microsoft documents Power BI Desktop as the authoring tool for connecting to data, shaping data, and building reports. Reference: Microsoft Learn: Get started with Power BI Desktop.
Click here to purchase International Arbitration Panels Dashboard in Power BI
Key Features of International Arbitration Panels Dashboard in Power BI
- 5 report pages covering Overview, Institution, Regional, Case Risk, and Outcomes analysis.
- 5 KPI cards for Total Legal Cost, Total Claim Amount, Total Cases, Settlement Count, and Total Award Amount.
- Claim and award reporting by industry and month name.
- Institution and seat analysis for legal cost, duration, and arbitration location review.
- Regional analysis for risk level, seat distribution, and award recovery rate.
- Case risk reporting by claim type, industry settlement rate, and duration by risk level.
- Outcome tracking by satisfaction score, region-level claim amount, and monthly settlement rate.
Dashboard Pages Explanation
1. Overview Page
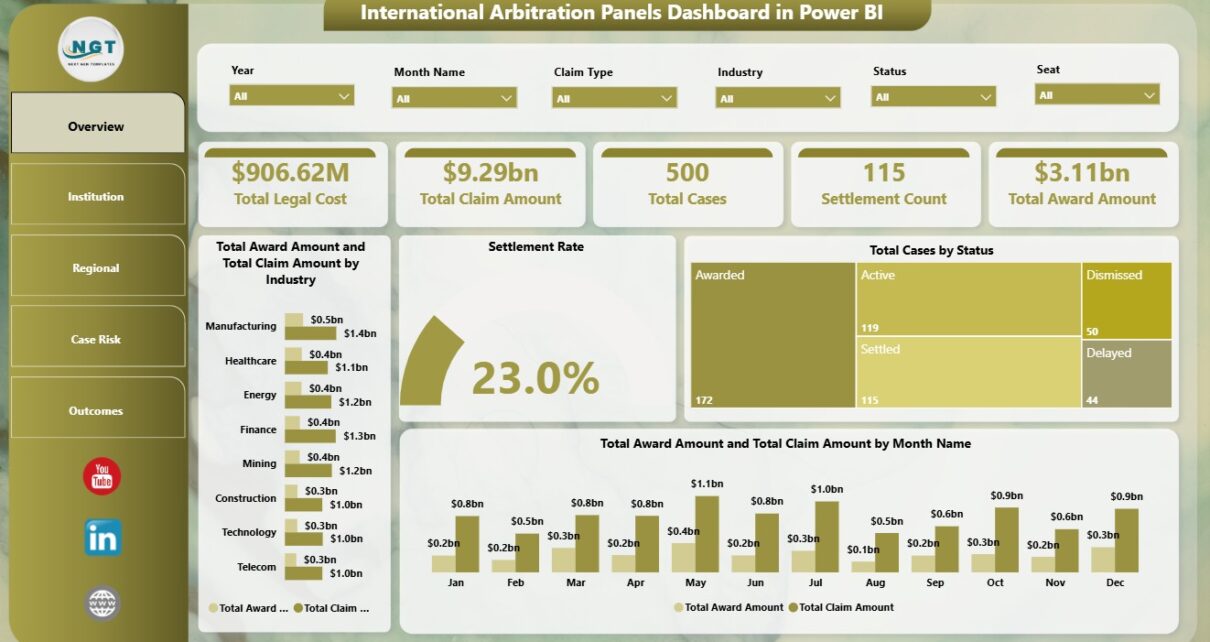
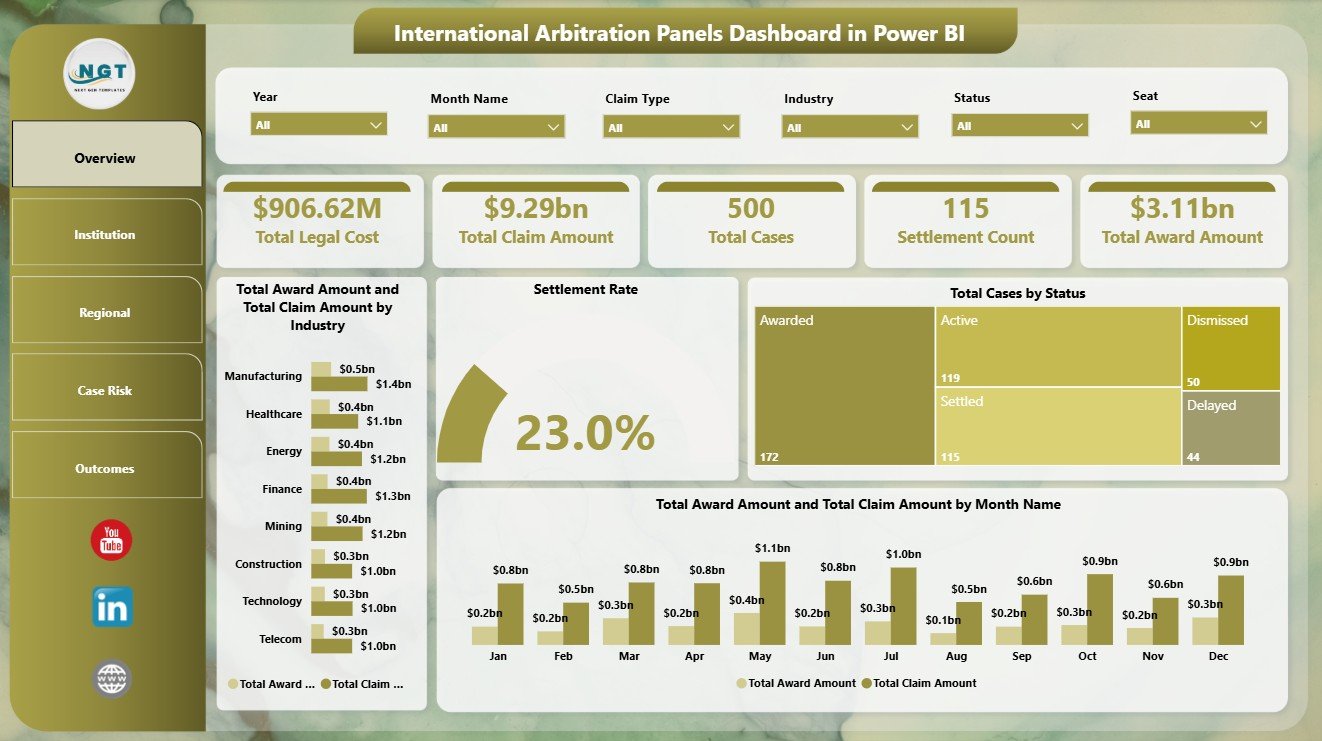
The Overview Page gives leadership a high-level arbitration snapshot. At the top, cards show Total Legal Cost, Total Claim Amount, Total Cases, Settlement Count, and Total Award Amount. Multiple slicers allow users to apply filters and see the filtered dashboard quickly.
Total Award Amount and Total Claim Amount by Industry: This chart compares claimed value and awarded value across industries. It helps identify which industries carry the highest exposure and where award results are closest to claims.
Settlement Rate by Overall Cases: This visual shows settlement rate in relation to total cases. It helps teams understand whether cases are resolving through settlement or moving toward other outcomes.
Total Cases by Status: This chart shows case distribution by status. It helps users see the active, settled, awarded, pending, delayed, or closed case mix at a glance.
Total Award Amount and Total Claim Amount by Month Name: This chart compares monthly claim and award values. It helps teams detect timing patterns, spikes, and changes in award recovery over time.
Click here to purchase International Arbitration Panels Dashboard in Power BI
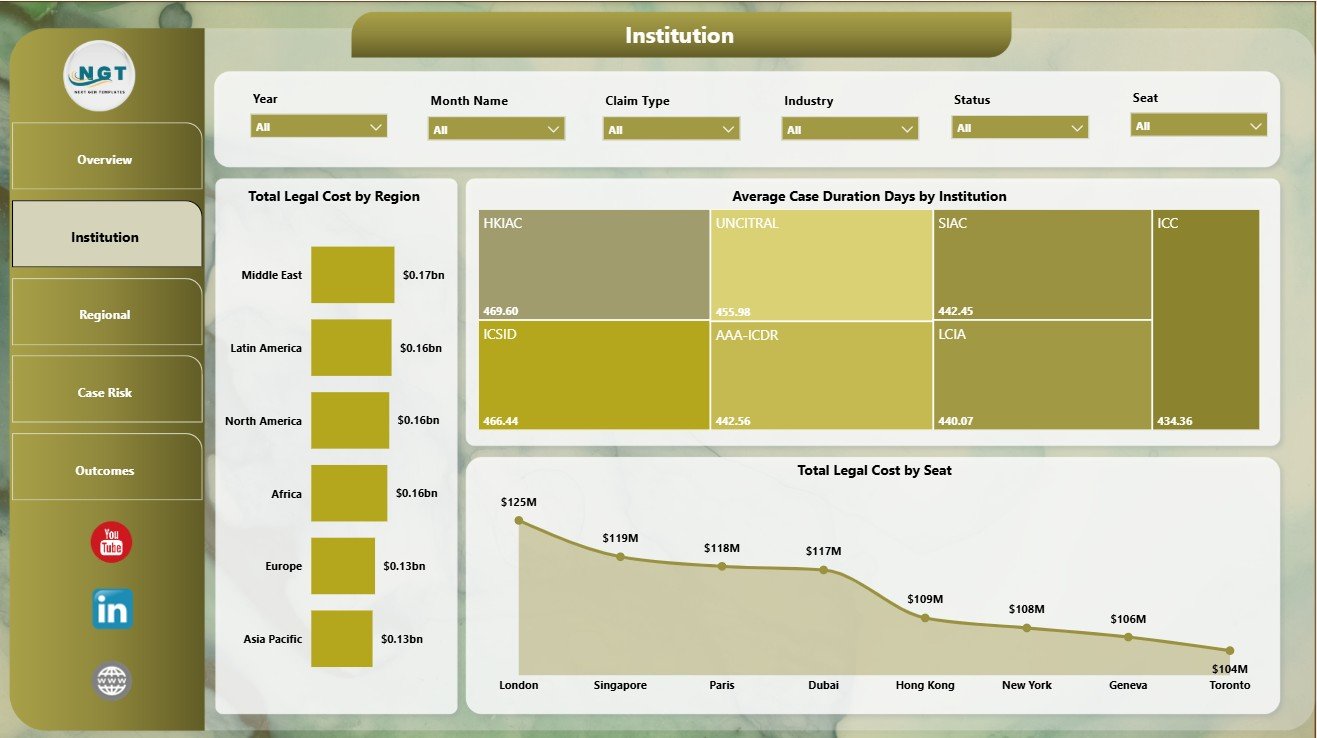
2. Institution
The Institution page focuses on institution-level performance, regional legal cost, case duration, and seat-level cost analysis.
Total Legal Cost by Region: This chart compares legal spend across regions. It helps legal and finance teams find where arbitration work is creating the highest cost pressure.
Average Case Duration Days by Institution: This visual compares average duration by institution. It helps users identify institutions where matters tend to close faster or take longer.
Total Legal Cost by Seat: This chart ranks arbitration seats by total legal cost. It supports budget review and seat-level planning for future matters.
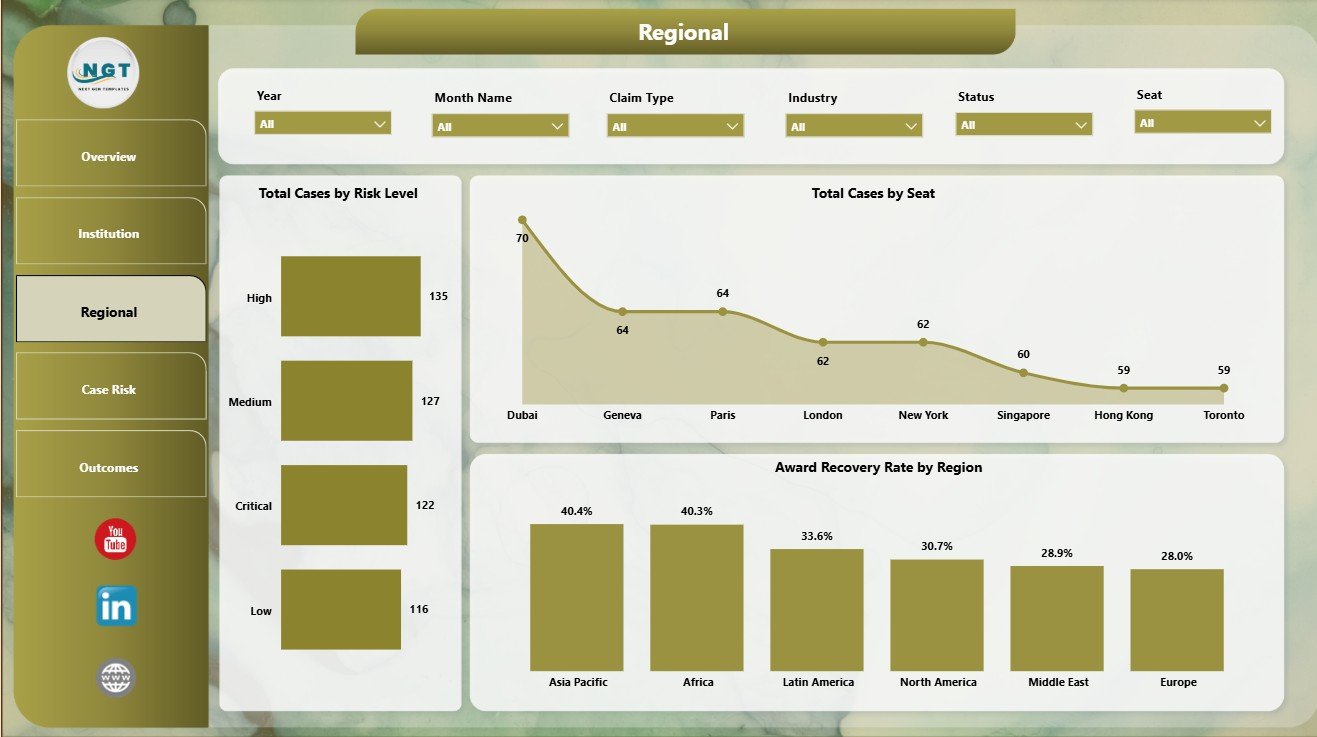
3. Regional
The Regional page gives users a location-based view of risk, seat concentration, and award recovery performance.
Total Cases by Risk Level: This chart groups arbitration cases by risk level. It helps managers see whether high-risk matters are concentrated in the current portfolio.
Total Cases by Seat: This visual compares case volume by arbitration seat. It helps identify which seats are used most often.
Award Recovery Rate by Region: This chart compares recovery performance by region. It helps users understand where awarded value is stronger or weaker against claim value.
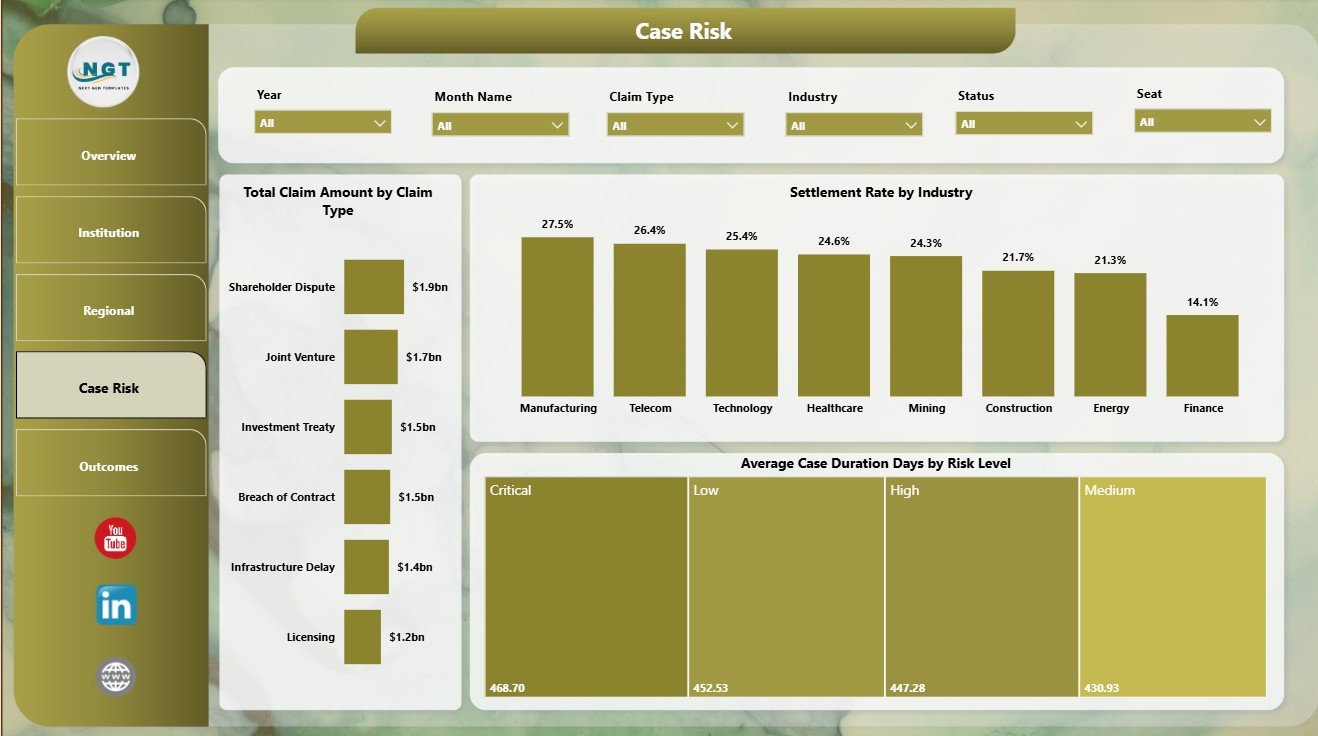
4. Case Risk
The Case Risk page is useful for reviewing claim exposure, settlement behavior, and duration by risk level.
Total Claim Amount by Claim Type: This chart shows financial exposure by claim category. It helps users identify which dispute types carry the highest claim value.
Settlement Rate by Industry: This visual compares settlement performance across industries. It helps teams see where negotiated outcomes are more common.
Average Case Duration Days by Risk Level: This chart compares average case duration across risk bands. It helps teams understand whether higher-risk matters also take longer to resolve.
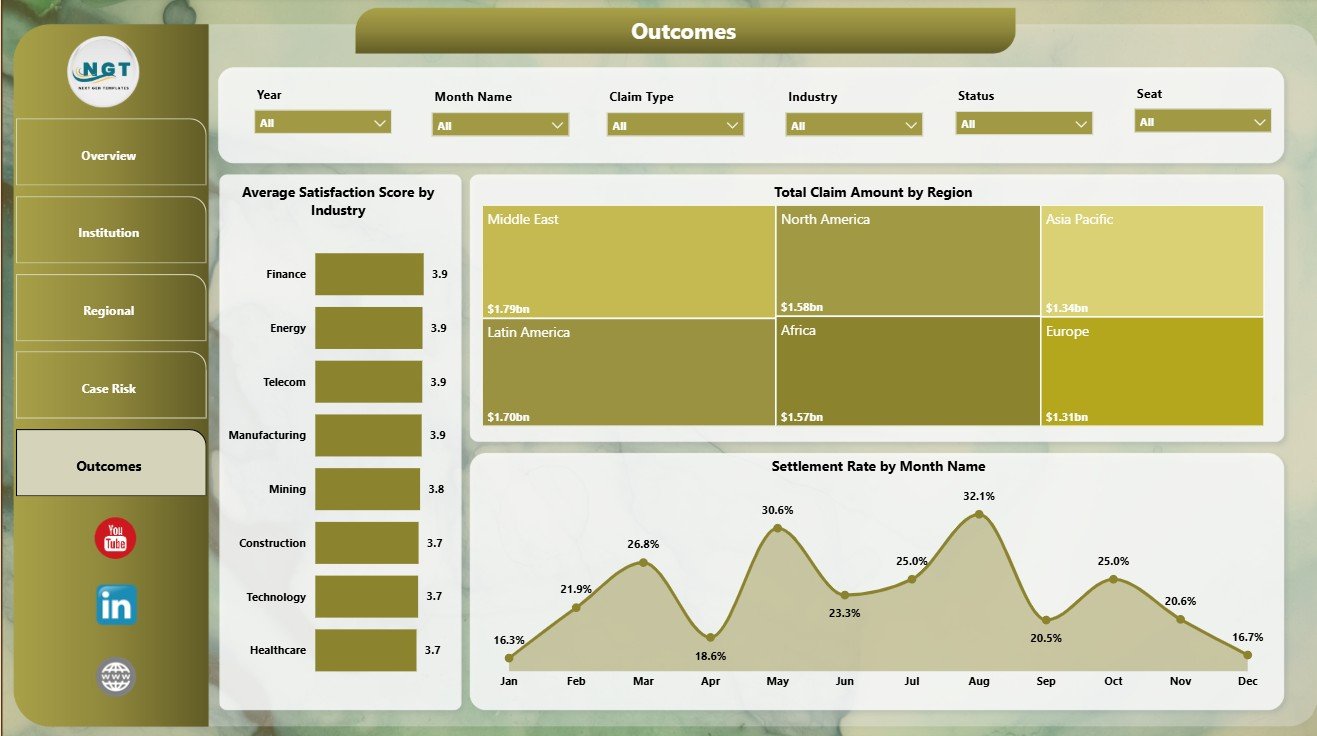
5. Outcomes
The Outcomes page connects satisfaction, claim value, region, and monthly settlement behavior.
Average Satisfaction Score by Industry: This chart compares satisfaction by industry. It helps users identify industry segments where experience or outcome quality may need attention.
Total Claim Amount by Region: This visual shows claim value by region. It helps teams see where the largest arbitration exposure is located.
Settlement Rate by Month Name: This trend tracks settlement rate by month. It helps users identify periods where settlement activity increased, slowed, or shifted from normal patterns.
International Arbitration Panels Dashboard in Power BI vs. Tableau vs. Paid CRM/SaaS – Feature Comparison
| Feature | International Arbitration Panels Dashboard in Power BI | Tableau alternative | Paid legal SaaS |
|---|---|---|---|
| Cost | $17.99 one-time | Template cost, license cost, or custom build | Monthly or annual subscription |
| Platform | Microsoft Power BI Desktop | Tableau Desktop or Tableau Cloud | Vendor cloud platform |
| Setup time | Open PBIX, replace or connect data, refresh | Build or adapt reports | Implementation and onboarding |
| Real-time team collaboration | Available after publishing to Power BI Service | Available through Tableau Cloud or Server | Usually included by plan |
| Mobile access | Power BI mobile or browser after publishing | Tableau mobile or browser | Vendor app or browser |
| Customizable fields | Editable pages, visuals, model, and measures | Editable workbook and data source | Often limited by vendor settings |
| Year-1 cost at 5 users | $17.99 plus Power BI licensing if publishing is needed | Often higher license or development cost | Often hundreds or thousands |
| Arbitration analytics | Built-in views for claims, awards, cost, institution, region, seat, risk, recovery, settlement, and outcomes | Requires setup or adaptation | Depends on module and plan |
Who Should Use This Template
This dashboard is useful for arbitration law firms, dispute resolution teams, case administrators, legal operations teams, finance analysts, corporate legal departments, arbitration consultants, and practice leaders who need a practical Power BI reporting layer for arbitration portfolios.
It is not a full legal practice management system, e-filing system, document repository, hearing calendar, billing system, or client portal. It works best when your team already has structured arbitration data and wants a visual report for recurring review.
Real-World Use Cases
Priya, Finance Analyst: She reviews claim amount, award amount, legal cost, and recovery rate before preparing monthly arbitration portfolio notes.
Daniel, Legal Operations Manager: He uses Institution and Regional pages to compare duration, seat cost, risk level, and regional concentration.
Anita, Arbitration Partner: She uses the Outcomes page to review settlement rate, satisfaction score, and claim exposure before leadership meetings.
Advantages of International Arbitration Panels Dashboard in Power BI
- Faster recurring reporting: Prebuilt cards, charts, pages, and slicers reduce manual report preparation.
- Interactive filtering: Slicers allow users to narrow arbitration views during review meetings.
- Power BI native: The PBIX file can be edited, refreshed, and published using the Microsoft Power BI ecosystem.
- Focused arbitration metrics: The dashboard covers cost, claims, awards, recovery, settlement, duration, risk, and outcomes.
Opportunities for Improvement
This is a reporting template, not a live arbitration management application. It does not collect filings, store evidence, send reminders, manage permissions, automate hearing workflows, or replace billing tools. Teams can improve it further by adding Power Query cleanup steps, custom DAX measures, additional slicers, row-level security, or organization-specific risk scoring.
Best Practices
- Keep institution, region, seat, status, risk level, claim type, industry, and month names consistent.
- Refresh the report after every major data update.
- Validate totals after connecting your own source data.
- Use slicers during meetings instead of creating many duplicate report pages.
- Publish to Power BI Service only after reviewing access and sharing permissions.
Explore Relevant Templates
- International Arbitration Panels Dashboard in Power BI – the template covered in this article.
- International Arbitration Panels Dashboard in Excel – Excel version for spreadsheet users.
- Intellectual Property Law Firms Dashboard in Excel – IP legal analytics in Excel.
- Employment Law Services Dashboard in Excel – employment law case reporting.
- Browse Power BI dashboard templates.
Frequently Asked Questions
What does the International Arbitration Panels Dashboard in Power BI track?
It tracks legal cost, claim amount, award amount, total cases, settlement count, institution, region, seat, status, risk level, claim type, industry, duration, satisfaction score, award recovery rate, and settlement rate.
Do I need Power BI Desktop?
Yes. The PBIX file is designed to open in Microsoft Power BI Desktop for editing, refreshing, and customization.
Can I replace the sample data?
Yes. Replace or connect your own structured arbitration records, then refresh the report and validate cards, charts, and slicers.
Can I customize the dashboard?
Yes. You can edit pages, visuals, measures, fields, labels, colors, filters, and the model inside Power BI.
Is this a full arbitration management system?
No. It is a reporting dashboard template. It does not replace case management, e-filing, document storage, reminders, billing, or client communication tools.
Is this a one-time purchase?
Yes. The dashboard is sold as a one-time downloadable Power BI template from NextGenTemplates.
About the Author
Built by PK – Microsoft Certified Professional with 15+ years of Excel, Google Sheets, and Power BI experience. Founder of NextGenTemplates, reaching 300K+ subscribers across YouTube channels. Every template is hand-built and tested before release.
Conclusion
The International Arbitration Panels Dashboard in Power BI gives arbitration teams a practical way to review legal costs, claims, awards, cases, institutions, regions, seats, risks, recovery, settlements, and outcomes without building a report from scratch.
Use it when you need a clear Power BI report for arbitration portfolio review, legal operations reporting, finance analysis, institution comparison, and outcome tracking. Visit YouTube.com/@PKAnExcelExpert for step-by-step Excel and Power BI tutorials.