Clinical Trials Management Dashboard in Excel is a ready-to-use, interactive analytics template designed for pharmaceutical companies, contract research organizations (CROs), and healthcare research teams who need a centralized way to track trial performance, budgets, enrollment, adverse events, and compliance. In the clinical research industry, managing massive volumes of trial data across disconnected spreadsheets leads to slow decision-making, missed compliance deadlines, and budget overruns. This professionally structured Clinical Trials Management Dashboard in Excel solves that challenge by bringing your most important trial metrics into one dynamic, visually rich workbook that updates automatically with your data.
This Excel dashboard template includes 5 interactive dashboard pages, a data input sheet, and a support sheet with pivot tables that power all charts. It tracks Total Budget, Total Actual Cost, Total Enrolled, Total Adverse Events, and Total Records across therapeutic areas, trial phases, sponsors, site locations, countries, and months. Whether you manage oncology trials, vaccine research, or multi-center international studies, this template gives you full analytical control over your clinical data without needing Power BI or any advanced BI tools.
👉 Click here to Purchase Clinical Trials Management Dashboard in Excel
Key Features of Clinical Trials Management Dashboard in Excel
This dashboard offers a comprehensive set of features built specifically for clinical trial data management and analysis. Here is what makes it stand out:
📊 5 Interactive Dashboard Pages — The template includes Overview, Trial Analysis, Site Performance, Sponsor Review, and Timeline Trends pages, each designed to answer specific clinical trial management questions through clear charts and visual summaries.
📈 Dynamic KPI Cards on Overview Page — The Overview page displays 5 high-level KPI cards for Total Budget, Total Actual Cost, Total Enrolled, Total Adverse Events, and Total Records so that managers can assess overall trial health instantly.
🎛️ Slicer-Based Filtering Across All Pages — Every dashboard page includes slicers connected to key dimensions like therapeutic area, trial phase, sponsor, and site location, enabling real-time filtering without modifying any formulas.
🔄 Fully Automated with Pivot Tables — All charts and cards are powered by pivot tables on the hidden Support Sheet. After updating data, a single click on Refresh All updates the entire dashboard.
💰 Budget vs Actual Cost Comparison — Dedicated charts compare Total Budget against Total Actual Cost by therapeutic area and site location, helping finance teams identify overspending and optimize allocation.
🌍 Multi-Dimensional Analysis — Analyze clinical trial data across therapeutic areas, phases, sponsors, countries, site locations, and months for a complete operational picture.
⚡ No VBA, No Macros — The entire dashboard runs on standard Excel pivot tables, slicers, and charts, ensuring compatibility with Excel 2016, 2019, 2021, and Microsoft 365.
Dashboard Pages Explained
1. Overview Page
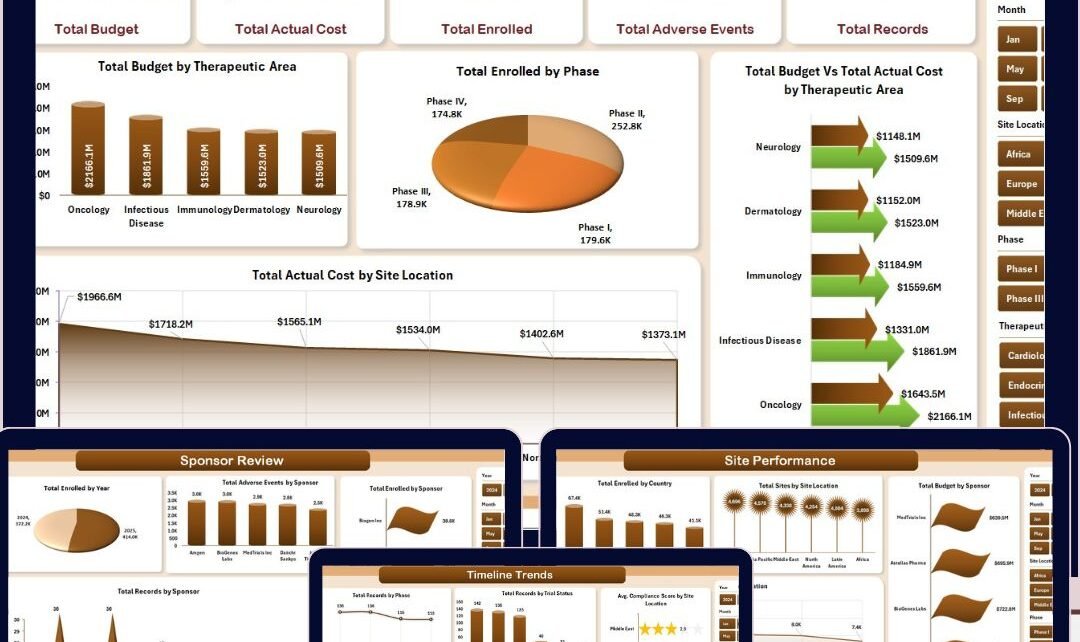
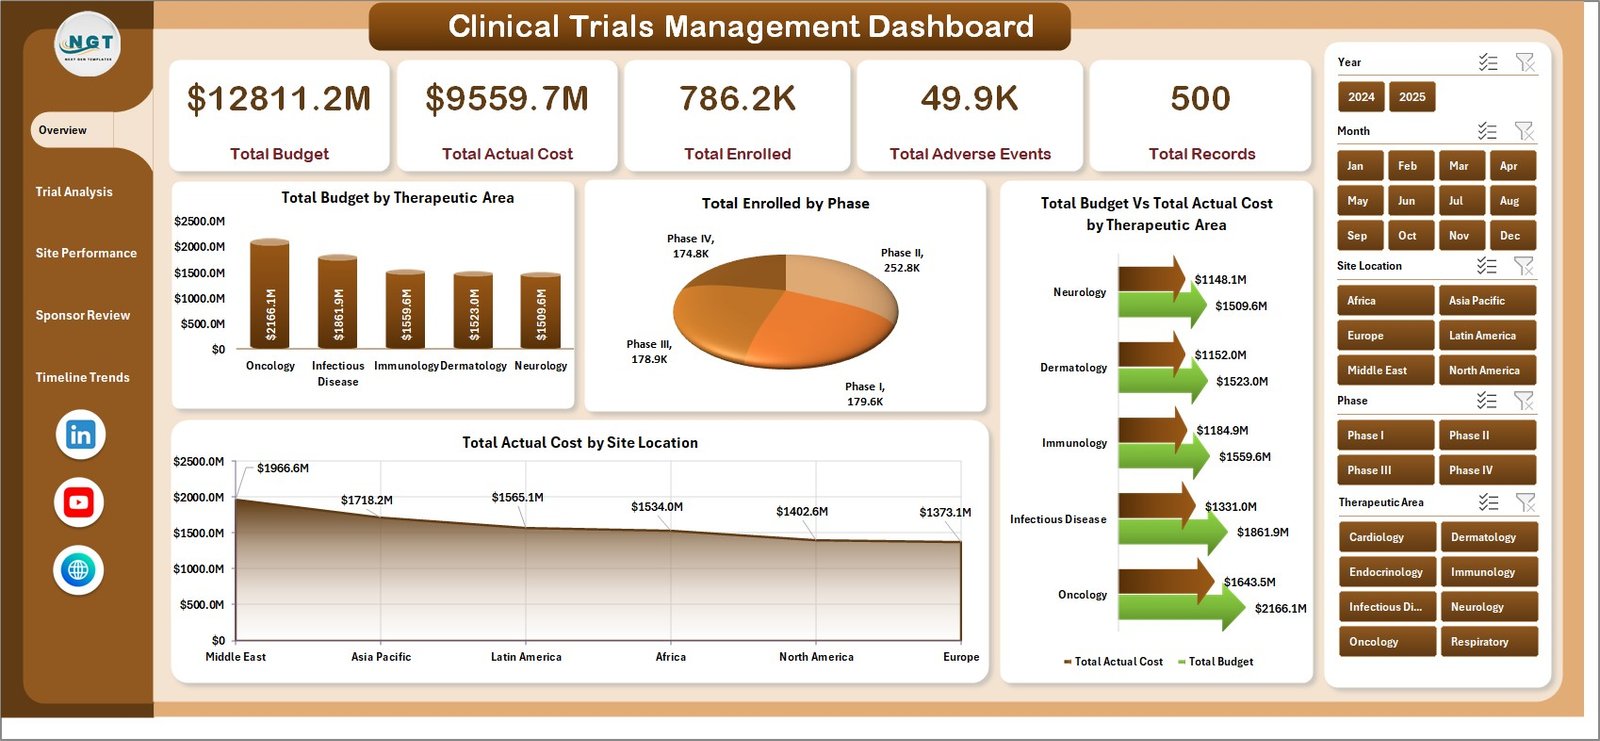
The Overview Page serves as the main command center of the Clinical Trials Management Dashboard in Excel. At the top, you will find 5 KPI summary cards displaying Total Budget, Total Actual Cost, Total Enrolled, Total Adverse Events, and Total Records. These cards provide a quick snapshot of your entire clinical trial portfolio.
Below the cards, the page includes 4 analytical charts: Total Budget by Therapeutic Area shows how trial funding is distributed across different research areas. Total Enrolled by Phase reveals patient enrollment distribution across Phase I, II, III, and IV trials. Total Budget vs Total Actual Cost by Therapeutic Area highlights where spending deviates from planned budgets. Total Actual Cost by Site Location compares actual expenses across different research sites. Multiple slicers on this page allow users to filter the entire dashboard by therapeutic area, phase, sponsor, site location, and more.
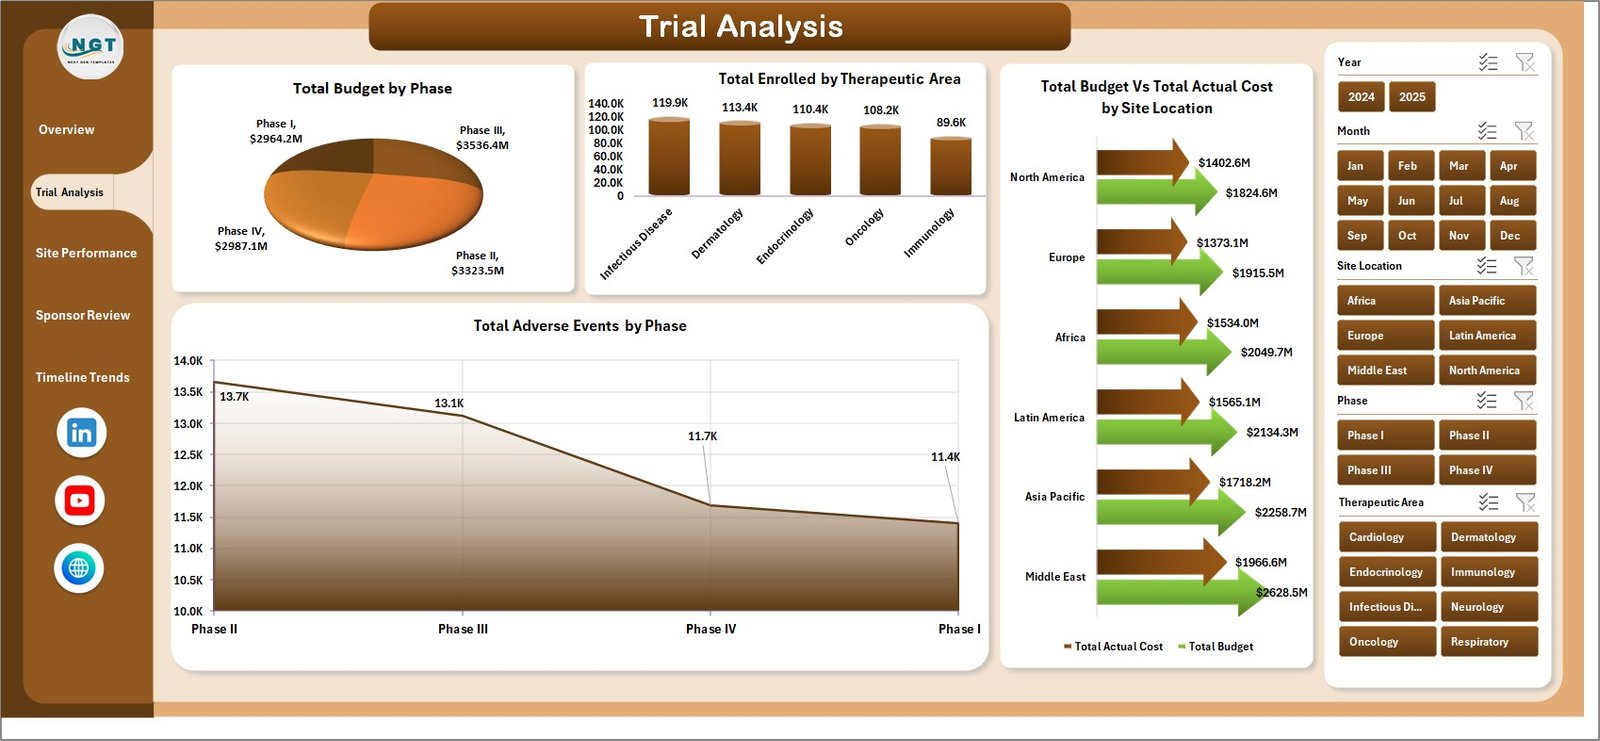
Clinical Trials Management Dashboard2. Trial Analysis Page
The Trial Analysis page provides deeper insights into trial-level performance. It includes 4 charts: Total Budget by Phase breaks down how much budget is allocated to each trial phase. Total Enrolled by Therapeutic Area shows enrollment volumes across different research categories. Total Budget vs Total Actual Cost by Site Location helps identify which sites are overspending or underspending relative to their budgets. Total Adverse Events by Phase reveals which trial phases are experiencing the highest adverse event counts, supporting risk management decisions.
 Trial Analysis Page
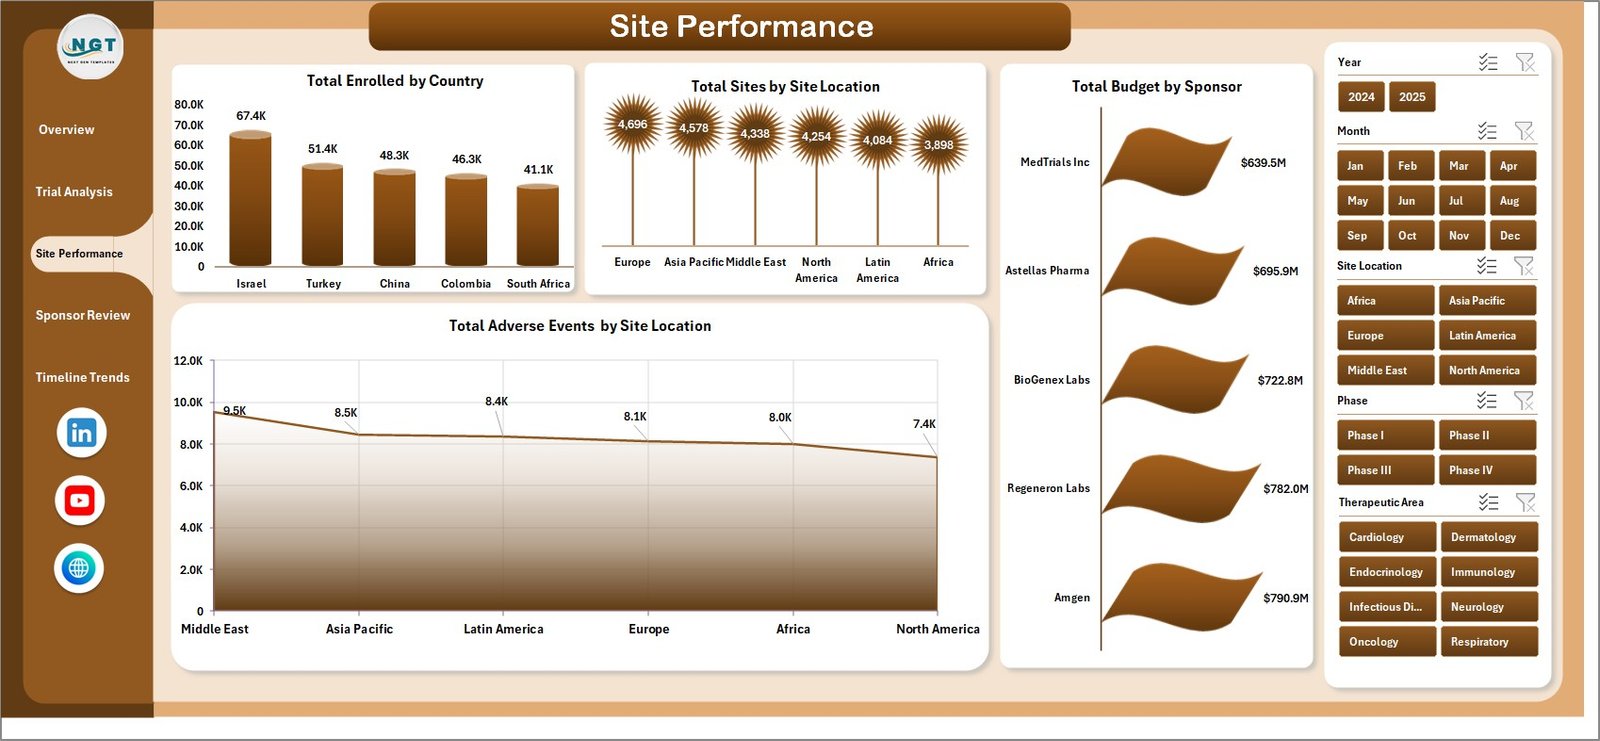
3. Site Performance Page
The Site Performance page focuses on location-based analysis for multi-site clinical trial managers. It features 4 charts: Total Enrolled by Country provides a geographic view of patient enrollment across international research centers. Total Sites by Site Location shows the distribution of active trial sites. Total Budget by Sponsor reveals how budgets are allocated across different sponsoring organizations. Total Adverse Events by Site Location helps identify which research facilities have higher safety incident rates.
👉 Click here to Purchase Clinical Trials Management Dashboard in Excel
 Site Performance Page
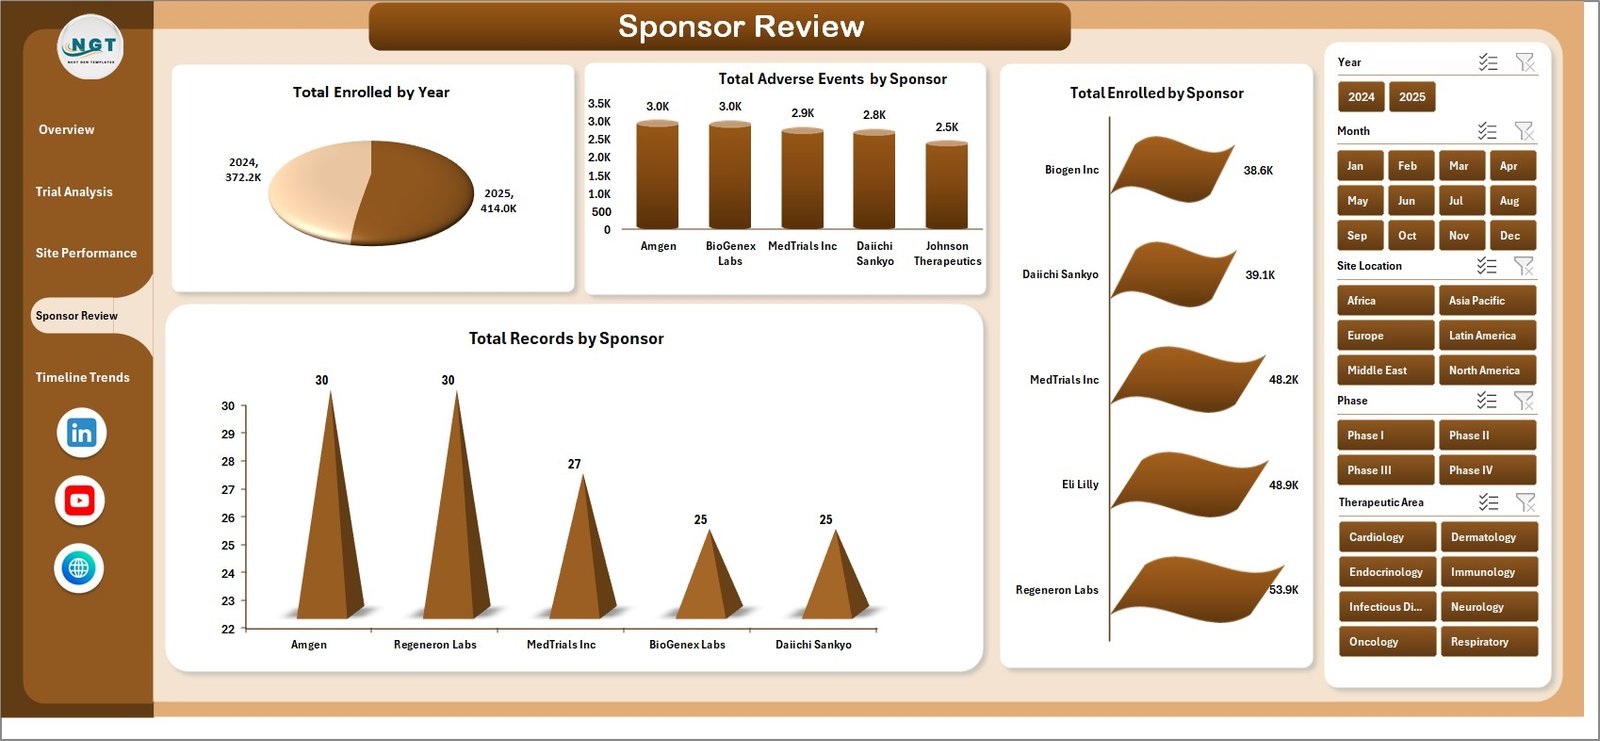
4. Sponsor Review Page
The Sponsor Review page delivers sponsor-level analytics for organizations managing trials across multiple sponsors. It includes 4 charts: Total Enrolled by Year tracks enrollment trends over time. Total Adverse Events by Sponsor compares safety profiles across sponsors. Total Enrolled by Sponsor shows enrollment contribution from each sponsor. Total Records by Sponsor provides a volume overview of trial records managed per sponsor. This page is essential for CROs and multi-sponsor research organizations.
 Sponsor Review Page
5. Timeline Trends Page
The Timeline Trends page monitors time-based patterns and compliance metrics. It features 4 charts: Total Records by Phase shows the volume of trial records across different phases. Total Records by Trial Status reveals the distribution of active, completed, and pending trials. Avg. Compliance Score by Site Location helps quality teams identify sites with lower compliance scores. Total Budget by Month tracks monthly budget allocation trends for forecasting and planning purposes.
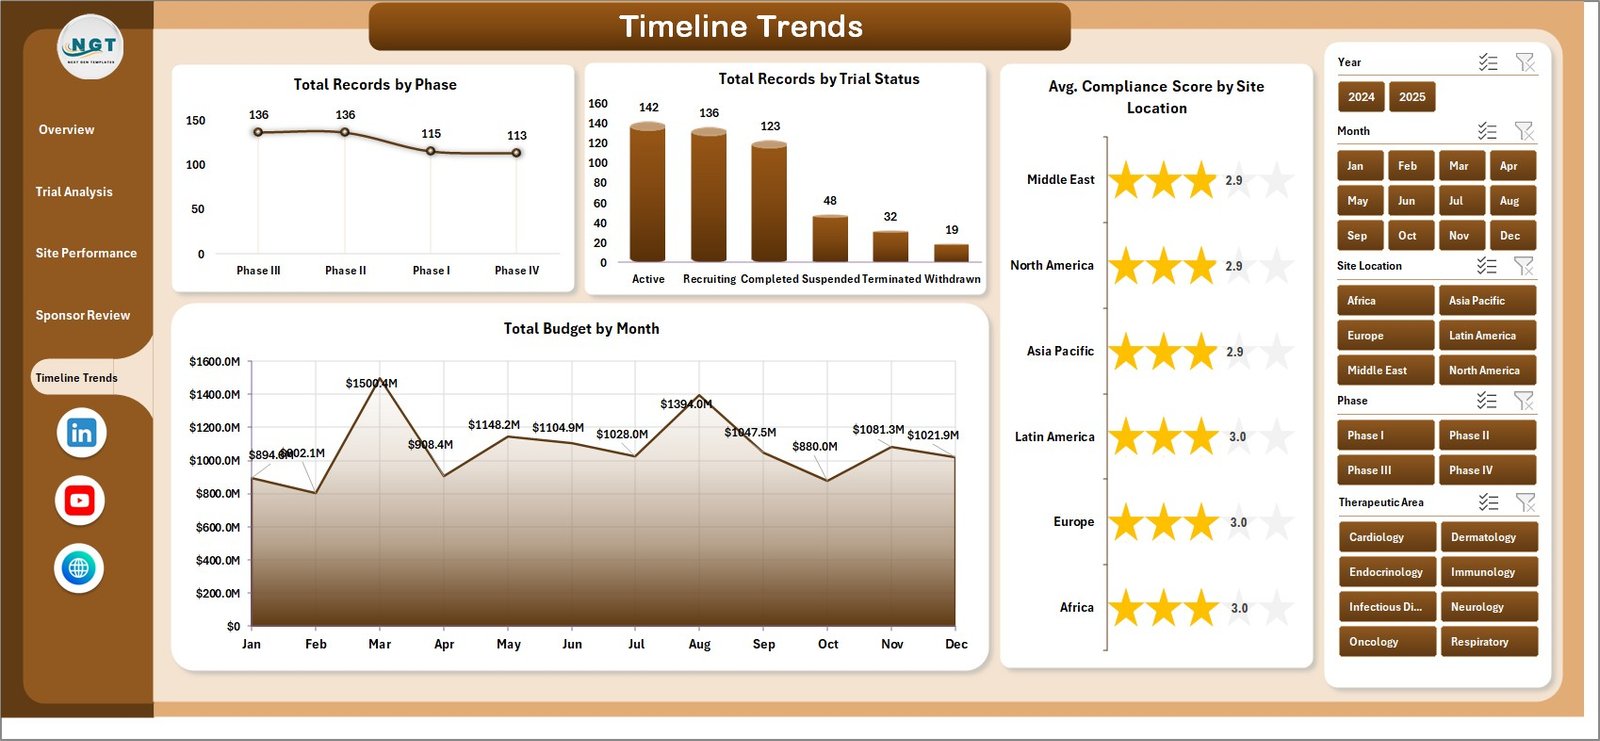 Timeline Trends Page
6. Data Sheet
The Data Sheet is where all your raw clinical trial data is entered. It includes structured columns for trial ID, therapeutic area, phase, sponsor, site location, country, budget, actual cost, enrolled count, adverse events, compliance score, trial status, and date fields. Simply replace the sample data with your own records in the same format. The dashboard reads directly from this sheet and all charts update automatically after refreshing pivot tables.
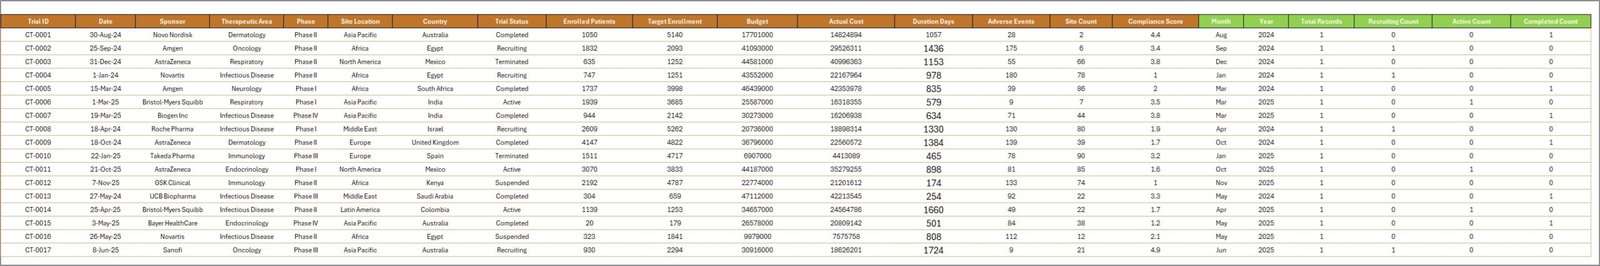 Data Sheet Tab
7. Support Sheet
The Support Sheet contains multiple pivot tables that power the entire dashboard dynamically. Each pivot table feeds one or more charts across the 5 dashboard pages. After updating your data in the Data Sheet, go to the Data tab in the Excel ribbon and click Refresh All. All pivots will refresh and all charts will update automatically. You can keep this sheet hidden for a cleaner dashboard experience.
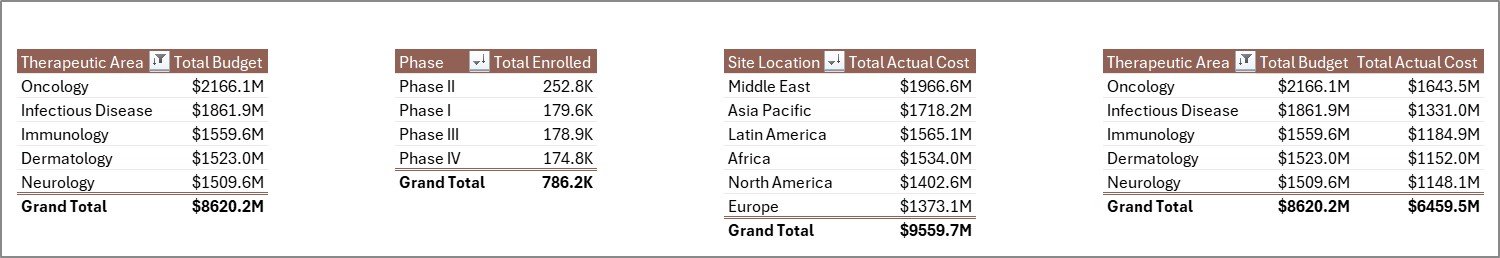 Support Sheet Tab
Advantages of Clinical Trials Management Dashboard in Excel
This dashboard provides several practical advantages for clinical trial management teams:
- Centralized Trial Reporting — All trial metrics, KPIs, and charts are consolidated in one Excel workbook, eliminating the need to switch between multiple files and systems.
- Real-Time Budget Control — The Budget vs Actual Cost comparisons across therapeutic areas and site locations help finance teams catch overspending early and reallocate resources effectively.
- Faster Decision-Making — Interactive slicers and dynamic charts allow managers to filter and analyze data in seconds rather than spending hours building manual reports.
- Multi-Site Visibility — The Site Performance page gives trial managers a clear view of enrollment, adverse events, and budget distribution across research centers in different countries.
- No Special Software Needed — Unlike Power BI or Tableau dashboards, this template works entirely within Microsoft Excel, making it accessible to anyone with basic Excel knowledge.
- Compliance Monitoring — The Timeline Trends page tracks average compliance scores by site location, helping quality teams proactively address compliance gaps before they become issues.
Opportunities for Improvement
While this dashboard covers a wide range of clinical trial metrics, there are areas where users might want to extend its capabilities:
- Patient-Level Tracking — The current dashboard works at an aggregate level. Organizations tracking individual patient journeys could add a supplementary patient tracking sheet.
- Regulatory Milestone Tracking — Adding a dedicated regulatory timeline with submission deadlines, approval dates, and audit schedules would enhance compliance oversight.
- Automated Data Import — For organizations with large datasets, integrating Power Query to pull data from external sources or databases would reduce manual data entry effort.
- Risk Scoring Models — Adding calculated risk scores based on adverse event rates, compliance scores, and budget variance could help prioritize management attention.
Best Practices for Using the Clinical Trials Management Dashboard
- ✅ Update the Data Sheet with fresh trial records at least weekly to keep the dashboard current and actionable.
- ✅ Always click Refresh All in the Data tab after updating records to ensure all pivot tables and charts reflect the latest data.
- ✅ Use the slicers to create focused views during management meetings instead of switching between multiple reports.
- ✅ Keep the Support Sheet hidden to maintain a clean dashboard experience for non-technical stakeholders.
- ✅ Maintain consistent data formatting in the Data Sheet, especially for therapeutic area names, phase labels, and sponsor names, to ensure accurate pivot table grouping.
- ✅ Use conditional formatting on the Data Sheet to highlight records with high adverse event counts or budget overruns for quick visual identification.
- ✅ Back up your workbook regularly, especially before making structural changes to the pivot tables or chart layouts.
Explore Relevant Templates
If you are working in healthcare, pharmaceutical, or biotechnology research, you may also find these related templates valuable:
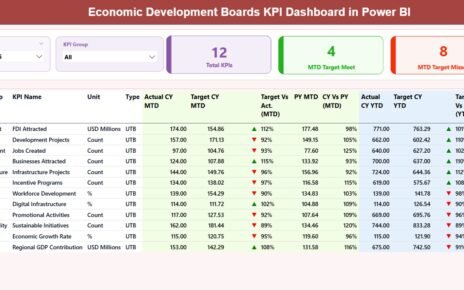
📌 Clinical Trials Management KPI Dashboard in Power BI — A KPI-focused dashboard for tracking clinical trial MTD and YTD performance with visual trend analysis in Power BI.
📌 Gene Therapy KPI Dashboard in Excel — Track gene therapy patient outcomes, genetic modifications, side effects, and treatment costs with this specialized Excel KPI dashboard.
📌 Neurology Hospitals KPI Dashboard in Power BI — Monitor neurology hospital performance, patient care quality, and departmental KPIs in a ready-to-use Power BI dashboard.
📌 Biotechnology Dashboard in Google Sheets — Analyze biotech R&D costs, clinical trial expenses, regulatory costs, and project approvals in Google Sheets.
📌 Biotechnology Report in Excel — A dynamic Excel reporting tool for biotech companies tracking R&D, approvals, and clinical trial costs.
👉 Click here to Purchase Clinical Trials Management Dashboard in Excel
Frequently Asked Questions
What is the best Excel template for tracking clinical trials?
The Clinical Trials Management Dashboard in Excel is one of the best templates for tracking clinical trials. It includes 5 interactive dashboard pages covering trial budgets, enrollment, adverse events, site performance, and sponsor analysis. All charts are powered by pivot tables and update automatically when you refresh the data.
How do I track clinical trial budgets and costs in Excel?
This dashboard includes dedicated Budget vs Actual Cost comparison charts on both the Overview and Trial Analysis pages. Enter your budget and actual cost data in the Data Sheet, click Refresh All, and the dashboard will show spending variances by therapeutic area, site location, and phase.
Can I use this dashboard for multi-site international clinical trials?
Yes. The Site Performance page includes Total Enrolled by Country and Total Sites by Site Location charts specifically designed for multi-site and international trial management. You can filter by country, site location, and sponsor using the built-in slicers.
Do I need advanced Excel skills to use the Clinical Trials Management Dashboard?
No. The dashboard is designed for ease of use. Simply replace the sample data in the Data Sheet with your own trial records and click Refresh All. All pivot tables, charts, and KPI cards update automatically. No VBA, macros, or complex formulas are required.
What metrics does this clinical trials dashboard track?
The dashboard tracks Total Budget, Total Actual Cost, Total Enrolled, Total Adverse Events, Total Records, Avg. Compliance Score, Trial Status distribution, and performance breakdowns by therapeutic area, phase, sponsor, site location, country, year, and month across 5 dashboard pages.
Is this template compatible with Microsoft 365 and older Excel versions?
Yes. The Clinical Trials Management Dashboard in Excel works with Microsoft Excel 2016, 2019, 2021, and Microsoft 365. It uses standard pivot tables, slicers, and charts that are supported across all modern Excel versions.
Conclusion
The Clinical Trials Management Dashboard in Excel is a practical, professional-grade analytics solution for anyone managing clinical trial data. With 5 interactive dashboard pages, dynamic KPI cards, slicer-based filtering, and fully automated pivot table calculations, this template transforms complex trial data into clear, actionable insights. Whether you are a clinical trial manager, pharmaceutical analyst, CRO professional, or healthcare researcher, this dashboard helps you monitor budgets, enrollment, adverse events, compliance, and sponsor performance from one centralized Excel workbook.
Stop struggling with disconnected spreadsheets and manual reports. Start making faster, smarter, data-driven decisions with this ready-to-use clinical trials dashboard today.
👉 Click here to Purchase Clinical Trials Management Dashboard in Excel
🎥 Visit our YouTube channel to learn step-by-step video tutorials
👉 Youtube.com/@PK-AnExcelExpert