Introduction
Adult Literacy Programs Dashboard in Excel is a comprehensive, ready-to-use analytics template designed for literacy organizations, adult education centers, NGOs, government education departments, and community development agencies that need to track program performance, monitor learner demographics, analyze funding efficiency, and evaluate outcome trends from one centralized Excel workbook. Whether you manage adult basic education, ESL programs, workplace literacy initiatives, or community reading circles, this Adult Literacy Programs Dashboard in Excel delivers the interactive visual insights you need to make faster, smarter, and more strategic decisions about your literacy initiatives.
Managing adult literacy programs involves tracking enrollment numbers, monitoring revenue and materials costs, evaluating funding sources, measuring learner satisfaction, and analyzing completion rates across multiple program types, literacy levels, regions, and demographics. Without a structured analytics tool, critical trends in program performance, learner engagement, and funding efficiency can go unnoticed. This Adult Literacy Programs Dashboard in Excel solves that challenge by providing 5 dedicated analysis pages, dynamic KPI cards, interactive charts with slicers, and a pivot-driven architecture that updates every visualization with a single click.
Click here to Purchase Adult Literacy Programs Dashboard in Excel
Key Features of Adult Literacy Programs Dashboard in Excel
This dashboard packs a robust set of features designed specifically for adult literacy program monitoring and educational analytics. The dashboard includes 5 interactive dashboard pages covering Overview, Program Analysis, Learner Demographics, Funding & Costs, and Outcomes & Trends. Dynamic KPI cards on the Overview page display Total Records, Total Revenue, Total Materials Cost, Net Funding Surplus, and Avg. Satisfaction for instant operational visibility.
Smart slicers and filters let you slice the data by program type, region, literacy level, gender, referral source, and more with one click. The entire dashboard is pivot-powered, which means all charts and cards are driven by pivot tables. Just update the Data Sheet and click Refresh All from the Data tab in the Excel Ribbon to update everything automatically. No VBA or macros are required, and it works with Microsoft Excel 2016 and newer versions.
Dashboard Pages Explanation
1. Overview Page
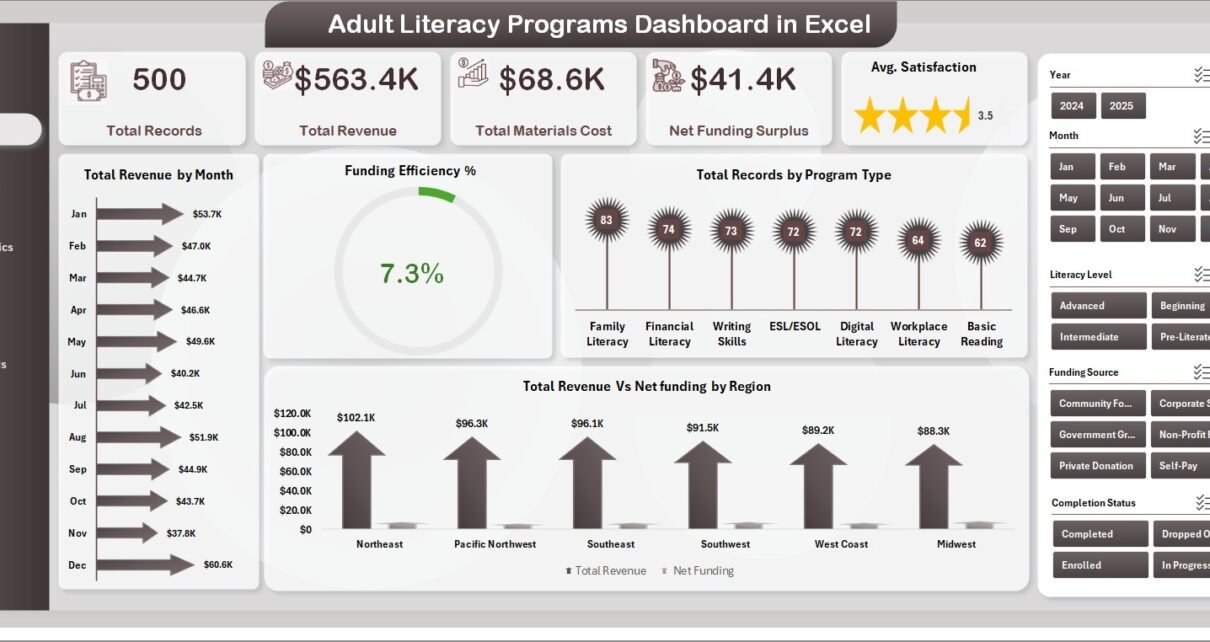
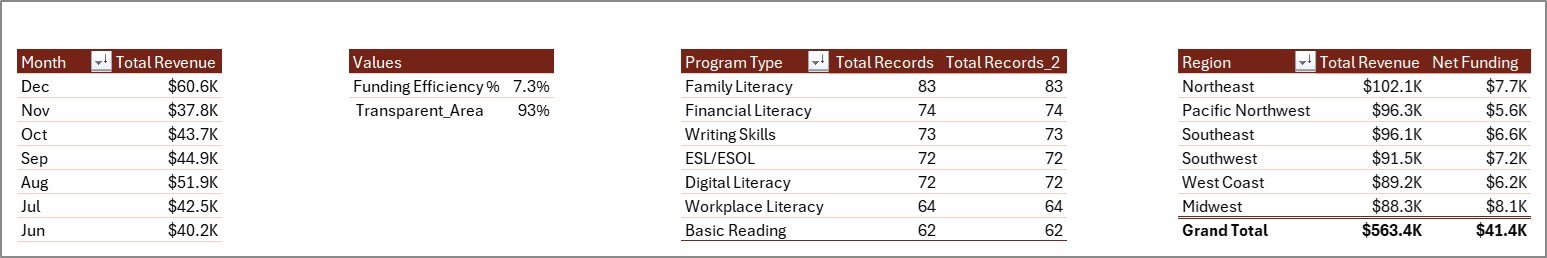
The Overview page is the command center of the Adult Literacy Programs Dashboard in Excel. On the top, KPI cards display high-level information including Total Records, Total Revenue, Total Materials Cost, Net Funding Surplus, and Avg. Satisfaction. Multiple slicers allow you to quickly filter the entire dashboard by various dimensions.
The charts on this page provide visual analysis through Total Revenue by Month which shows monthly revenue trends for budget planning and seasonal analysis. Funding Efficiency % measures how effectively programs convert funding into outcomes. Total Records by Program Type compares enrollment across different literacy program categories. Total Revenue vs Net Funding by Region identifies which regions generate the most revenue and retain the highest funding surplus.
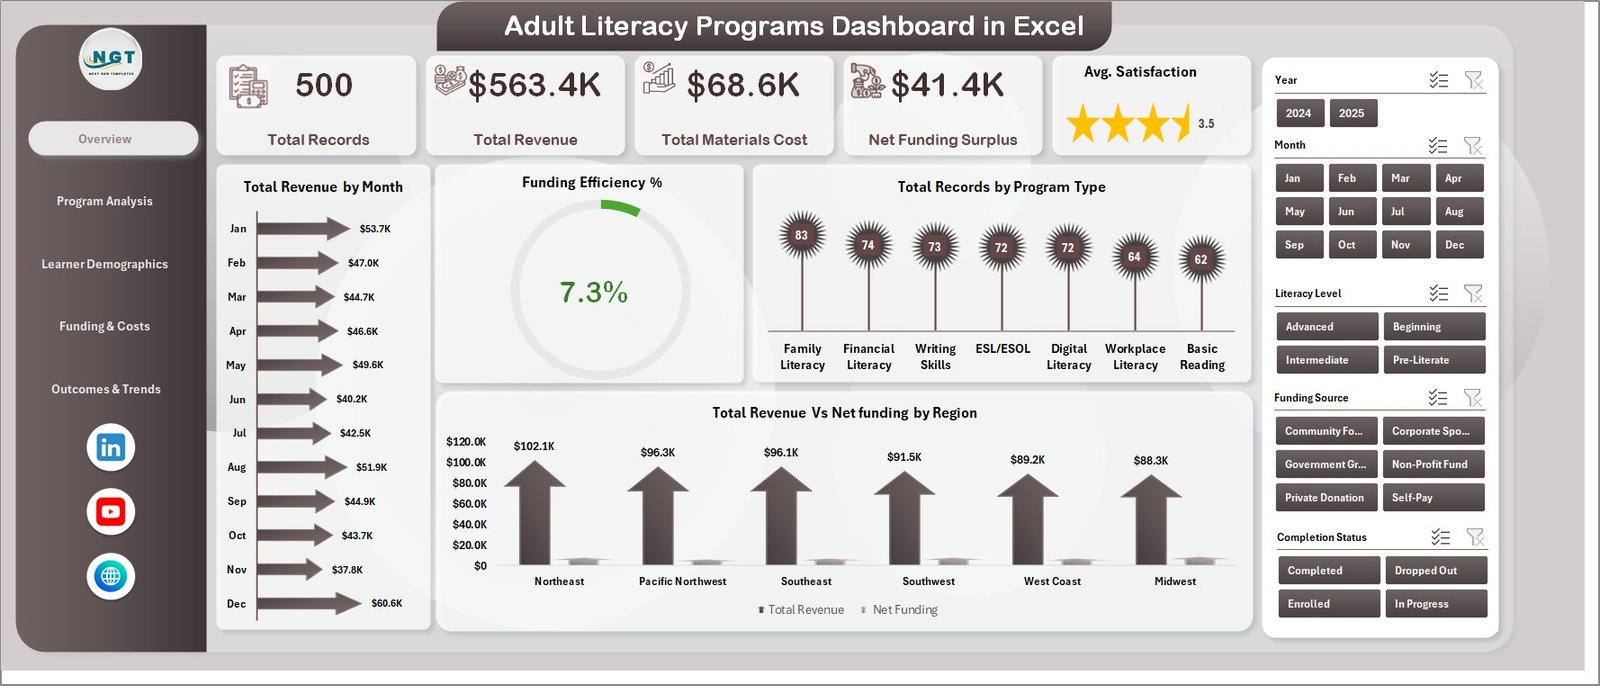
Adult Literacy Programs Dashboard in Excel
Click here to Purchase Adult Literacy Programs Dashboard in Excel
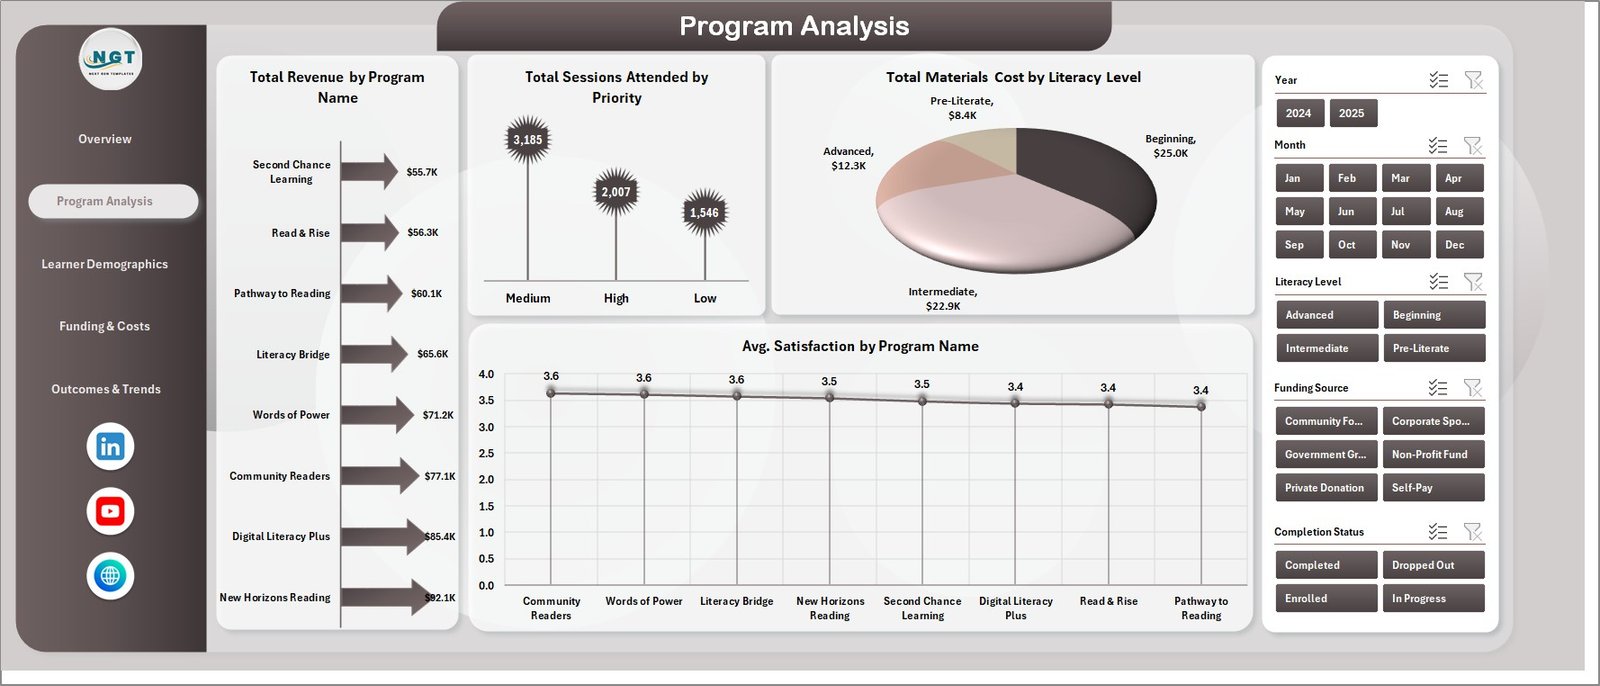
2. Program Analysis Page
In this sheet tab, deep dive into program-level metrics. Total Revenue by Program Name ranks revenue across individual programs to identify top performers. Total Sessions Attended by Priority highlights which priority levels drive the most learner attendance. Total Materials Cost by Literacy Level reveals spending patterns across beginner, intermediate, and advanced levels, helping organizations optimize resource allocation. Avg. Satisfaction by Program Name identifies which programs deliver the highest learner satisfaction scores.
Program Analysis
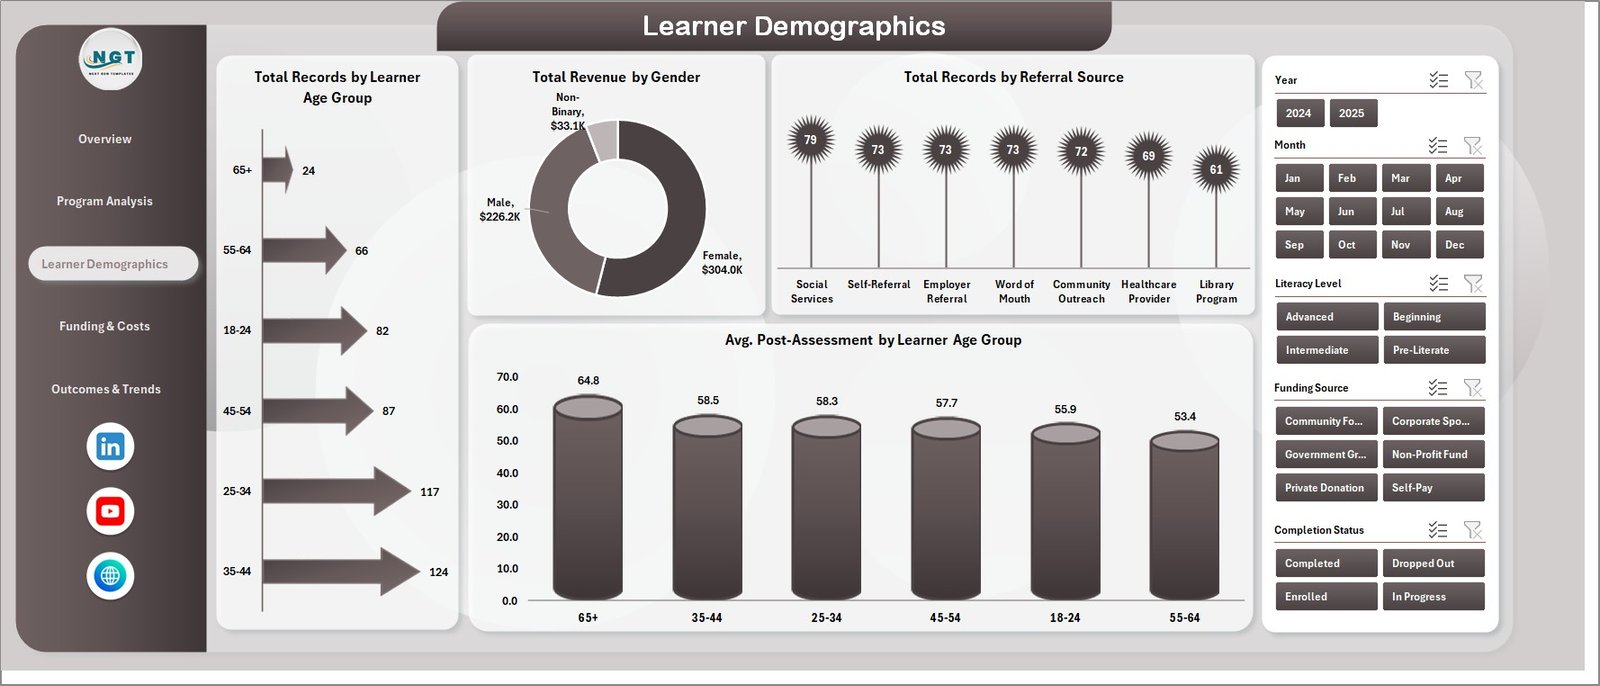
3. Learner Demographics Page
Understanding your learner population is critical for effective program design and outreach. Total Records by Learner Age Group shows enrollment distribution across age brackets, helping organizations identify which demographics they are reaching effectively. Total Revenue by Gender analyzes revenue contribution by gender for equity monitoring. Total Records by Referral Source tracks where learners come from, enabling better marketing and partnership strategies. Avg. Post-Assessment by Learner Age Group measures learning outcomes across different demographic groups, revealing which age segments show the strongest improvement.
Learner Demographics
Click here to Purchase Adult Literacy Programs Dashboard in Excel
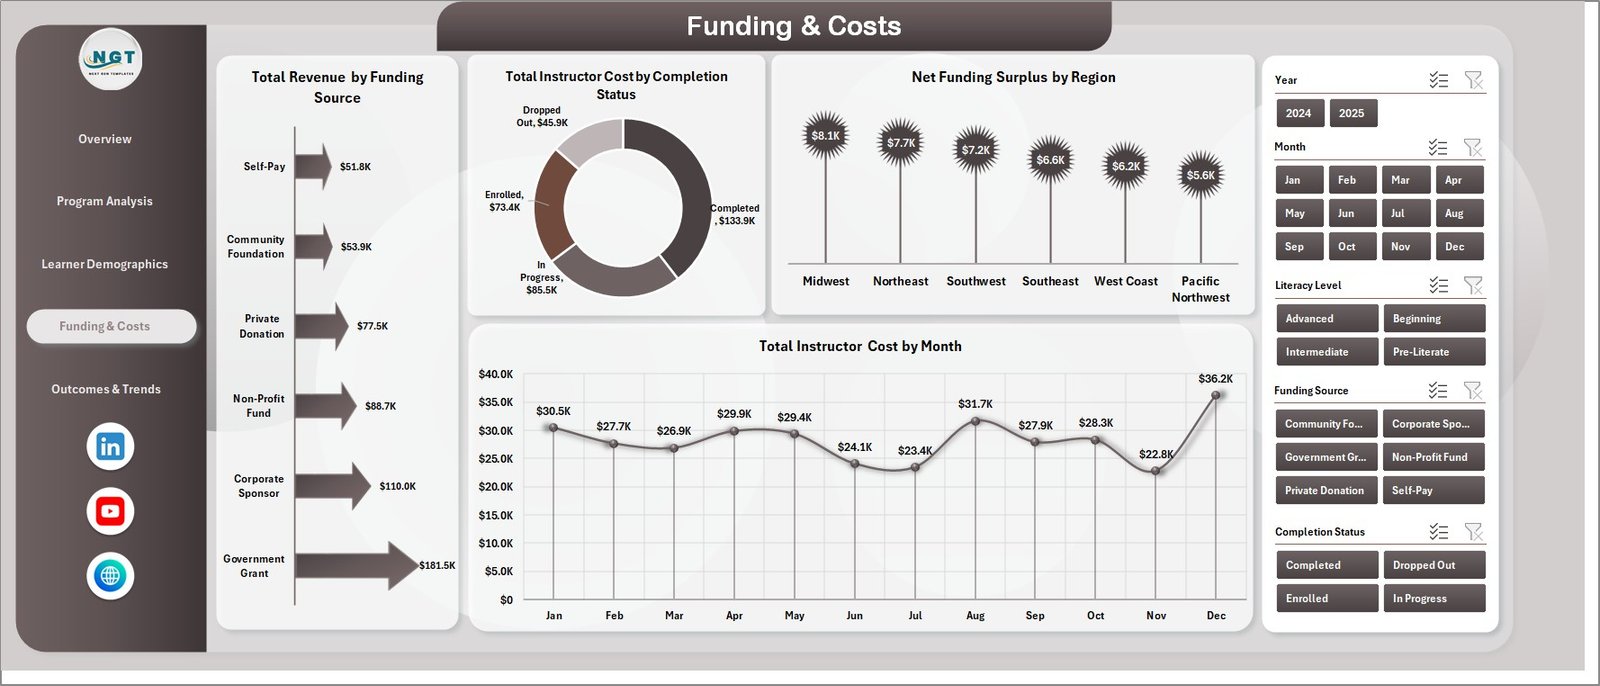
4. Funding & Costs Page
Monitor your program’s financial health comprehensively. Total Revenue by Funding Source shows which funding channels contribute most, whether it is government grants, corporate sponsorships, or individual donations. Total Instructor Cost by Completion Status compares costs across completed and ongoing programs to evaluate cost efficiency. Net Funding Surplus by Region highlights which geographic areas are financially self-sustaining. Total Instructor Cost by Month tracks cost trends over time to support budget forecasting.
Funding & Costs
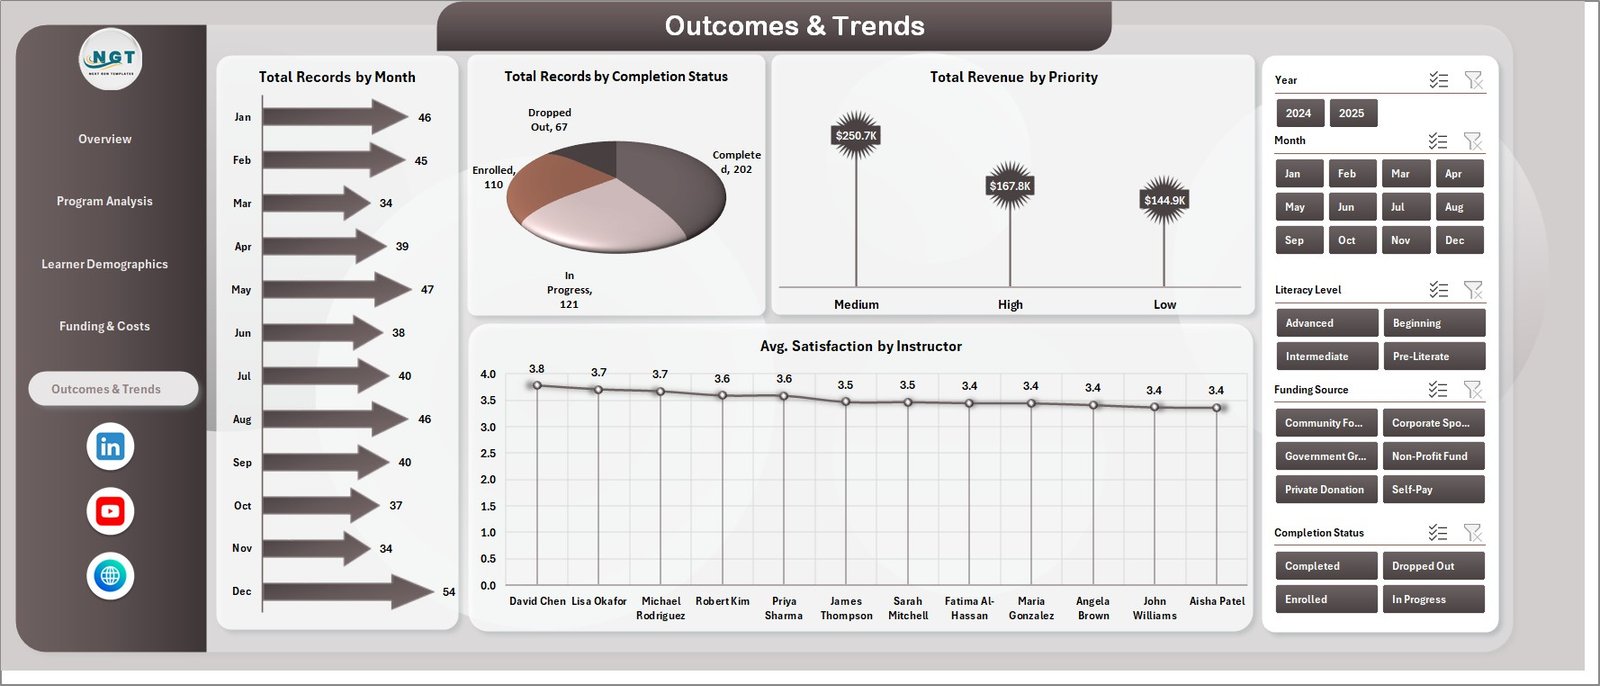
5. Outcomes & Trends Page
Evaluate program success and identify temporal patterns. Total Records by Month tracks enrollment trends over time, helping you identify peak enrollment periods and seasonal dips. Total Records by Completion Status measures completion versus dropout rates, which is essential for program effectiveness reporting. Total Revenue by Priority shows revenue distribution by priority level. Avg. Satisfaction by Instructor identifies top-performing instructors, enabling evidence-based staffing decisions.
Outcomes & Trends
6. Data Sheet Tab
This is the Data Sheet where you enter your program data in the structured format. Replace the sample data with your own records and keep the same column headers. The clean tabular layout supports all operational fields needed for comprehensive literacy program analytics.
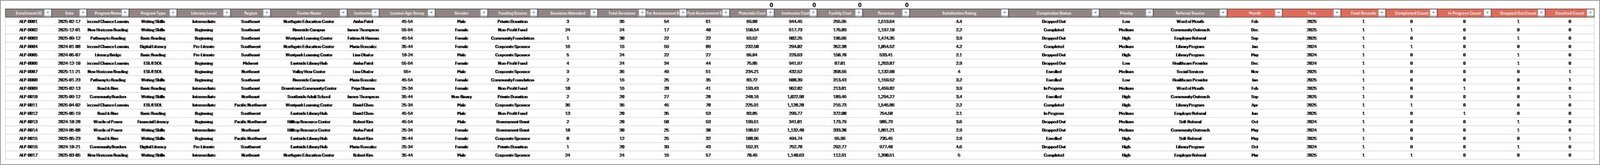
Data Sheet Tab
Click here to Purchase Adult Literacy Programs Dashboard in Excel
7. Support Sheet
In this sheet, multiple pivot tables power the entire dashboard dynamically. You can go to the Data tab in the Excel Ribbon and click on Refresh All after updating the data in the Data Sheet. All the pivots will be refreshed and all the charts will be refreshed. You can keep this sheet hidden during regular use.
Support Sheet Tab
Advantages of Adult Literacy Programs Dashboard in Excel
One of the biggest advantages of this dashboard is its centralized visibility into all aspects of adult literacy operations. Instead of reviewing separate reports for programs, learners, funding, and outcomes, you get everything consolidated into one workbook with five focused pages that cover every analytical angle.
The pivot-driven architecture eliminates the need for manual chart updates. Every time your data changes, a single Refresh All command propagates the updates across all pages, charts, and KPI cards. This drastically reduces reporting time and lets program managers focus on interpretation rather than data wrangling. The dashboard is built entirely with native Excel features including pivot tables, pivot charts, slicers, and conditional formatting, requiring no VBA or external dependencies.
Opportunities for Improvement
While the dashboard provides comprehensive analytics out of the box, users can extend its capabilities further. Adding real-time data connections through Power Query to external databases could enable automated data feeds from learning management systems. Organizations could also add data validation layers with dropdown lists to prevent entry errors. For organizations with access to Power BI, migrating the dashboard for cloud-based sharing and mobile accessibility is also a natural next step.
Best Practices
To get the most value from this dashboard, maintain consistent data entry standards in the Data Sheet. Use standardized program names, literacy levels, and region codes to ensure the pivot tables aggregate data accurately. Refresh the dashboard regularly by setting a routine to add new records and refresh all pivots. Leverage slicers for audience-specific views when presenting to different stakeholders. Protect the Support Sheet from accidental edits by hiding or protecting it, since the pivot tables in this sheet are the backbone of the dashboard.
Explore Relevant Templates
If you found this Adult Literacy Programs Dashboard in Excel useful, explore these related templates:
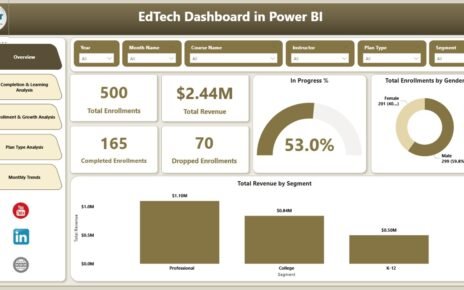
- Educational Nonprofits Dashboard in Power BI — Track nonprofit education performance with interactive Power BI analytics.
- Women Empowerment NGOs KPI Dashboard in Excel — Monitor NGO empowerment program KPIs with MTD, YTD, and target comparison.
- Rural Development KPI Dashboard in Excel — Track infrastructure, agriculture, and social development KPIs.
- Corporate Social Responsibility Report in Excel — Monitor CSR budgets, programs, and beneficiaries with interactive dashboards.
FAQs
What is the best Excel dashboard for tracking adult literacy programs?
The Adult Literacy Programs Dashboard in Excel is a ready-to-use template with 5 interactive pages covering Overview, Program Analysis, Learner Demographics, Funding & Costs, and Outcomes & Trends. It features dynamic KPI cards, pivot charts, and slicers designed to help literacy organizations monitor revenue, materials costs, funding efficiency, learner demographics, and program outcomes from one centralized workbook.
How do I track funding efficiency for literacy programs in Excel?
The Overview page of this dashboard includes a dedicated Funding Efficiency % chart that measures how effectively your programs convert funding into outcomes. The Funding & Costs page provides additional analysis including Total Revenue by Funding Source, Net Funding Surplus by Region, and Total Instructor Cost by Month for comprehensive financial monitoring.
Can I customize this dashboard for my specific literacy organization?
Yes. The dashboard is fully customizable. You can modify program types, regions, literacy levels, and other categories in the Data Sheet. The pivot tables in the Support Sheet will automatically reflect your changes after refreshing. No VBA or macros are required.
What Excel version do I need for this adult literacy dashboard?
This template works best with Microsoft Excel 2016 and newer versions including Excel for Microsoft 365. It uses pivot tables, pivot charts, slicers, and conditional formatting which are all native Excel features with no VBA dependencies.
Who should use an adult literacy programs dashboard?
This dashboard is ideal for adult education centers, literacy councils, government education departments, international NGOs, community colleges, continuing education programs, grant managers, funding coordinators, and instructors who need structured, visual analytics to track and improve adult literacy program performance.
How many learner records can this Excel dashboard handle?
The dashboard is designed to handle hundreds or even thousands of records efficiently. As long as your data follows the structured format in the Data Sheet, the pivot tables will aggregate and visualize the data without performance issues.
Conclusion
Click here to Purchase Adult Literacy Programs Dashboard in Excel
The Adult Literacy Programs Dashboard in Excel is a powerful, pivot-driven analytics template that transforms raw literacy program data into clear, actionable insights across 5 dedicated dashboard pages. Whether you are monitoring revenue and funding efficiency, analyzing learner demographics by age group and gender, evaluating program-level satisfaction scores, or tracking monthly enrollment and completion trends, this dashboard gives you everything you need in one professional Excel workbook.
Visit our YouTube channel for step-by-step video tutorials on Excel dashboards and templates: Youtube.com/@PK-AnExcelExpert