Digital Marketing Campaign Dashboard in Power BI is a comprehensive, interactive analytics template built for digital marketing managers, campaign strategists, advertising agencies, and growth marketers who want to monitor campaign spend, revenue, leads, impressions, conversions, and ROI from a single dynamic Power BI dashboard. This template includes 5 interactive dashboard pages covering Overview, Platform Analysis, Campaign Performance, Lead Analysis, and ROI Analysis — giving you 360-degree visibility into your entire digital marketing operation from one .pbix file.
Whether you manage social media advertising, PPC campaigns, email marketing, or multi-channel digital campaigns, this Power BI dashboard transforms raw marketing data into clear, visual, and actionable insights. Simply connect your data source, hit Refresh, and start analyzing instantly. If you prefer working in Excel, you can also check out the Digital Marketing Campaign Dashboard in Excel for pivot-powered analytics with slicers and charts.
Click here to Purchase the Digital Marketing Campaign Dashboard in Power BI
Key Features of Digital Marketing Campaign Dashboard in Power BI
Click here to Purchase the Digital Marketing Campaign Dashboard in Power BI
The Digital Marketing Campaign Dashboard in Power BI includes 5 interactive dashboard pages and tracks 5 key performance indicators: Total Spend, Total Revenue, Total Leads, Total Impressions, and Total Conversions. Here are the standout features that make this template essential for every marketing professional:
- 5 Interactive Dashboard Pages — Overview, Platform Analysis, Campaign Performance, Lead Analysis, and ROI Analysis deliver comprehensive marketing analytics from a single Power BI file.
- Dynamic KPI Cards — Instantly view Total Spend, Total Revenue, Total Leads, Total Impressions, and Total Conversions on the Overview page for a quick executive summary.
- Multiple Slicers and Filters — Apply dynamic filters to drill down by platform, campaign type, ad format, region, target audience, and time period.
- Revenue vs Spend Comparison — Compare Total Revenue and Total Spend by Platform to understand which advertising channels deliver the best returns.
- Click-Through Rate Analysis — Monitor CTR across platforms and campaigns to measure engagement effectiveness.
- Net Profit Tracking — The ROI Analysis page tracks Net Profit by Region and Net Profit by Manager for profitability insights.
- Instant Data Refresh — Update your data source and click Refresh in Power BI Desktop to see every chart update instantly.
- No Coding Required — Simply open the .pbix file, connect your data, and start analyzing.
Dashboard Pages Explanation
1 — Overview Page
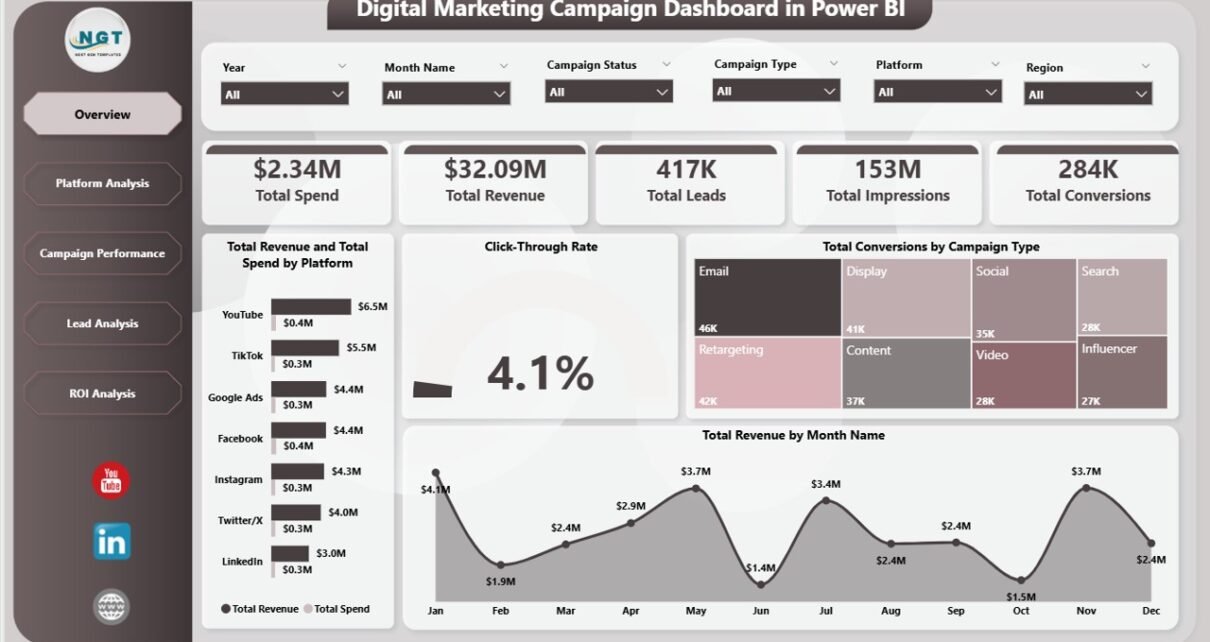
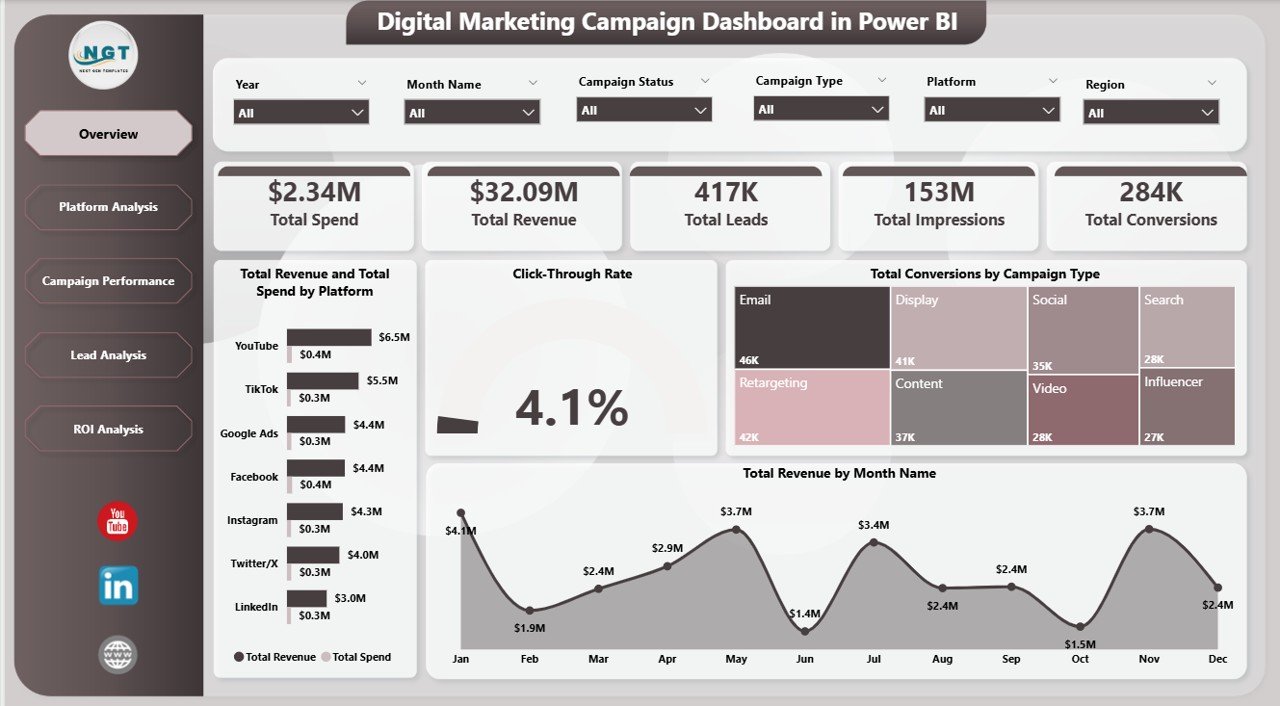
The Overview page is the central command center of the Digital Marketing Campaign Dashboard in Power BI. At the top, 5 KPI cards display Total Spend, Total Revenue, Total Leads, Total Impressions, and Total Conversions for an instant executive summary. Below the cards, interactive charts show Total Revenue and Total Spend by Platform comparing financial performance across advertising channels, Click-Through Rate analyzing engagement efficiency across campaigns, Total Conversions by Campaign Type revealing which campaign strategies drive the most conversions, and Total Revenue by Month Name tracking monthly revenue trends over time. Multiple slicers allow you to filter the entire page by platform, campaign type, ad format, region, and target audience.
Digital Marketing Campaign Dashboard in Power BI
2 — Platform Analysis
The Platform Analysis page provides a deep-dive into platform-level performance metrics. It features Total Revenue and Total Spend by Campaign Type analyzing cost-efficiency per campaign strategy, Total Revenue by Ad Format identifying which ad formats generate the most revenue, and Click-Through Rate by Platform comparing engagement effectiveness across all your advertising channels. This page helps marketing teams understand which platforms and ad formats deliver the best performance so they can allocate budgets more effectively.
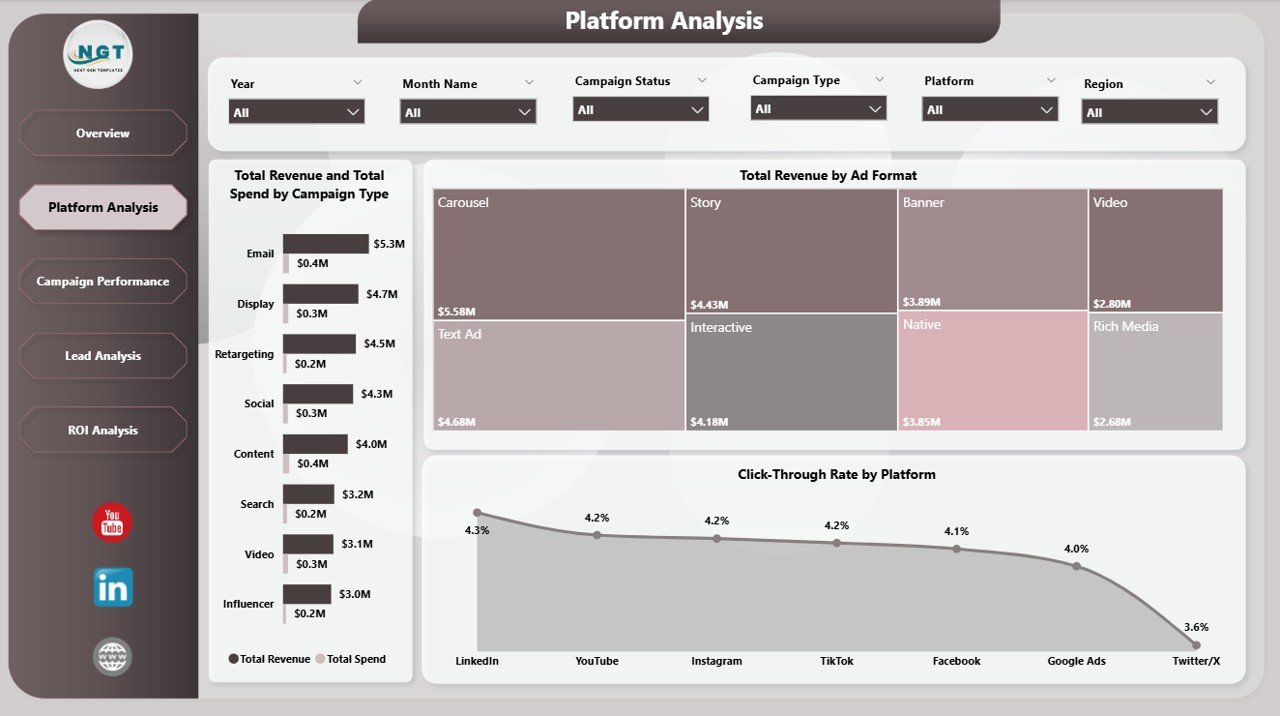
Platform Analysis
3 — Campaign Performance
The Campaign Performance page focuses on team effectiveness and audience targeting results. It includes Total Conversions by Target Audience revealing which demographics convert best, Total Revenue by Manager identifying top-performing campaign managers, and Total Leads by Platform showing lead generation efficiency across different advertising channels. This page is critical for understanding which team members and audience segments contribute the most to your marketing goals.
Click here to Purchase the Digital Marketing Campaign Dashboard in Power BI
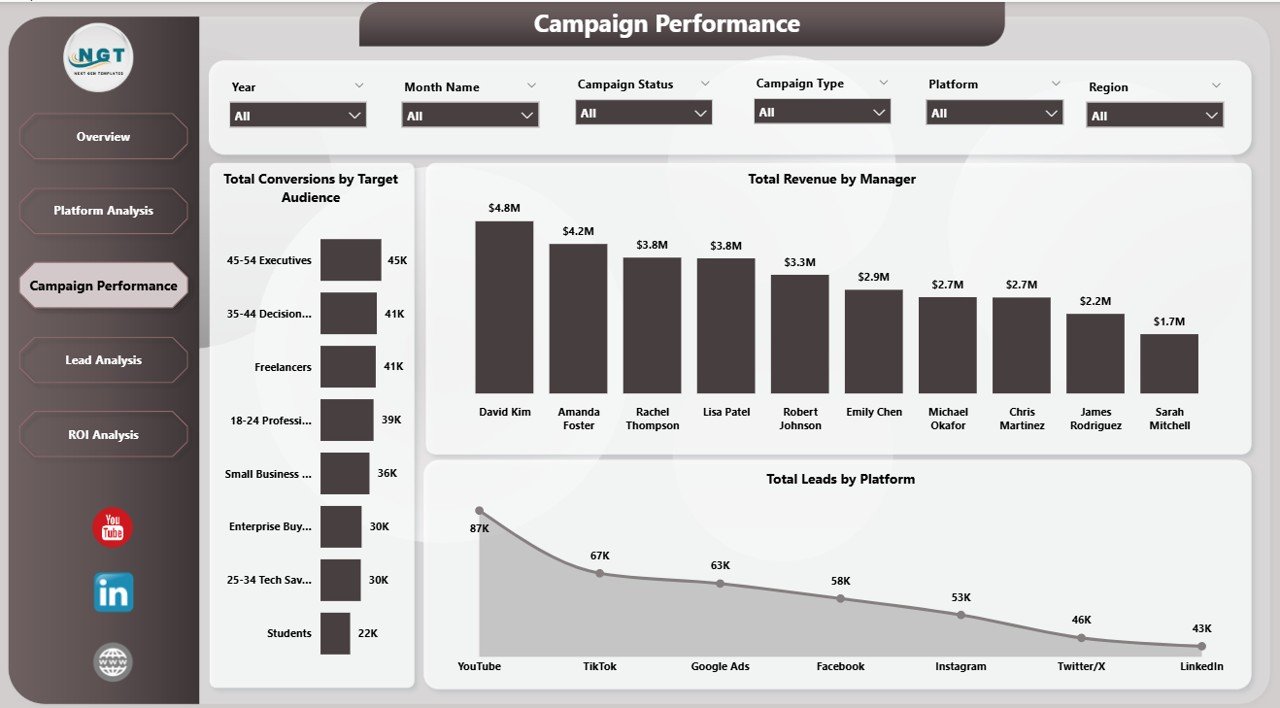
Campaign Performance
4 — Lead Analysis
The Lead Analysis page delivers conversion funnel analytics that help you optimize your lead generation strategy. It shows Total Leads and Total Conversions by Region comparing regional conversion rates, Total Leads and Total Conversions by Campaign Type measuring funnel efficiency across different campaign strategies, and Total Leads by Target Audience identifying which demographics generate the highest volume of qualified leads. This page is essential for marketers focused on maximizing lead-to-conversion ratios.
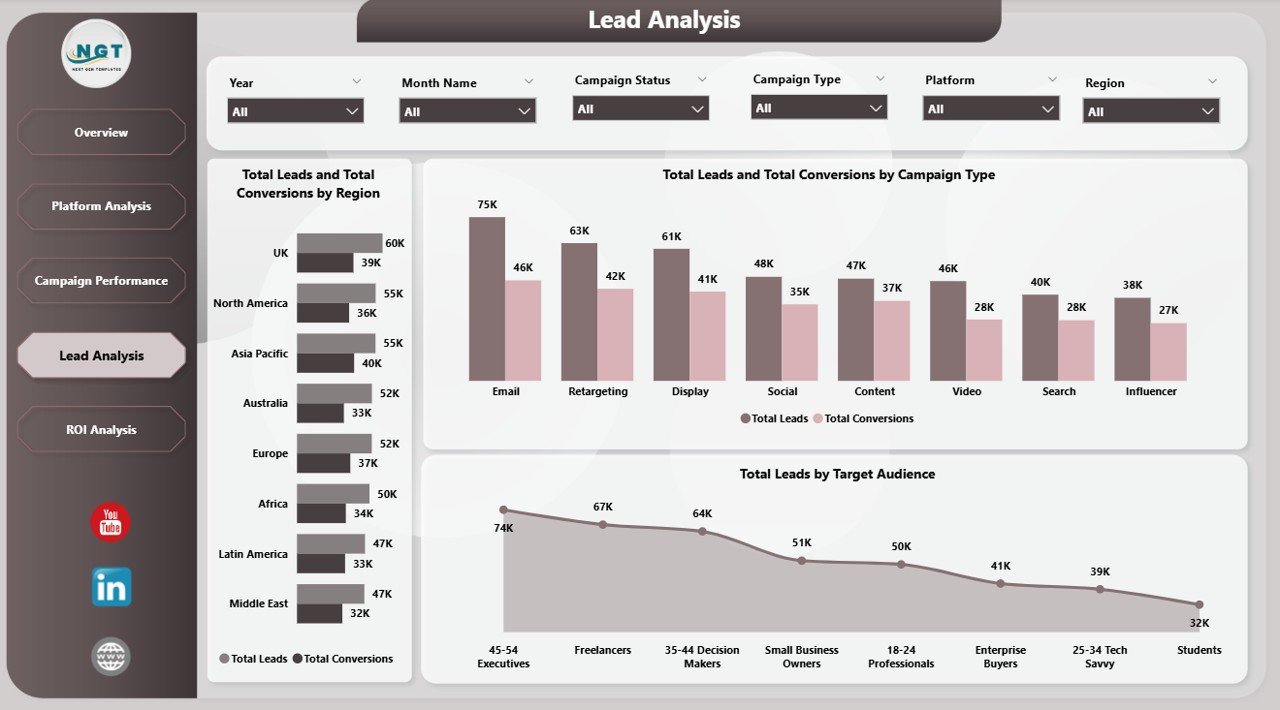
Lead Analysis
5 — ROI Analysis
The ROI Analysis page is where profitability meets strategic planning. It features Net Profit by Region comparing geographic profitability to help you identify the most lucrative markets, Net Profit by Manager evaluating individual contribution to the bottom line, and Total Revenue by Campaign Status comparing the financial performance of active versus completed campaigns. This page empowers CMOs and marketing directors to make data-driven budget allocation decisions.
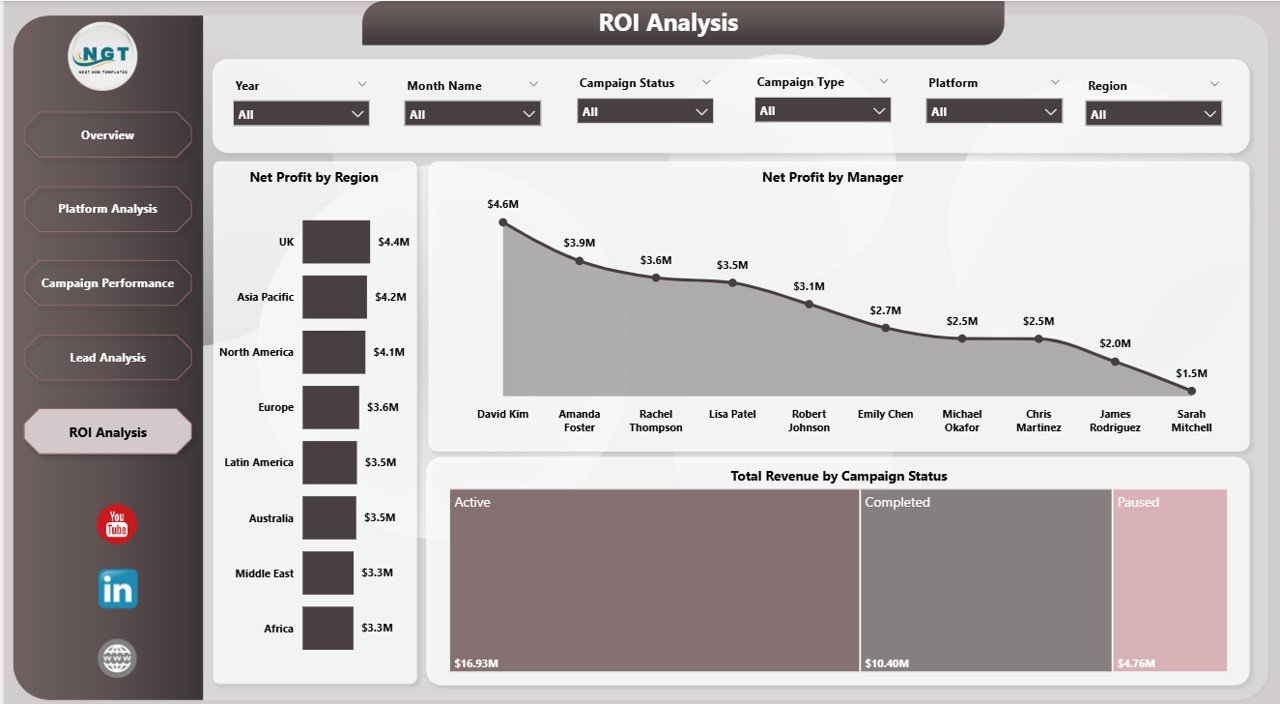
ROI Analysis
Advantages of Digital Marketing Campaign Dashboard in Power BI
This dashboard offers several powerful advantages for marketing professionals and organizations:
- Centralized Marketing Intelligence — Instead of juggling reports from Google Ads, Facebook Ads Manager, and other platforms, consolidate all your campaign data into one interactive dashboard.
- Real-Time Decision Making — With instant data refresh capabilities, marketing managers can make budget reallocation decisions based on the latest performance data rather than outdated weekly reports.
- Team Accountability — The Campaign Performance and ROI Analysis pages provide manager-level tracking, making it easy to identify top performers and areas needing improvement.
- Multi-Dimensional Analysis — Analyze performance from 5 different perspectives — overview, platform, campaign, lead, and ROI — for a complete picture of your marketing operations.
- Shareable and Collaborative — Publish the dashboard to Power BI Service and share it with your team for collaborative decision-making across the organization.
- Click here to Purchase the Digital Marketing Campaign Dashboard in Power BI
Opportunities for Improvement
While this dashboard provides comprehensive marketing analytics out of the box, here are some ways you could extend it further:
- Custom Date Ranges — Add relative date slicers to compare performance across custom time windows like last 7 days, last 30 days, or quarter-over-quarter.
- Budget vs Actual Tracking — Create an additional page to compare planned budget allocations against actual spending by platform and campaign type.
- Funnel Visualization — Add a dedicated funnel chart showing the progression from impressions to clicks to leads to conversions for a visual conversion pipeline.
- Competitor Benchmarking — Incorporate industry benchmark data to compare your CTR, conversion rates, and ROAS against market averages.
Best Practices
To get the maximum value from your Digital Marketing Campaign Dashboard in Power BI, follow these recommendations:
- Update Data Weekly — Refresh your data source at least once a week to keep the dashboard current and relevant for decision-making.
- Use Slicers Strategically — When presenting to stakeholders, use slicers to focus on specific platforms or campaign types rather than showing all data at once.
- Monitor CTR Trends — A declining click-through rate often signals ad fatigue. Use the Platform Analysis page to identify which channels need creative refreshes.
- Review ROI Monthly — The ROI Analysis page should be reviewed at least monthly to ensure budget allocation aligns with the most profitable regions and campaign managers.
- Leverage Power BI Service — Publish the dashboard to Power BI Service for scheduled data refreshes and team sharing capabilities.
Explore Relevant Templates
If you found this Digital Marketing Campaign Dashboard in Power BI useful, check out these related templates from NextGenTemplates:
- Digital Marketing Campaign Dashboard in Excel — The Excel-based version with pivot-powered charts and slicers for the same marketing campaign analytics.
- Brand Consulting Dashboard in Power BI — Track brand consulting project fees, profitability, and consultant performance in Power BI.
- Coffee Chains Dashboard in Power BI — Analyze coffee chain orders, revenue, and customer insights across outlets with 5 interactive pages.
- Power BI Dashboard Templates — Browse our full collection of Power BI dashboards for various industries.
Frequently Asked Questions
What KPIs does the Digital Marketing Campaign Dashboard in Power BI track?
The Digital Marketing Campaign Dashboard in Power BI tracks 5 key metrics on the Overview page: Total Spend, Total Revenue, Total Leads, Total Impressions, and Total Conversions. Additional analysis across 5 pages covers Click-Through Rate, Net Profit by Region and Manager, Total Revenue by Campaign Status, and comparisons by platform, campaign type, ad format, and target audience.
Do I need advanced Power BI skills to use this dashboard?
No. Simply open the .pbix file in Power BI Desktop (free from Microsoft), replace the sample data with your own marketing campaign records, and click Refresh. All charts and visuals update automatically with zero coding required.
Can I track multiple advertising platforms in this dashboard?
Yes. The dashboard supports multi-platform tracking with dedicated Platform Analysis views showing Revenue and Spend by Campaign Type, Revenue by Ad Format, and Click-Through Rate by Platform across all your advertising channels including Google Ads, Facebook, Instagram, LinkedIn, and more.
What is the best Power BI dashboard for tracking digital marketing campaigns?
The Digital Marketing Campaign Dashboard in Power BI from NextGenTemplates is one of the most comprehensive marketing analytics templates available. It includes 5 interactive pages covering overview metrics, platform analysis, campaign performance, lead analysis, and ROI tracking — all in a single .pbix file ready for immediate use.
How is the Power BI version different from the Excel version?
The Power BI version offers more interactive filtering, automatic visual updates, drill-through capabilities, and the ability to publish and share dashboards online via Power BI Service. The Excel version uses pivot tables and slicers. Both track the same digital marketing metrics. Choose Power BI for advanced interactivity and sharing, or Excel for simplicity and offline use.
Can I customize this dashboard with additional metrics?
Yes. Since this is a standard Power BI .pbix file, you can add new visuals, create calculated measures using DAX, add new pages, or modify existing charts to match your specific reporting requirements.
Conclusion
The Digital Marketing Campaign Dashboard in Power BI is an essential analytics tool for any marketing professional who wants to consolidate campaign data, track KPIs across 5 interactive pages, and make data-driven decisions that improve ROI. With 5 KPI cards, platform-level analytics, lead funnel tracking, manager performance monitoring, and regional profitability insights — this dashboard covers every dimension of digital marketing performance analysis.
Download the template today, replace the sample data with your own campaign records, and transform your marketing reporting from scattered spreadsheets into a professional, interactive Power BI dashboard.
Click here to Purchase the Digital Marketing Campaign Dashboard in Power BI
Visit our YouTube channel for step-by-step video tutorials: Youtube.com/@PK-AnExcelExpert