Trucking and Logistics Dashboard in Power BI is a comprehensive, ready-to-use analytics template designed for fleet managers, trucking companies, logistics coordinators, and supply chain professionals. This Power BI dashboard template features 5 interactive pages that transform raw trucking and logistics data into powerful visual insights — covering everything from revenue and fuel cost analysis to route profitability, driver performance tracking, fleet health monitoring, and financial trend analysis.
Whether you operate a small regional fleet or manage a large-scale freight and logistics company, this dashboard helps you make data-driven decisions about route optimization, driver evaluation, fuel cost management, and customer profitability. It is a plug-and-play .pbix file that works with the free version of Power BI Desktop from Microsoft.
Key Features of the Trucking and Logistics Dashboard in Power BI
This Power BI trucking dashboard includes 5 interactive analysis pages, high-level KPI summary cards, dynamic charts, and multiple slicers for quick filtering. Here are the standout features:
- 5 Dashboard Pages — Overview, Route Analysis, Driver Performance, Fleet Analysis, and Financial Trends give you a 360-degree view of trucking operations.
- KPI Summary Cards — The Overview page displays Total Shipments, Total Fuel Cost, Total Revenue, Total Profit, and Avg Revenue Per Shipment at a glance.
- Dynamic Charts — Every page includes purpose-built visuals analyzing revenue, profit, fuel cost, on-time rates, and shipment volumes across multiple dimensions.
- Multiple Slicers — Filter by Cargo Type, Route, Driver Name, Truck ID, Customer Type, and Month across all pages for targeted drill-down analysis.
- Plug-and-Play Design — Replace the included sample data with your own trucking records, click Refresh, and all visuals update automatically — no DAX coding needed.
- Professional Layout — Clean, modern design with consistent color coding across all 5 pages for easy stakeholder presentations.
Dashboard Pages Explained
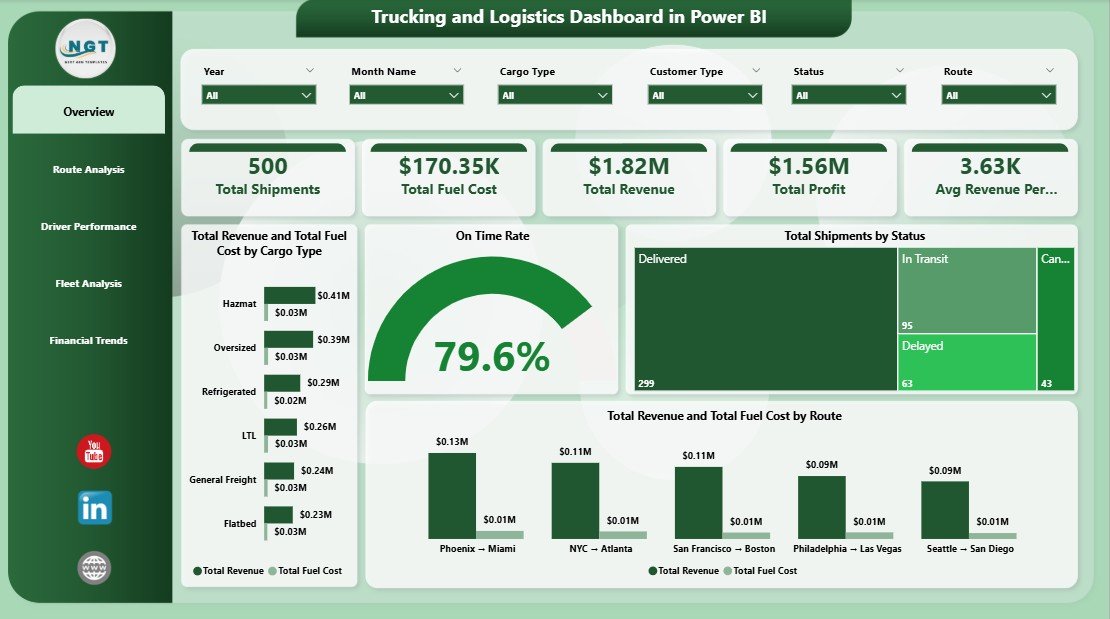
1. Overview Page
The Overview page is the command center of the Trucking and Logistics Dashboard in Power BI. At the top, you’ll find 5 high-level KPI cards:
- Total Shipments — The total number of shipments processed during the selected period.
- Total Fuel Cost — Aggregate fuel expenditure across all trucks and routes.
- Total Revenue — Combined revenue generated from all shipments.
- Total Profit — Net profit after subtracting fuel costs from revenue.
- Avg Revenue Per Shipment — Average revenue earned per individual shipment.
Below the KPI cards, the Overview page features the following analytical visuals:
- Total Revenue and Total Fuel Cost by Cargo Type — Compare revenue and fuel cost side by side across different cargo categories to identify the most profitable cargo types.
- On Time Rate — A quick gauge or card showing the overall on-time delivery percentage, critical for measuring service reliability.
- Total Shipments by Status — Visual breakdown of shipments by their delivery status (Delivered, In Transit, Delayed, etc.) to monitor operational efficiency.
- Total Revenue and Total Fuel Cost by Route — Route-level comparison of revenue versus fuel cost to pinpoint the most and least profitable routes.
Multiple slicers are available on this page to filter the entire dashboard by cargo type, route, driver, truck, customer type, and month.
Overview Page
2. Route Analysis
The Route Analysis page dives deep into geographic and route-level performance. It includes:
- Total Revenue by Driver Name — Identify which drivers are generating the highest revenue across their assigned routes.
- Total Profit by Route — See which routes are the most profitable and which ones may need re-evaluation or renegotiation.
- Total Revenue by Destination City — Analyze revenue distribution across destination cities to optimize resource allocation and route planning.
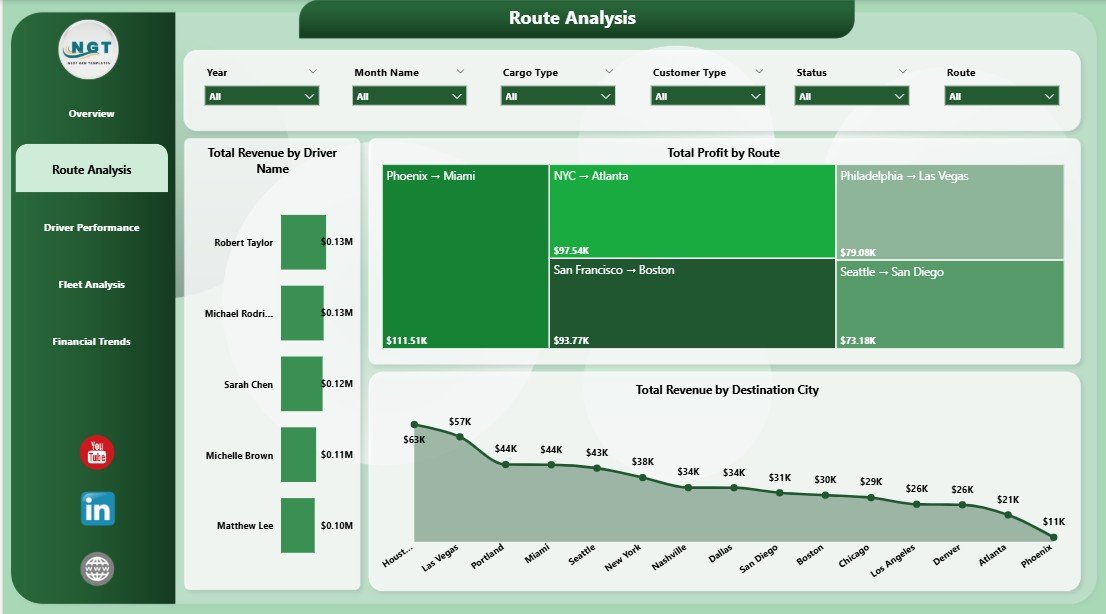
Route Analysis Page
3. Driver Performance
The Driver Performance page helps fleet managers evaluate individual drivers across key metrics:
- On Time Rate by Driver Name — Compare on-time delivery percentages across all drivers to identify reliability leaders and those who may need coaching.
- Total Profit by Driver Name — See which drivers contribute the most to the bottom line through efficient fuel usage and route execution.
- Total Shipments by Destination City — Understand shipment volume distribution to balance driver workloads and optimize dispatch scheduling.
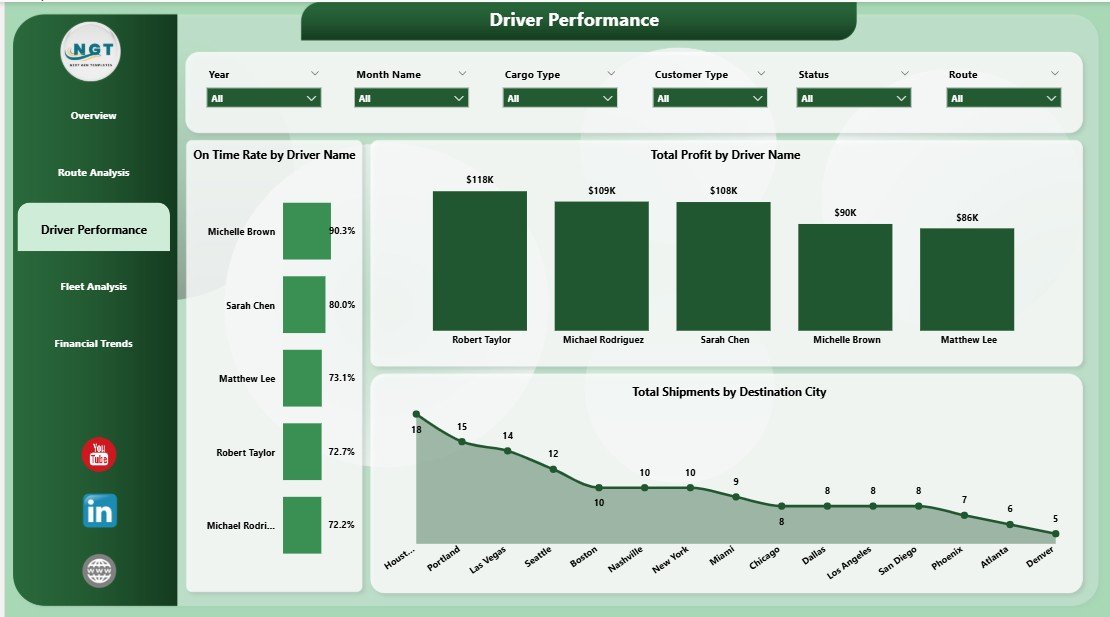
Driver Performance Page
4. Fleet Analysis
The Fleet Analysis page provides vehicle-level insights for maintenance planning and fleet optimization:
- Total Fuel Cost and Total Profit by Truck ID — Compare each truck’s fuel consumption against its profit contribution to identify underperforming or high-maintenance vehicles.
- Total Profit by Month Name — Track monthly profit trends to understand seasonal patterns and plan capacity accordingly.
- On Time Rate by Truck ID — Monitor delivery reliability per vehicle to flag trucks that may need mechanical attention or driver reassignment.
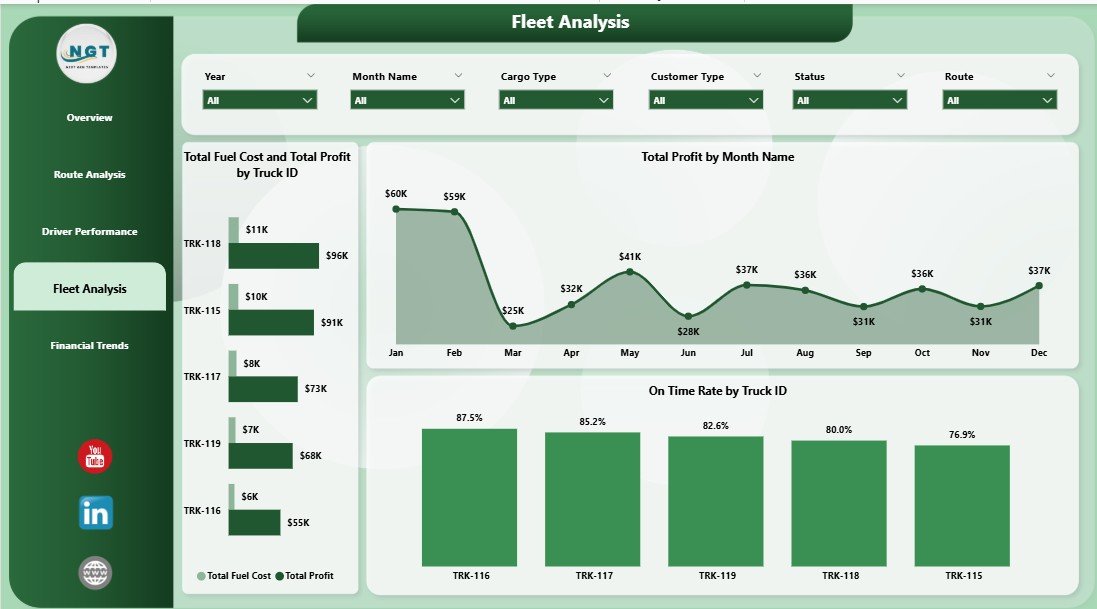
Fleet Analysis Page
5. Financial Trends
The Financial Trends page offers a high-level financial overview for management and finance teams:
- Total Revenue and Total Profit by Customer Type — Understand which customer segments (B2B, B2C, Government, etc.) drive the most revenue and profit.
- Total Shipments and Delivered Shipments by Customer Type — Compare total shipments against delivered shipments by customer segment to measure fulfillment rates.
- Total Revenue and Total Fuel Cost by Month Name — Monthly trend analysis showing revenue and fuel cost patterns for budgeting and financial forecasting.
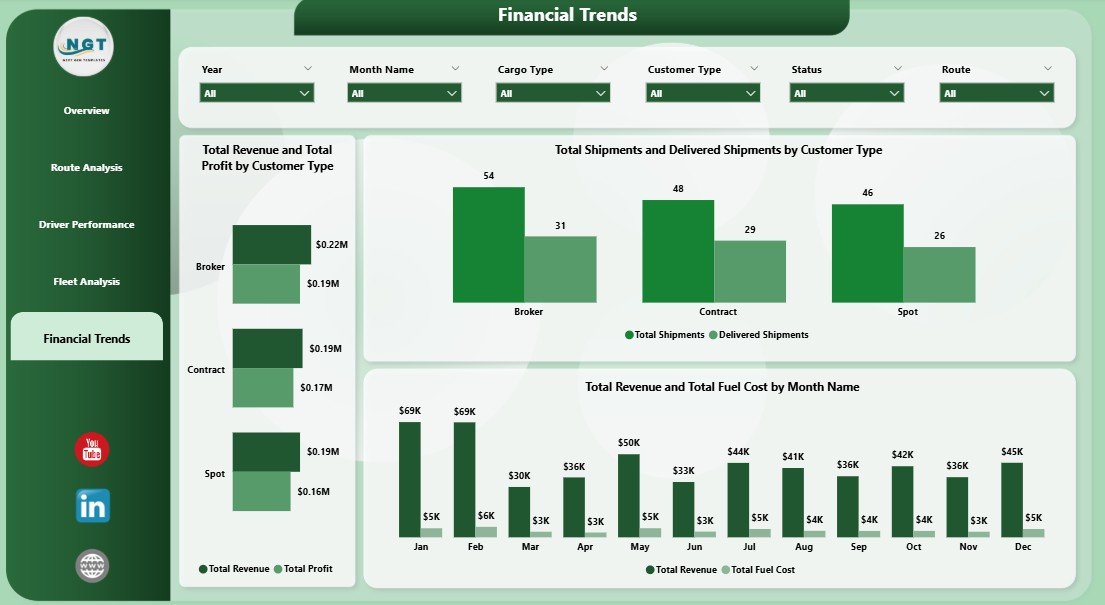
Financial Trends Page
Advantages of the Trucking and Logistics Dashboard in Power BI
- Instant Operational Visibility — Get a complete picture of your trucking operations across 5 purpose-built pages without building anything from scratch.
- Data-Driven Route Decisions — The Route Analysis page helps you identify which corridors are profitable and which need renegotiation or elimination.
- Driver Accountability — Track on-time rates and profit per driver to reward top performers and coach underperformers.
- Fleet Cost Optimization — Compare fuel cost vs profit per truck to make informed decisions about vehicle replacement, maintenance, or retirement.
- Financial Planning — Monthly trend charts help finance teams forecast revenue, budget fuel costs, and project profit margins.
- No Technical Barrier — Works with the free Power BI Desktop application and requires zero DAX coding to get started.
Opportunities for Improvement
- Connect to a live SQL Server or Azure database for real-time data refresh instead of manual data pasting.
- Add a Geospatial Map page using Power BI’s built-in map visuals to visualize routes and destination cities on a real map.
- Include DAX measures for YoY growth, rolling averages, and target vs actual comparisons for deeper trend analysis.
- Add a Maintenance Tracker page to correlate vehicle downtime with fleet performance and fuel cost anomalies.
- Integrate with GPS or telematics APIs to pull live truck location and ETA data directly into the dashboard.
Best Practices for Using This Dashboard
- Refresh Weekly — Update your data and refresh the dashboard at least once a week to catch operational issues early.
- Use Slicers Strategically — Combine slicers (e.g., filter by a specific route AND a specific month) to uncover granular insights hidden in aggregate views.
- Share with Stakeholders — Publish to Power BI Service to share interactive reports with management, dispatchers, and finance teams via web links or embedded dashboards.
- Benchmark Monthly — Use the Financial Trends page to compare month-over-month performance and set quarterly targets.
- Cross-Reference Pages — If a route shows low profit on the Route Analysis page, check the Fleet Analysis page to see if specific trucks on that route have high fuel costs.
Explore Relevant Templates
If you found this Trucking and Logistics Dashboard in Power BI useful, explore these related templates on NextGenTemplates.com:
- Trucking and Logistics Dashboard in Excel — The same trucking analytics powered by Excel pivot tables and slicers, ideal for users who prefer spreadsheet-based dashboards.
- Law Firm Performance Dashboard in Power BI — A professional Power BI template for law firms tracking case metrics, billing, and attorney performance. See the detailed blog post.
- SaaS Financial Model Dashboard in Power BI — Financial modeling and SaaS metrics visualization in Power BI. Read the blog post here.
- Nonprofit Fundraising Dashboard in Power BI — Track donations, campaigns, and donor metrics. See the detailed review.
Frequently Asked Questions
What is the best Power BI dashboard for trucking and logistics?
The Trucking and Logistics Dashboard in Power BI from NextGenTemplates is one of the best ready-to-use options available. It includes 5 interactive pages covering revenue, fuel costs, route analysis, driver performance, fleet operations, and financial trends — all in a single .pbix file that works with the free Power BI Desktop application.
How do I track fleet fuel costs in Power BI?
This dashboard’s Fleet Analysis page shows Total Fuel Cost and Total Profit by Truck ID, allowing you to compare fuel consumption against profit for each vehicle. The Overview page also displays Total Fuel Cost as a KPI card and breaks it down by Cargo Type and Route.
Can I use this trucking dashboard with my own data?
Yes. Simply replace the included sample data with your own records containing columns like Shipment ID, Driver Name, Truck ID, Route, Cargo Type, Revenue, Fuel Cost, Profit, Status, and Date. Click Refresh and all visuals update automatically.
Does this Power BI template require Power BI Pro?
No. The .pbix file opens in Power BI Desktop, which is completely free to download from Microsoft. You only need Power BI Pro if you want to publish and share the dashboard on Power BI Service with other users in your organization.
How can I monitor driver on-time delivery rates?
The Driver Performance page includes an On Time Rate by Driver Name visual that shows each driver’s on-time delivery percentage. You can also see the overall On Time Rate on the Overview page.
What industries can benefit from this logistics dashboard template?
This dashboard is ideal for trucking companies, freight carriers, third-party logistics (3PL) providers, courier services, cold chain logistics operators, last-mile delivery companies, and any business that manages a fleet of vehicles for goods transportation.
Conclusion
The Trucking and Logistics Dashboard in Power BI is a powerful, plug-and-play analytics solution for anyone managing fleet operations, shipment tracking, route optimization, or financial performance in the trucking and logistics industry. With 5 interactive pages, KPI summary cards, dynamic charts, and flexible slicers, it gives you everything you need to turn raw data into actionable business intelligence.
Click here to Purchase the Trucking and Logistics Dashboard in Power BI
Visit our YouTube channel for step-by-step Power BI tutorials and dashboard walkthroughs:
👉 Youtube.com/@PK-AnExcelExpert