Medical Practice Dashboard in Excel — Track Revenue, Patient Satisfaction & Department KPIs in One File
Managing a medical practice means juggling dozens of metrics — from patient wait times to department-level revenue and insurance claim breakdowns. The Medical Practice Dashboard in Excel brings all of these data points together into a single, professionally designed Excel workbook with 5 interactive dashboard pages, a structured data sheet, and a support sheet powered entirely by pivot tables. Whether you run a small private clinic or a multi-specialty hospital, this template gives you instant visibility into financial performance, patient demographics, and operational efficiency without needing Power BI, Tableau, or any external tool.
This dashboard tracks 5 core KPIs — Total Records, Total Revenue, Average Wait Time, Completion Percentage, and Average Patient Satisfaction — and breaks them down across departments, visit types, insurance categories, treatment types, and payment statuses. Every chart updates automatically when you refresh the underlying pivot tables, making it a true plug-and-play solution for healthcare administrators.
Click here to Purchase the Medical Practice Dashboard in Excel
Key Features of the Medical Practice Dashboard in Excel
- 5 Interactive Dashboard Pages — Overview, Department Analysis, Patient Insights, Financial Review, and Operational KPIs provide a 360-degree view of your practice.
- KPI Cards — Total Records, Total Revenue, Avg. Wait Time, Completion %, and Avg. Patient Satisfaction displayed prominently on the Overview page.
- Slicer-Powered Filtering — Apply instant filters by department, visit type, payment status, and more across the entire dashboard.
- Pivot-Table Driven — All charts and metrics are powered by pivot tables in the Support sheet. Just click Refresh All after updating data.
- Revenue & Profit Analysis — Analyze revenue by department, visit type, treatment type, insurance type, and payment status across multiple views.
- Department Benchmarking — Compare satisfaction scores, net profit, average wait times, and costs across all departments side by side.
- Patient Demographics — Understand patient distribution by gender, insurance type, diagnosis category, and visit type.
- Operational Efficiency Tracking — Monitor consultation duration, monthly wait time trends, and cost by treatment type.
- Plug & Play — Replace the sample data with your own records and everything updates automatically. No VBA or advanced Excel skills needed.
- Compatible with Excel 2016+ — Works on both Windows and Mac versions of Microsoft Excel.
Dashboard Pages Explained
1. Overview Page
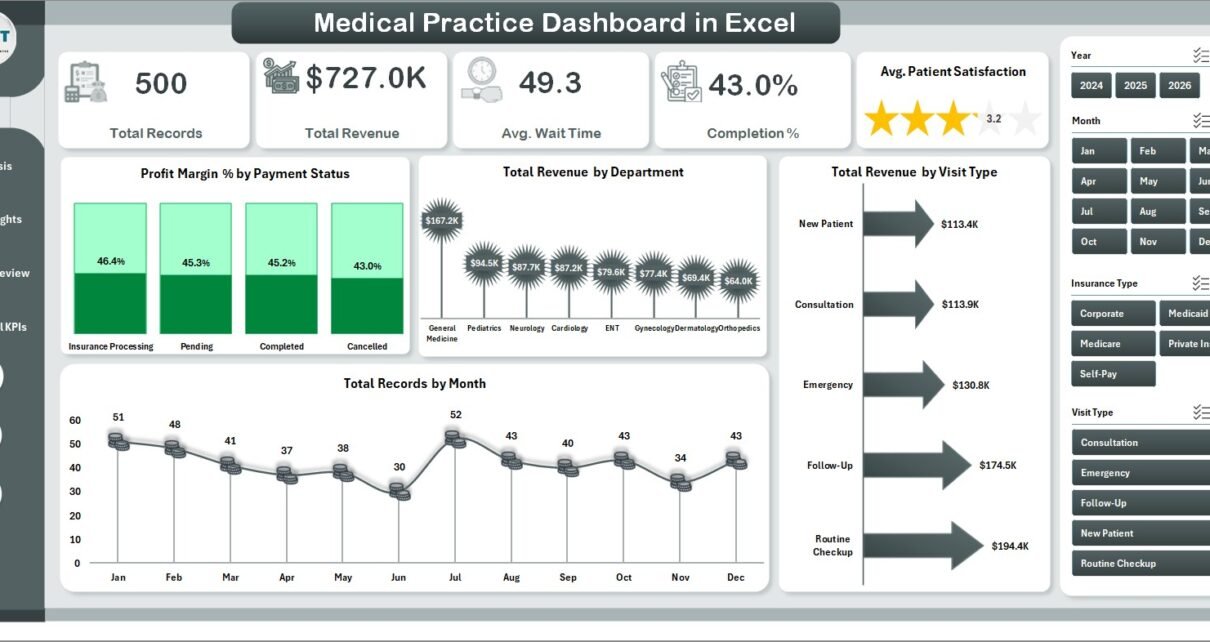
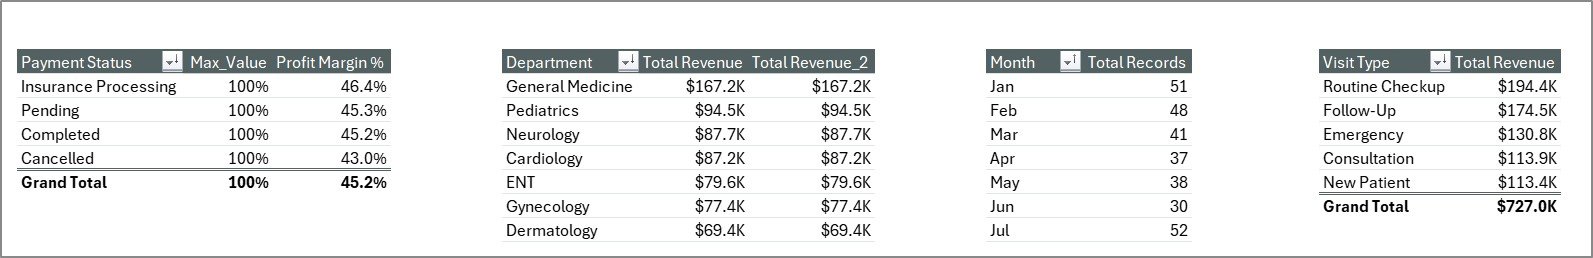
The Overview page is the command center of the Medical Practice Dashboard in Excel. At the top, five KPI cards display high-level metrics: Total Records, Total Revenue, Average Wait Time, Completion %, and Average Patient Satisfaction. Below the cards, four key charts provide quick analytical context — Profit Margin % by Payment Status shows how different payment methods impact profitability, Total Revenue by Department reveals which departments generate the most income, Total Revenue by Visit Type breaks down earnings by appointment categories, and Total Records by Month highlights patient volume trends over time. Multiple slicers across the top allow you to filter the entire page instantly.
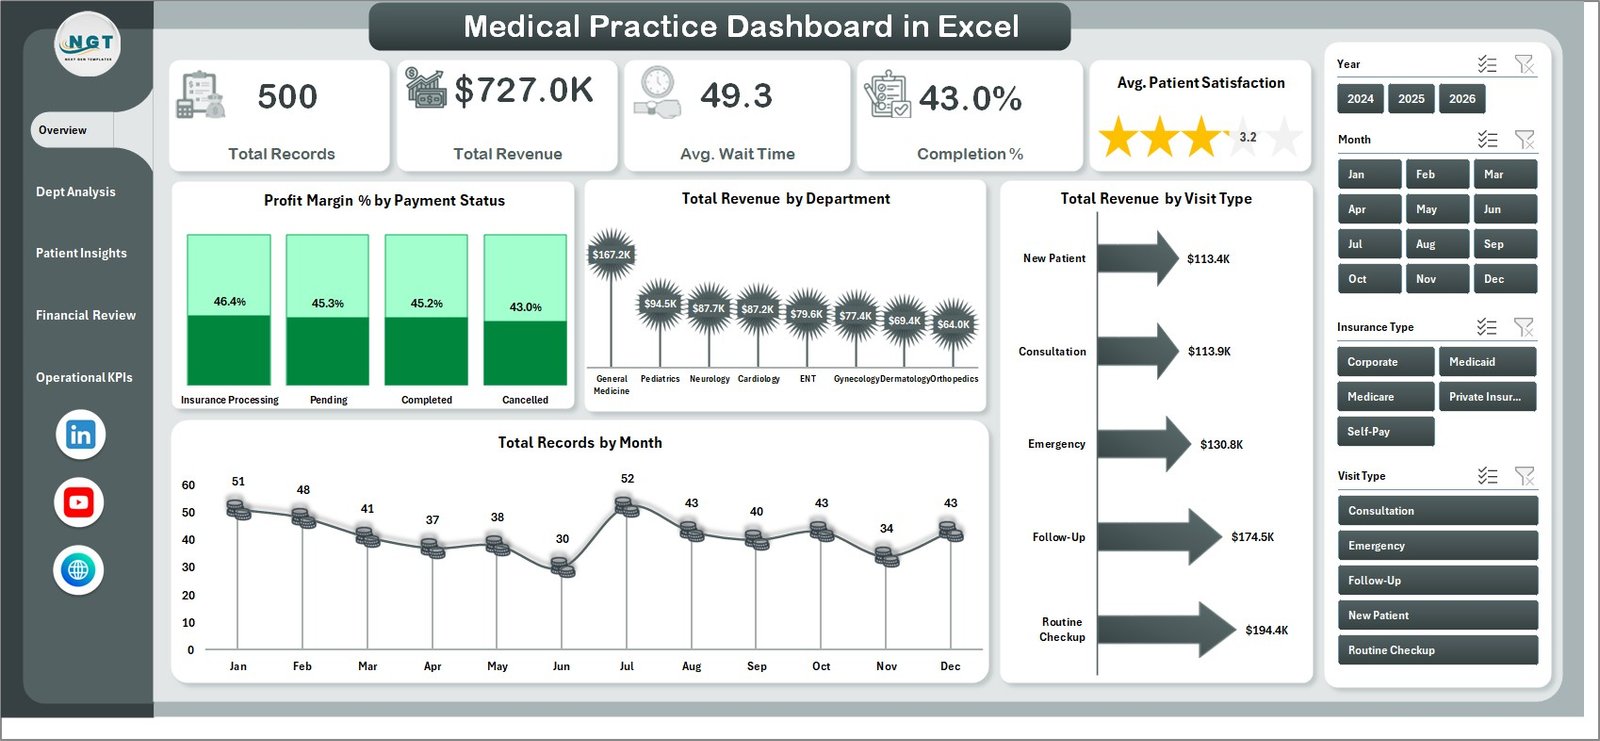
Medical Practice Dashboard in Excel — Overview Page
2. Department Analysis Page
The Dept Analysis page dives deep into how each department within your medical practice is performing. It features four focused visualizations: Total Cost by Gender breaks down expenses across male and female patients, Average Patient Satisfaction by Department highlights which departments are delivering the best patient experience, Net Profit by Department shows the bottom-line contribution of each unit, and Average Wait Time by Department identifies bottlenecks in specific departments. This page is invaluable for healthcare administrators who need to allocate resources efficiently and address underperforming areas.
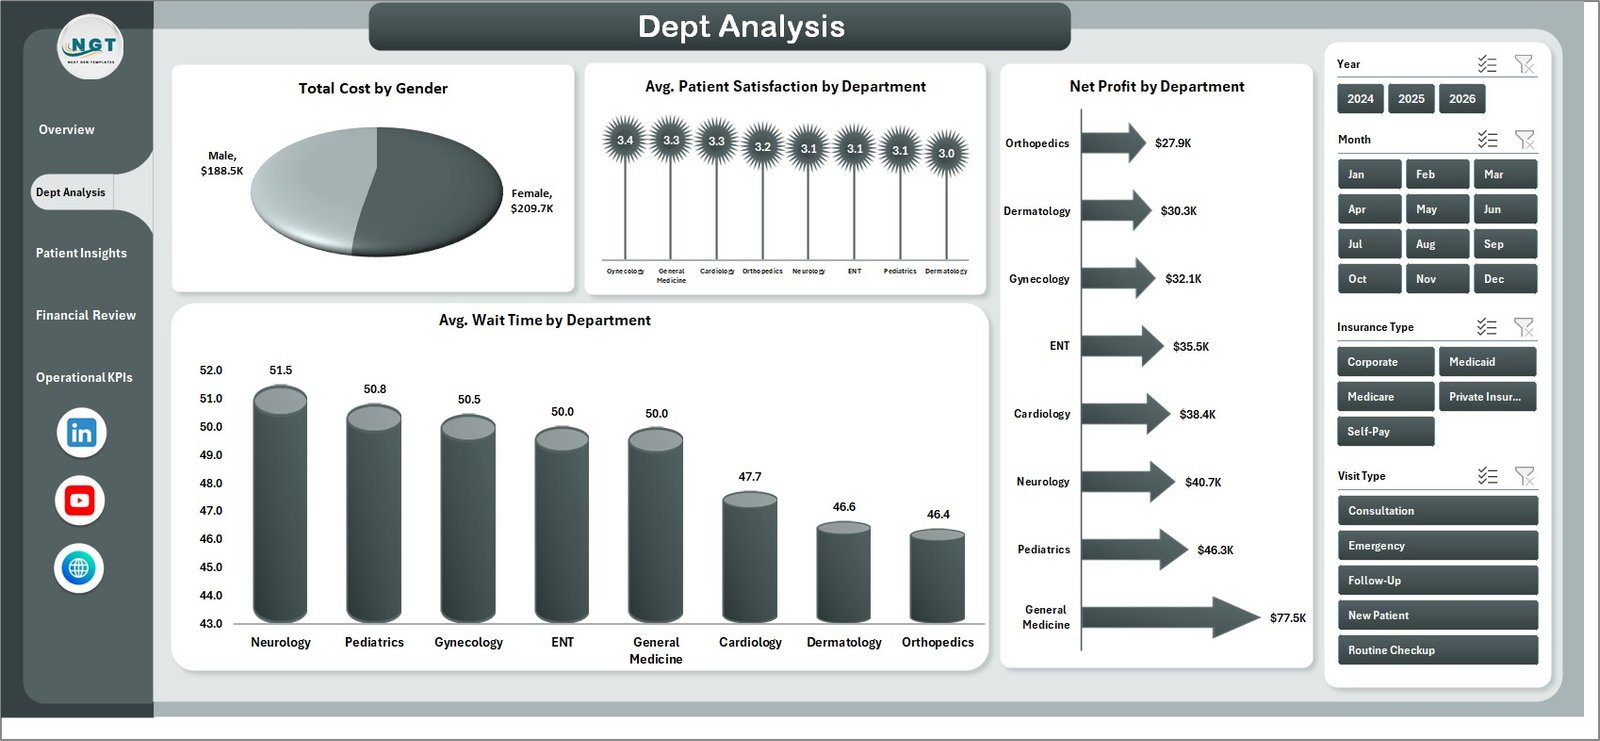
Department Analysis Page
3. Patient Insights Page
Understanding your patient base is critical for any medical practice. The Patient Insights page visualizes Total Revenue by Insurance Type to show which insurance plans contribute the most revenue, Total Cost vs Total Revenue by Gender for a profitability comparison across demographics, Total Records by Visit Type to track the mix of consultations, follow-ups, and emergency visits, and Total Revenue by Diagnosis Category to identify which medical conditions drive the most revenue. These insights help practice managers optimize patient engagement strategies and negotiate better insurance contracts. For a similar analysis focused on hospital operations, check out the Hospital Patient Flow Dashboard in Excel.
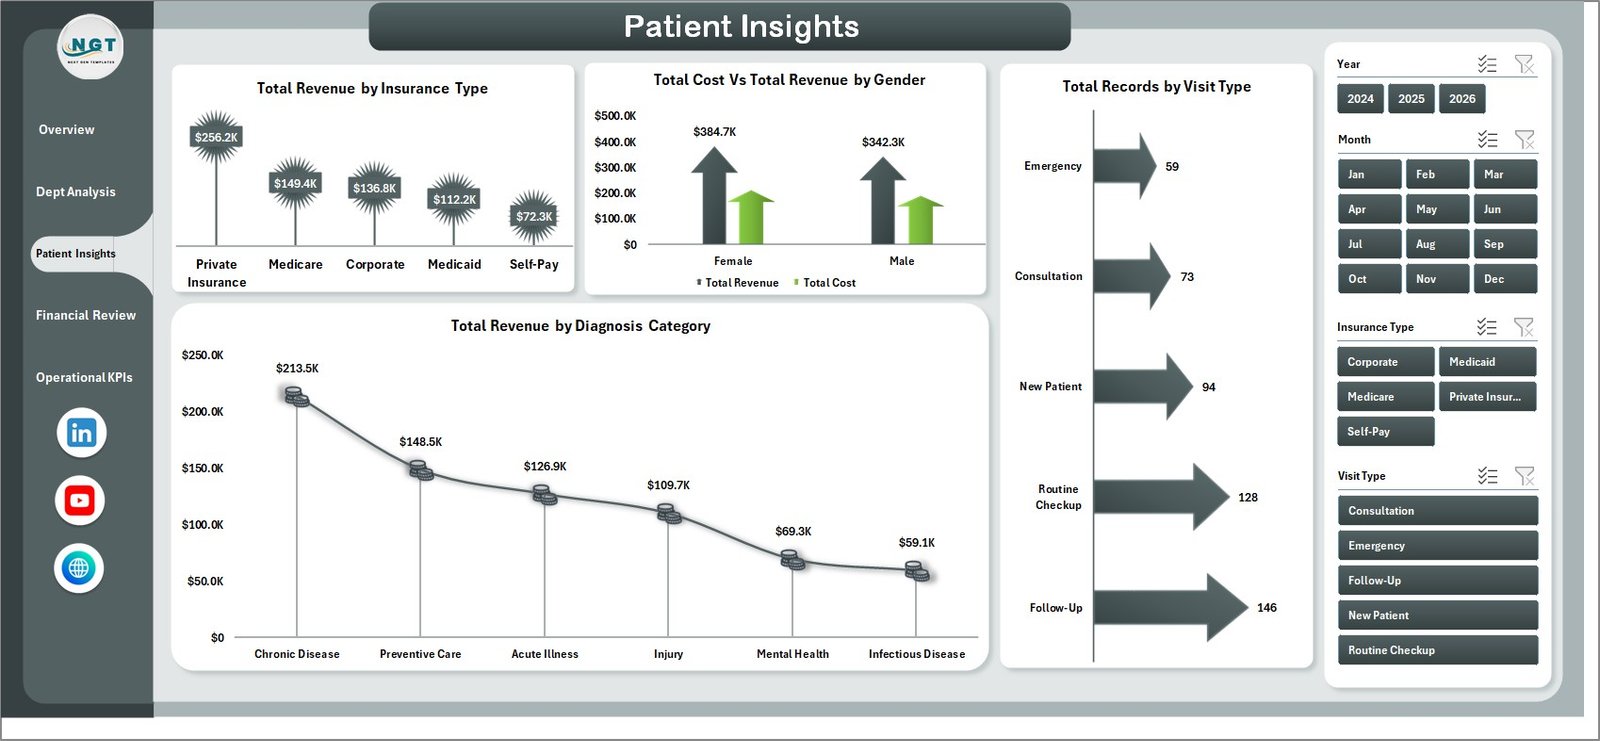
Patient Insights Page
4. Financial Review Page
The Financial Review page is built for monthly finance meetings and board presentations. It includes Total Revenue by Payment Status to track cash vs insurance vs pending payments, Total Revenue by Treatment Type to understand which treatments generate the highest income, Profit Margin % by Department for a profitability comparison across units, and Total Revenue by Month to spot seasonal revenue trends. This page gives CFOs and billing teams the financial clarity they need to make data-driven decisions.
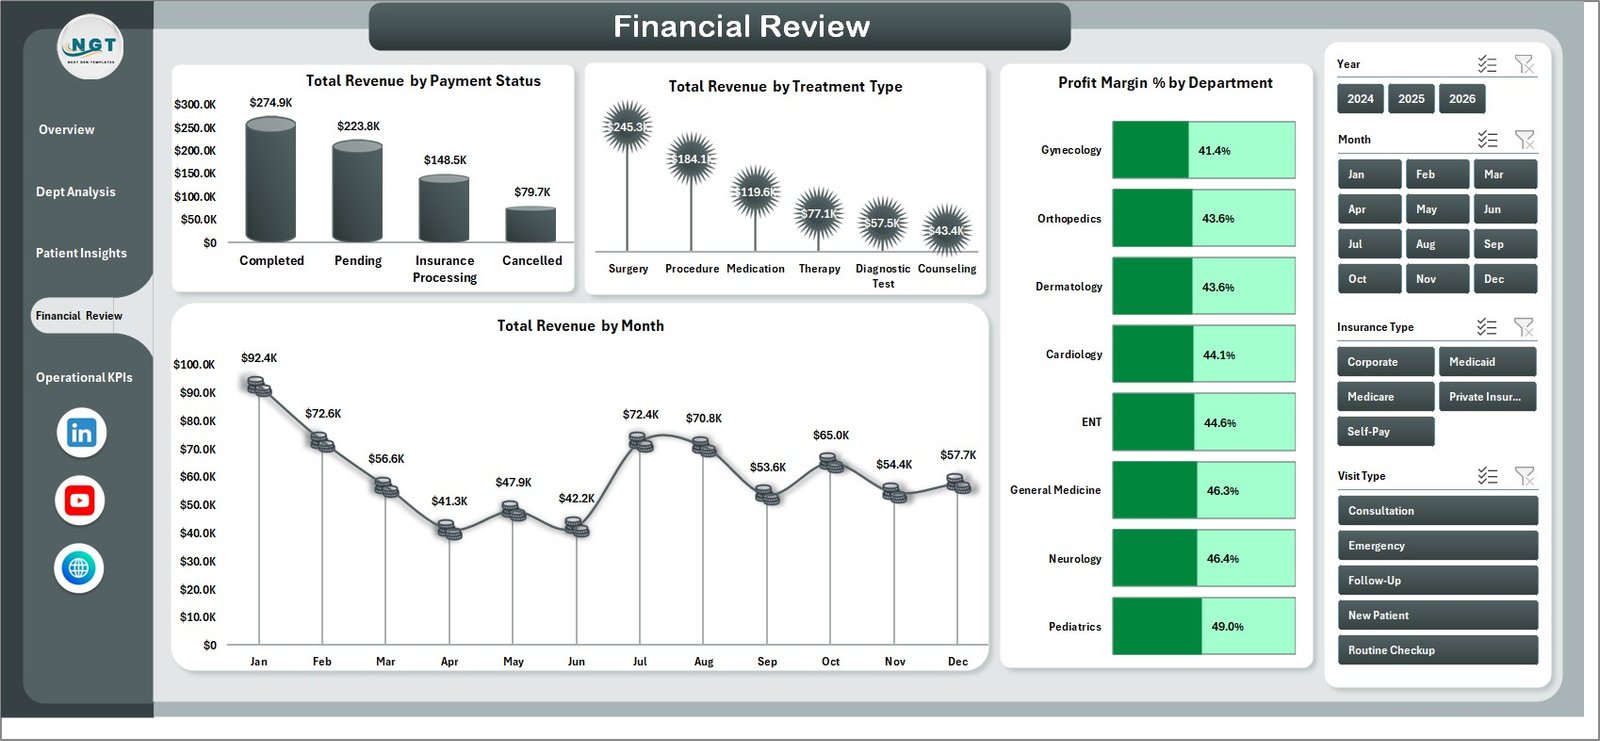
Financial Review Page
5. Operational KPIs Page
Day-to-day operational efficiency determines patient satisfaction and practice profitability. The Operational KPIs page tracks Total Revenue by Gender for demographic revenue analysis, Total Cost by Treatment Type to identify expensive procedures, Average Consultation Duration by Department to benchmark physician efficiency, and Average Wait Time by Month to track improvements in patient flow over time. If you manage a larger healthcare facility, you may also benefit from the Clinical Trials Management Dashboard in Power BI for research-focused analytics.
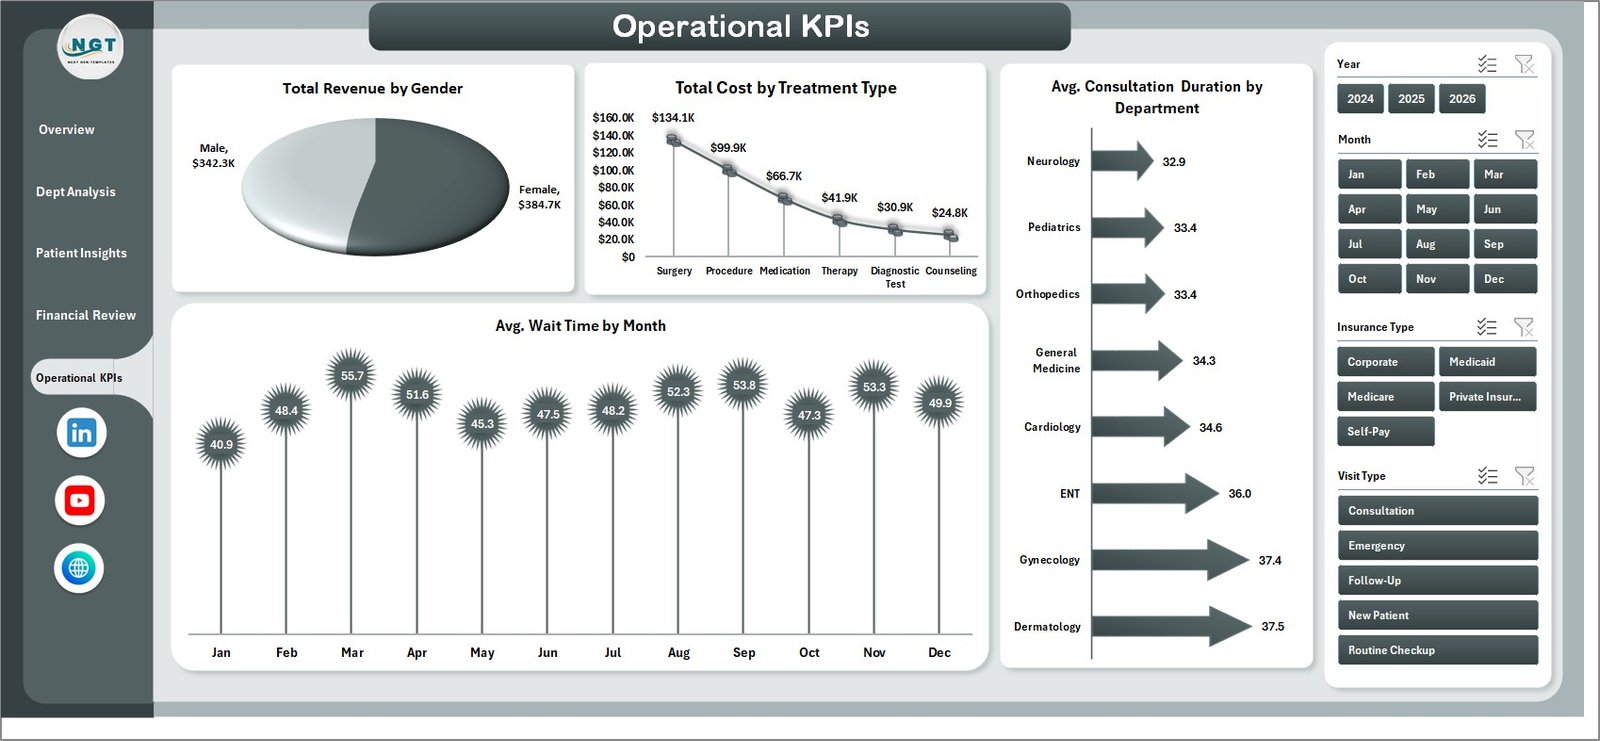
Operational KPIs Page
6. Data Sheet
The Data Sheet is where all your raw patient and financial records live. It comes pre-loaded with structured sample data that demonstrates the exact format required — including fields for patient information, department, visit type, diagnosis category, insurance type, payment status, treatment type, revenue, cost, wait time, consultation duration, and satisfaction scores. Simply replace the sample rows with your own data, maintaining the same column structure.
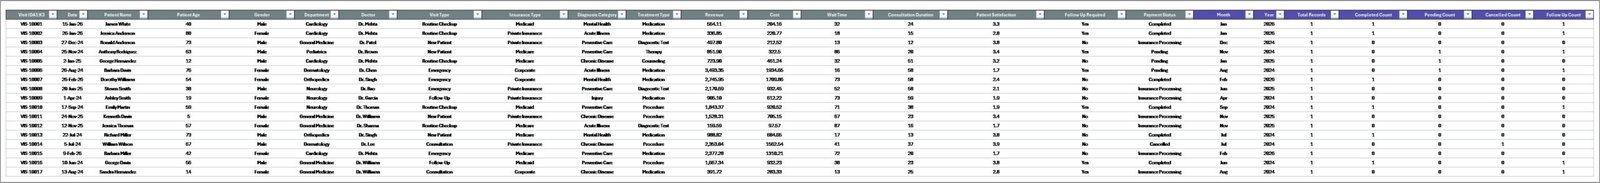
Data Sheet Tab
7. Support Sheet
The Support Sheet contains all the pivot tables that power every chart and KPI card across the 5 dashboard pages. After updating your data in the Data Sheet, navigate to the Data tab in the Excel ribbon and click Refresh All — every pivot table recalculates and every chart updates instantly. You can keep this sheet hidden during presentations for a clean look.
Support Sheet Tab
Advantages of the Medical Practice Dashboard in Excel
- No External Tools Required — Everything runs inside Microsoft Excel. No subscriptions to Power BI, Tableau, or any cloud platform needed.
- Instant Decision-Making — KPI cards and interactive slicers give you answers in seconds, not hours. Filter by department or payment status with a single click.
- Comprehensive Coverage — Five dedicated analysis pages ensure you never miss a critical metric, from revenue trends to patient satisfaction to operational bottlenecks.
- Scalable — The pivot-table architecture handles thousands of records without performance issues. Grow your data as your practice grows.
- Professional Presentation-Ready — Clean design with consistent formatting makes it ideal for board meetings, investor presentations, and compliance audits.
- Cost-Effective — At $17.99, this is a fraction of what custom healthcare BI solutions cost, with immediate time-to-value.
Opportunities for Improvement
- Trend Line Analysis — Adding moving averages or trend lines to monthly charts would help identify long-term patterns in revenue and patient volume.
- Conditional Formatting Alerts — KPI cards could benefit from red/yellow/green color coding when metrics fall below target thresholds.
- Year-over-Year Comparisons — A dedicated comparison view showing current vs previous year performance would add strategic depth.
- Additional Filters — Adding slicers for date ranges and diagnosis categories would give users even more granular control.
Best Practices for Using the Medical Practice Dashboard
- Update Data Weekly — For the most accurate insights, update the Data Sheet at least once a week and refresh all pivot tables.
- Use Consistent Categories — Ensure department names, visit types, and insurance categories match exactly across all records to avoid data fragmentation.
- Present One Page at a Time — During meetings, focus on one dashboard page per agenda item rather than switching between views rapidly.
- Back Up Before Major Changes — Always save a backup copy before adding new columns or modifying the pivot table structure.
- Hide the Support Sheet — Right-click the Support Sheet tab and select Hide to keep your workbook clean when sharing with non-technical stakeholders.
Explore Relevant Templates
If you found the Medical Practice Dashboard in Excel useful, here are more healthcare and hospital management templates from NextGenTemplates:
- Hospital Patient Flow Dashboard in Excel — Track patient admissions, discharges, and bed occupancy across departments.
- Clinical Trials Management Dashboard in Excel — Monitor trial enrollment, milestones, and compliance metrics.
- Veterinary Clinic Dashboard in Excel — Similar dashboard structure adapted for veterinary clinics and animal hospitals.
- Healthcare & Hospital Management Bundle (8 Templates) — Get the complete healthcare analytics toolkit at 44% savings.
Browse the full collection of Excel Dashboard Templates for more industries and use cases.
Frequently Asked Questions
What is the best Excel dashboard for a medical practice?
The Medical Practice Dashboard in Excel by NextGenTemplates is one of the most comprehensive options available. It includes 5 interactive dashboard pages covering revenue analysis, department performance, patient insights, financial review, and operational KPIs — all powered by Excel pivot tables that update automatically when you refresh your data.
What KPIs does this medical practice dashboard track?
This dashboard tracks 5 primary KPIs on the Overview page: Total Records, Total Revenue, Average Wait Time, Completion Percentage, and Average Patient Satisfaction. These metrics are further analyzed across departments, visit types, insurance types, treatment types, payment statuses, gender, diagnosis categories, and monthly trends across the remaining 4 pages.
Do I need VBA or macros to use this template?
No. The Medical Practice Dashboard in Excel uses only standard Excel features — pivot tables, charts, slicers, and formulas. There is no VBA or macro code involved. Simply replace the sample data, click Refresh All, and the dashboard updates instantly.
Can I add more departments or categories to this dashboard?
Yes. Since all charts are driven by pivot tables, adding new department names, visit types, or any other category in the Data Sheet will automatically reflect in the dashboard after refreshing. The template is designed to scale with your practice.
How do I track medical practice KPIs in Excel?
The easiest way to track medical practice KPIs in Excel is to use a pre-built dashboard template like this one. Enter your patient records, revenue data, and operational metrics into the Data Sheet, then use the 5 dashboard pages to monitor performance across departments, finances, patient demographics, and daily operations. Excel pivot tables handle all calculations automatically.
Is this dashboard compatible with Excel for Mac?
Yes. The Medical Practice Dashboard in Excel is fully compatible with Excel 2016 and later versions on both Windows and Mac. All pivot tables, charts, and slicers work across both platforms.
Conclusion
The Medical Practice Dashboard in Excel is a powerful, ready-to-use analytics solution for healthcare professionals who want data-driven insights without the complexity of enterprise BI tools. With 5 interactive pages, automatic pivot-table refresh, and slicer-powered filtering, it transforms raw patient and financial data into actionable intelligence in minutes. Download it today and take control of your practice’s performance.
Click here to Purchase the Medical Practice Dashboard in Excel
For step-by-step video tutorials on Excel dashboards, visit our YouTube channel:
👉 Youtube.com/@PK-AnExcelExpert
Learn more about building dashboards from Microsoft’s official PivotTable guide.