The Cemetery Dashboard in Excel tracks 5 high-level KPI cards and 16+ analysis charts across 5 interactive pages, plus a Data Sheet and Support Sheet driven by pivot tables. Setup takes under 10 minutes — replace the sample rows in the Data Sheet, click Data → Refresh All, and the entire dashboard rebuilds automatically.
🌍 Join 8,400+ teams in 40+ countries using NextGenTemplates to replace paid SaaS tools with one-time-purchase Excel, Google Sheets, Power BI, and HTML templates.
✅ Instant download · One-time payment · No subscription · No per-user fees · Lifetime access
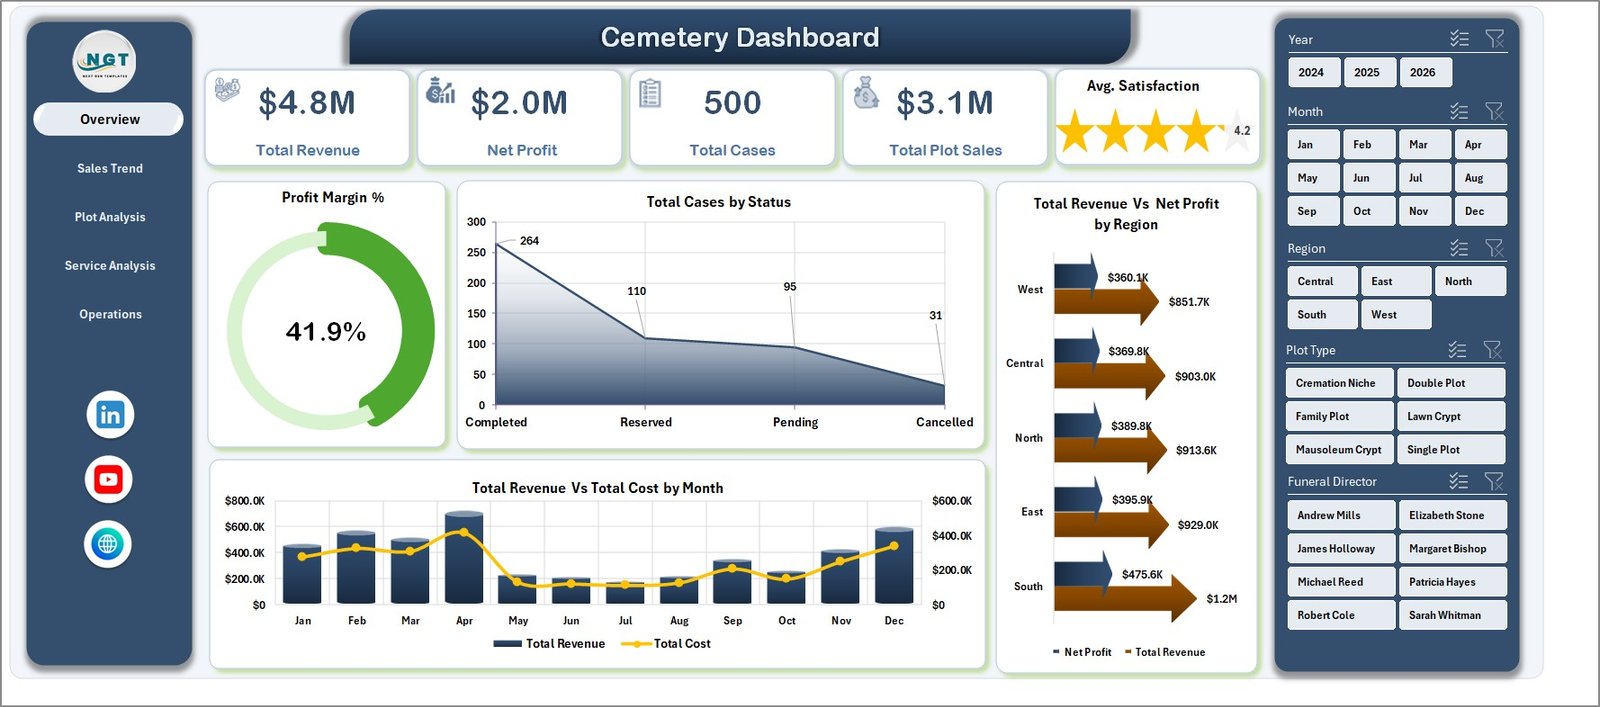
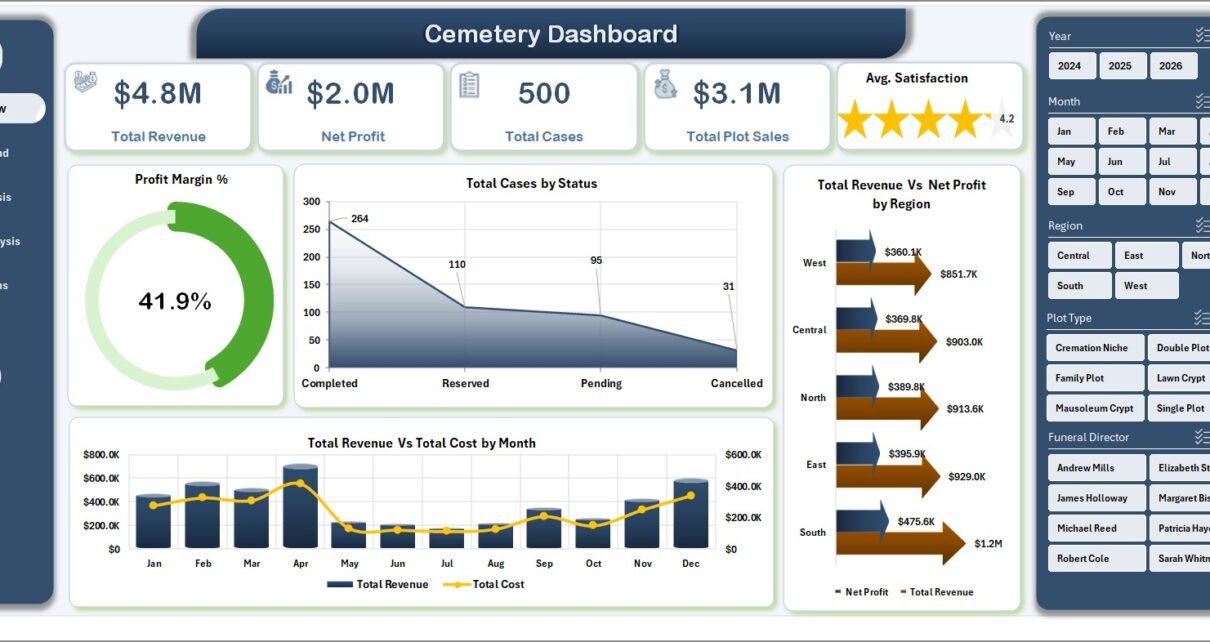
Cemetery Dashboard in Excel — Overview Page
Introduction to the Cemetery Dashboard in Excel
Running a cemetery or funeral home today means tracking dozens of moving parts — case counts, plot sales by section, pre-need program growth, payment collection cycles, and funeral director productivity. Most small operators do this in a stack of disconnected spreadsheets or pay $4,000–$30,000 per year for a full cemetery management platform.
The Cemetery Dashboard in Excel is built for the middle ground: it gives you the reporting layer of a paid SaaS platform without the per-user pricing or implementation cycle. Drop your case-level data into one sheet, refresh, and you get a 5-page interactive view of revenue, profit, plot sales, services, and operations — ready for board meetings or trustee reports.
According to the National Funeral Directors Association’s industry research, the average funeral home now operates on tighter margins than ever as cremation rates climb above 60% in the United States. That makes Profit Margin %, Pre-Need %, and Service Type analysis more important than ever — exactly what this dashboard surfaces.
Key Features of Cemetery Dashboard in Excel
📊 5 high-level KPI cards on the Overview page — Total Revenue, Net Profit, Total Cases, Total Plot Sales, and Avg. Satisfaction. Every card recalculates the moment you change a slicer or add a row in the Data Sheet.
📈 16+ pivot-driven charts across 5 dashboard tabs — Profit Margin %, Total Cases by Status, Total Revenue Vs Net Profit by Region, Total Revenue Vs Total Cost by Month, Total Revenue by Plot Type, Section, Plot Size, Service Type, Funeral Director, Payment Method, and Pre-Need % by Region.
🔍 Multiple slicers for instant filtering — slice the entire dashboard by Region, Status, Plot Type, Service Type, Funeral Director, Payment Method, or Year with one click. All charts and KPIs across all pages refresh together.
🗂️ Single Data Sheet as the source of truth — paste your transaction-level data here and the dashboard updates automatically. No formulas to edit, no chart ranges to fix.
⚙️ Hidden Support Sheet with all pivots — every chart on every page is driven by pivots on this sheet. Click Data → Refresh All after updating data and the entire dashboard rebuilds in seconds.
🖨️ Print-ready and presentation-friendly layout — clean palette, fixed page sizes, and clear chart titles for board meetings and family-management committee reports.
Dashboard Pages Explanation
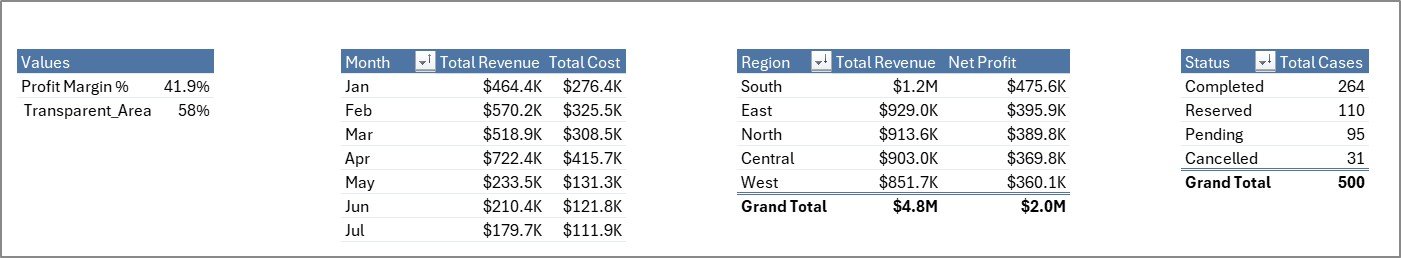
1. Overview Page — Cards: Total Revenue, Net Profit, Total Cases, Total Plot Sales, Avg. Satisfaction. Charts: Profit Margin %, Total Cases by Status, Total Revenue Vs Net Profit by Region, and Total Revenue Vs Total Cost by Month. Multiple slicers let you filter the whole view in one click.
Overview Page
2. Sales Trend — track yearly and monthly performance: Total Revenue by Year, Total Revenue by Month, Net Profit by Month, and Total Cases by Month. This is the page you take to your monthly board review.
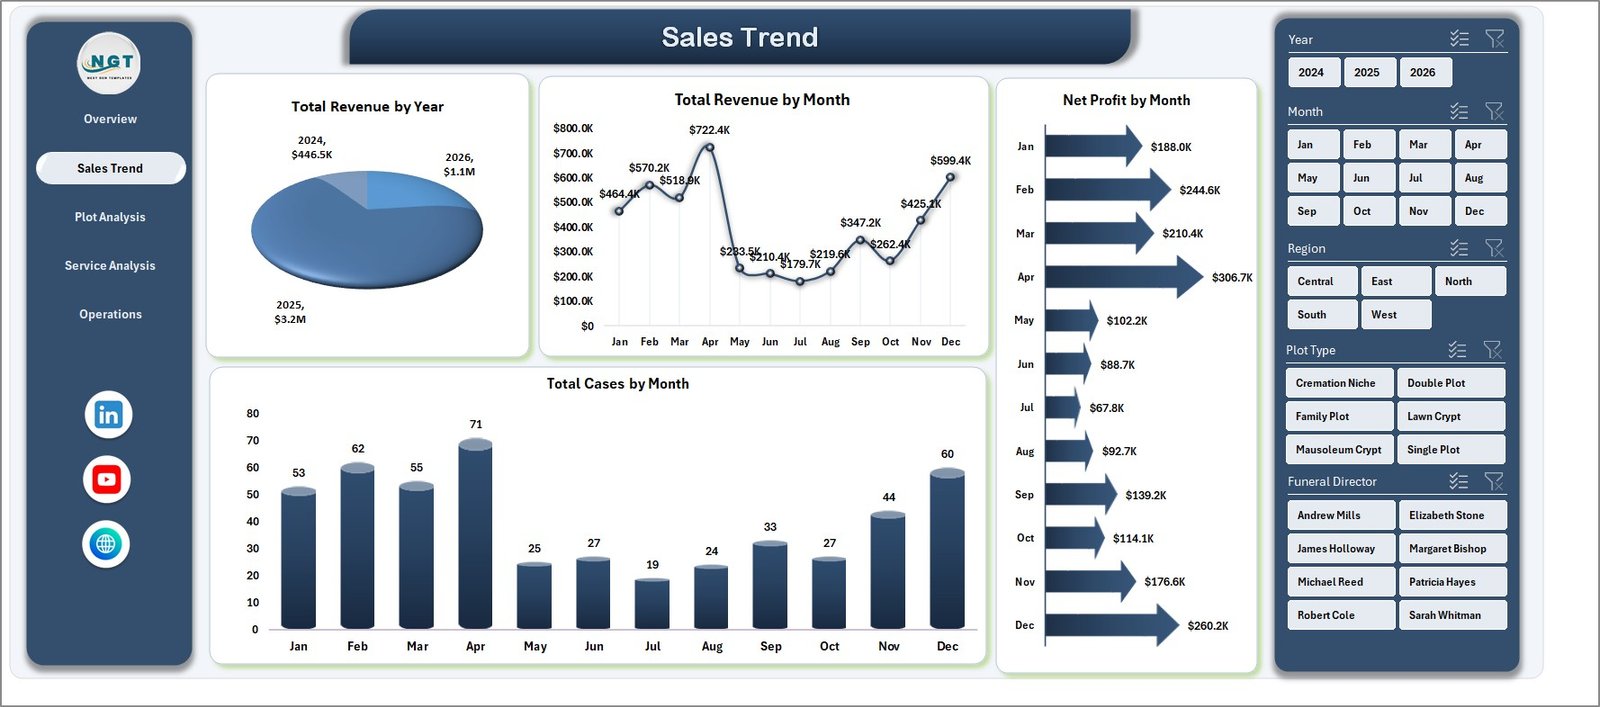
Sales Trend
3. Plot Analysis — see where the money is coming from: Total Revenue by Plot Type, Total Revenue by Section, Net Profit by Section, and Total Plot Sales by Plot Size. Identify high-margin sections and underperforming inventory at a glance.
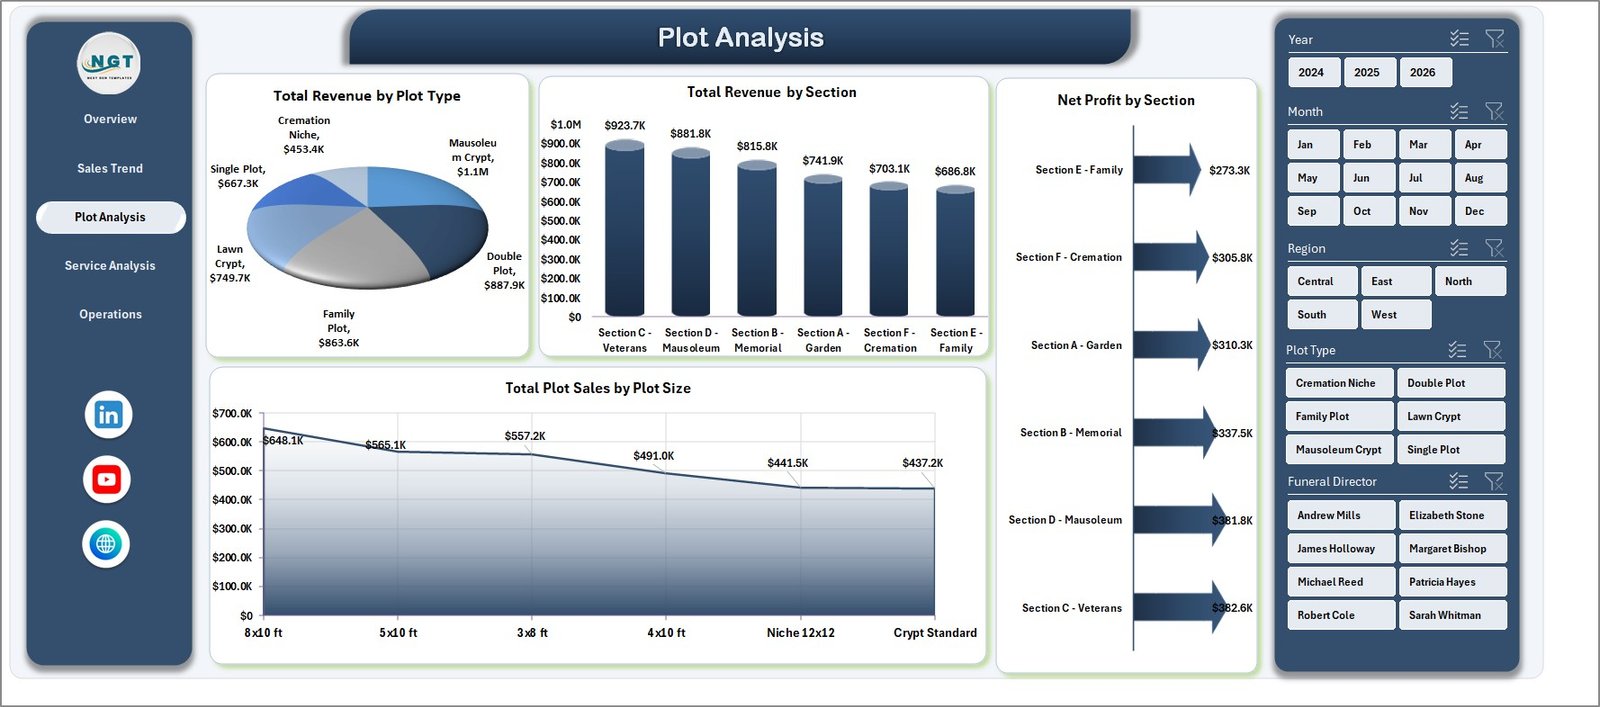
Plot Analysis
4. Service Analysis — Total Revenue by Service Type, Net Profit by Service Type, Total Cases by Funeral Director, and Total Revenue by Funeral Director. Compare director productivity and profitability across burial, cremation, and memorial services.
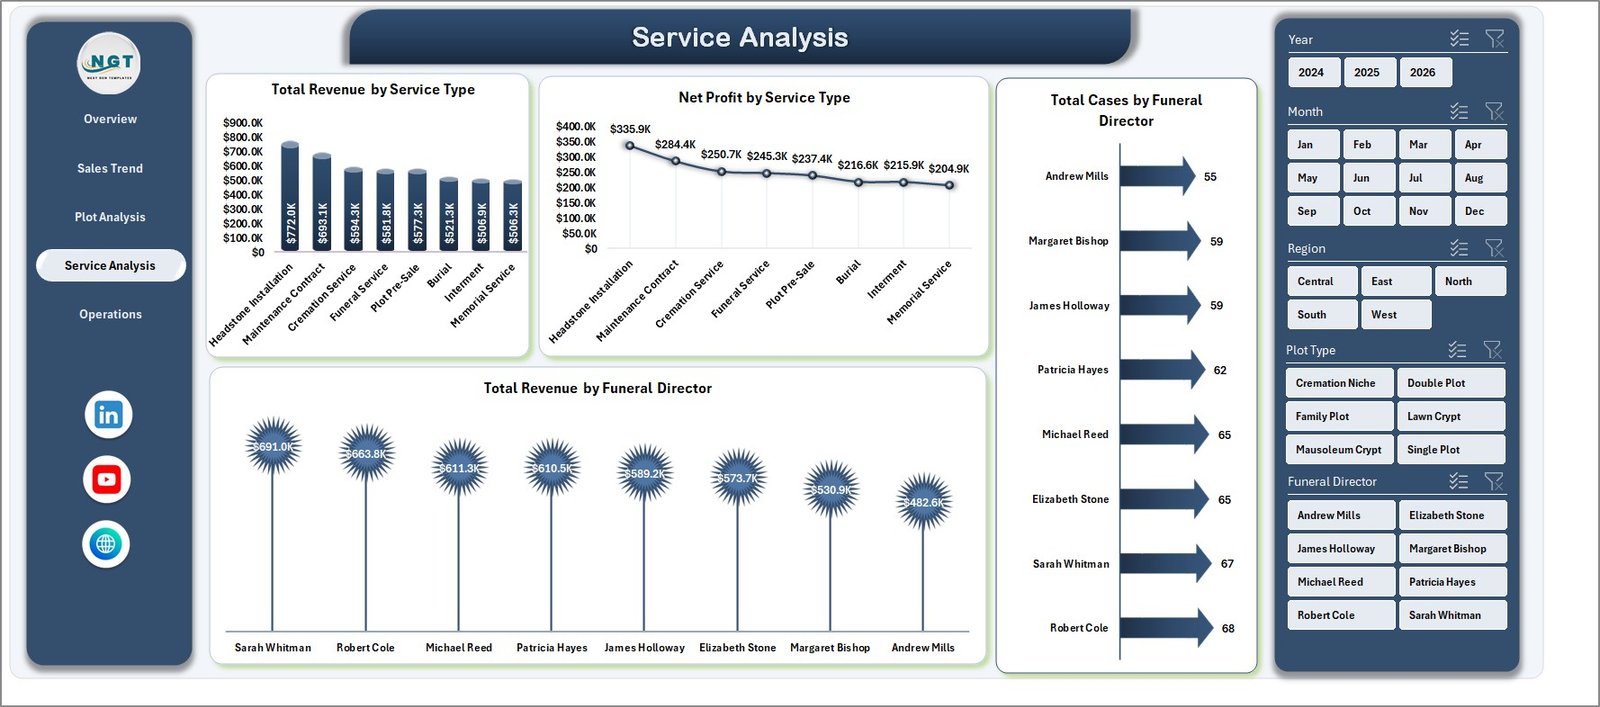
Service Analysis
5. Operations — Total Cases by Region, Total Revenue by Status, Pre-Need % by Region, and Total Revenue by Payment Method. Use this view for financial planning and pre-need vs at-need mix decisions.
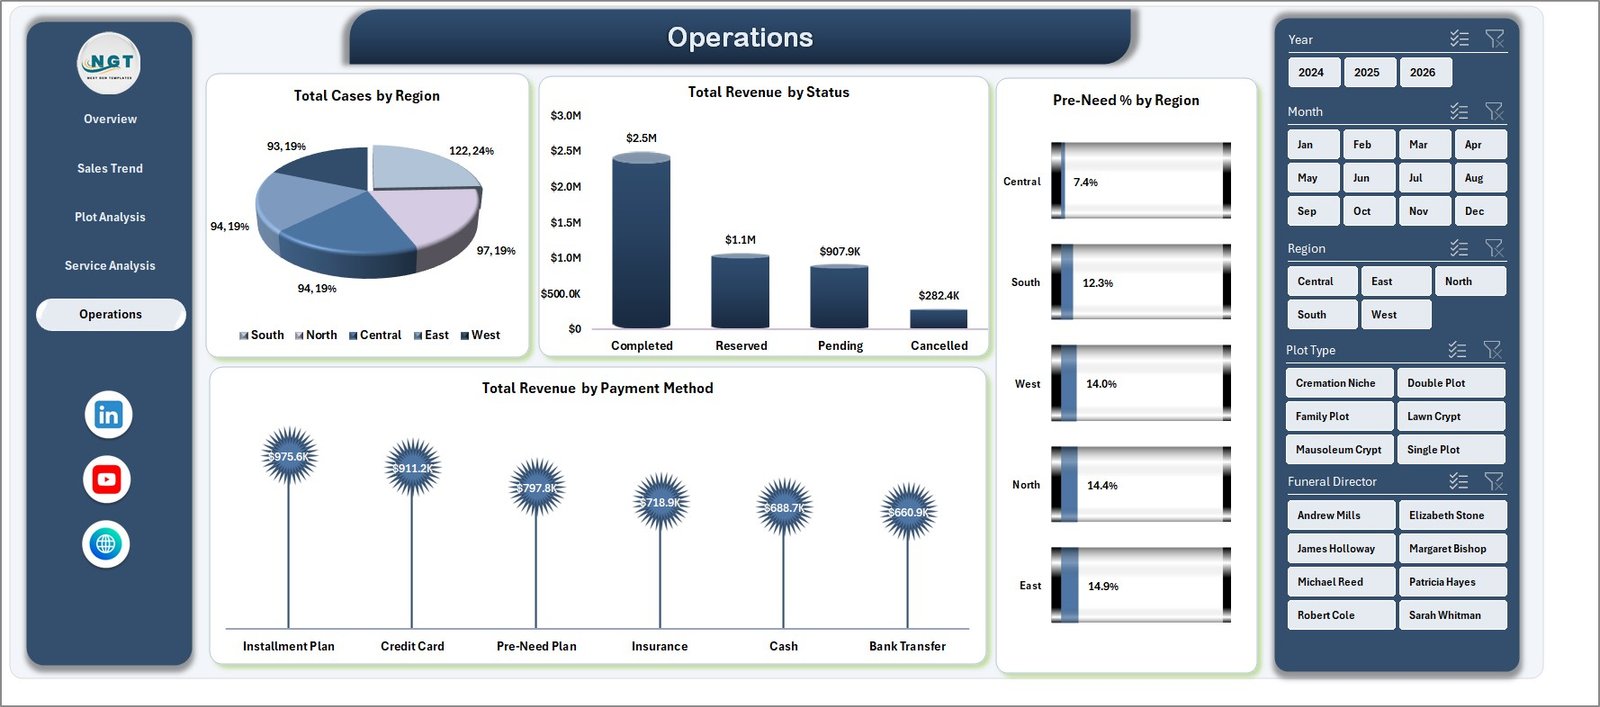
Operations
6. Data Sheet — the single source of truth. Paste your case-level data here in the same column format and the dashboard updates automatically after Refresh All.
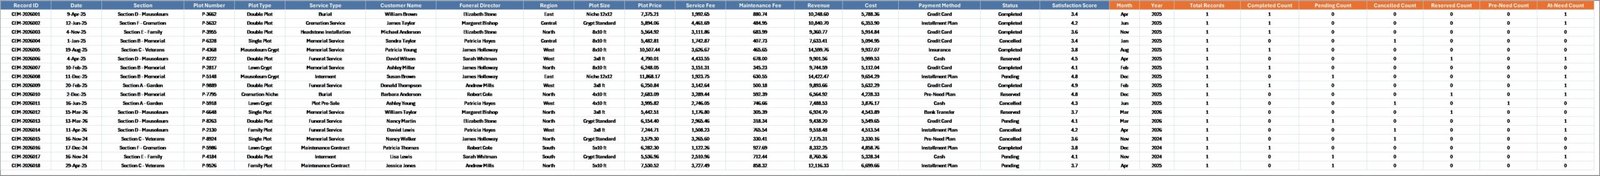
Data Sheet tab
7. Support Sheet — the engine room. Holds all pivot tables that feed the charts. Click Data → Refresh All after editing data and every pivot, chart, and KPI rebuilds. Hide this sheet from end users. Microsoft has detailed documentation on how to refresh PivotTable data if you want a deeper explainer.
Support Sheet tab
Cemetery Dashboard in Excel vs. Google Sheets Equivalent vs. Paid Cemetery SaaS — Feature Comparison
| Feature | Cemetery Dashboard in Excel | Google Sheets Equivalent | Paid Cemetery SaaS (PlotBox / CIMS / Chronicle) |
|---|---|---|---|
| Cost | $17.99 one-time ✅ | $10–$25 one-time | $150–$500 / user / month |
| Platform | Microsoft Excel (offline) ✅ | Google Sheets (browser) | Web-based proprietary platform |
| Setup time | Under 10 minutes ✅ | 15–20 minutes | 4–12 weeks implementation |
| 5 dashboard pages with slicers | ✅ Included | Limited (pivots only) | ✅ Full (locked behind license) |
| Edit charts and KPIs yourself | ✅ Full control | ✅ Full control | ❌ Vendor only |
| Works offline | ✅ Yes | ❌ Internet required | ❌ Internet required |
| Per-user fees | ❌ None ✅ | ❌ None | $150+ per user / month |
| Year-1 cost at 5 users | $17.99 total ✅ | $10–$25 total | $9,000–$30,000+ |
| Pre-need vs at-need analysis | ✅ Built-in | Configurable | ✅ Configurable |
For small and mid-size cemeteries and funeral homes that want clean reporting without paying $9,000+ per year for enterprise software, the Cemetery Dashboard in Excel sits in the sweet spot.
Who Should Use This Template
Perfect for:
- Cemetery and funeral home owners running 1–5 locations who want a single monthly view of revenue, cost, plot sales, and case counts.
- Cemetery office managers tracking pre-need vs at-need mix, payment methods, and funeral director performance.
- Family-owned memorial businesses moving away from paper logs to one consolidated Excel file.
- Bookkeepers and accountants preparing monthly reports for cemetery boards, trustees, or family councils.
- Memorial-park operators who want clean charts for board meetings without learning Power BI or Tableau.
Not a fit if:
- You run a 50+ location cemetery group needing GIS plot maps, integrated CRM, and multi-location user permissions — evaluate PlotBox or CIMS instead.
- You need real-time multi-user editing in the cloud with audit logs (consider the Google Sheets equivalent or paid SaaS).
- You want automatic data sync from POS, payment processors, or ERP systems — this template is manual data entry only.
Real-World Use Cases
Maria runs a 12-acre family cemetery in upstate New York. Before this dashboard she pulled monthly numbers together from 4 different spreadsheets every quarter. She now uses the Cemetery Dashboard to track plot sales by section, monitor pre-need program growth, and present a one-page revenue summary to her board every quarter — without paying $4,200/year for a cemetery management subscription. The Plot Analysis page alone helped her spot two underperforming sections she should reprice.
James is the office manager at a 3-location memorial group in Texas. He uses the Operations and Service Analysis pages to compare cases per funeral director, spot which payment methods are slowing collections (cheques are running 12 days slower than card payments at his sites), and identify the most profitable service type each month. The dashboard sits on his shared drive and any of his 3 location managers can refresh it.
Priya is a bookkeeper handling 4 small funeral homes in Mumbai. She drops monthly case data from each location into the Data Sheet, refreshes once, and produces clean PDF reports for each owner the same afternoon — replacing 4 separate Excel files she used to maintain by hand. Total time for her monthly close dropped from 2 days to 4 hours.
Advantages of Cemetery Dashboard in Excel
💰 Replaces $4,000–$30,000/year SaaS subscriptions for the reporting layer. You still get a polished, slicer-driven dashboard, just at a one-time cost.
⏱️ Cuts monthly close time — instead of stitching numbers from multiple sheets, you maintain one Data Sheet and the dashboard rebuilds itself.
🔓 Fully unlocked file — no protection, no hidden formulas, no macros. Edit any chart, add new KPIs, change colors to match your brand.
📴 Works completely offline — important for older cemetery offices where reliable internet is not a given.
🧾 Print-ready — every tab is page-formatted for board reports and trustee meetings.
Opportunities for Improvement
Honest take: this template is a reporting layer, not a full cemetery management system. It does not include plot inventory mapping, GIS integration, online ordering, or contract management. If you need those, you should pair this dashboard with PlotBox, CIMS, or build a custom Access database.
The Data Sheet is also manual entry — no API, no auto-sync from your POS or payment processor. For most small operators that is fine, but if you process 100+ cases per month it can become tedious.
Finally, the dashboard tracks 11 dimensions out of the box (Region, Status, Plot Type, Section, Plot Size, Service Type, Funeral Director, Payment Method, Year, Month, Pre-Need flag). If you need additional dimensions like religion, package, or insurance carrier, you will need to add a column in the Data Sheet and a pivot field in the Support Sheet.
Best Practices
📌 Lock in your column headers on Day 1 — once the dashboard is set up, do not rename columns in the Data Sheet. The pivots reference exact column names.
📌 Use the Status field consistently — pick a finite list (Pre-Need, At-Need, Paid, Pending, Cancelled) and stick to it. Inconsistent values will fragment your charts.
📌 Refresh once per month, not per row — paste a full month of data in one go, then click Data → Refresh All once. Refreshing on every row is slow.
📌 Hide the Support Sheet before sharing — right-click the tab → Hide. Your board does not need to see the engine.
📌 Save a clean master copy — keep an empty version with just the headers. Each year, copy it and start fresh so historical files stay isolated.
📌 Back up the file weekly — Excel files corrupt occasionally. A weekly OneDrive or Dropbox backup is enough to protect 6 months of data.
Explore Relevant Templates
📌 Yoga & Wellness Studio Dashboard in Excel — another service-business Excel dashboard with the same multi-page slicer-driven layout.
📌 B&B Dashboard in Power BI — Power BI version of a small-business operations dashboard.
📌 Cleaning Service Dashboard in Google Sheets — Google Sheets version of a service-business revenue dashboard.
📌 Event Management Report in Excel — complementary event tracking for memorial events and services.
📌 Catering Business KPI Scorecard in Excel — useful for funeral homes that handle reception catering.
📌 Browse all Excel Dashboard Templates on NextGenTemplates.
Frequently Asked Questions
What KPIs does the Cemetery Dashboard in Excel track?
The Cemetery Dashboard in Excel tracks 5 main KPIs on the Overview page — Total Revenue, Net Profit, Total Cases, Total Plot Sales, and Avg. Satisfaction. It also analyzes Profit Margin %, cases by status, revenue by region, plot type, section, plot size, service type, funeral director, payment method, and pre-need percentage by region.
How long does setup take?
Setup takes under 10 minutes for the Cemetery Dashboard in Excel. Open the file, paste your case-level data into the Data Sheet using the same column format, then click Data → Refresh All. Every chart, KPI card, and slicer rebuilds automatically across all 5 dashboard pages.
Do I need Excel macros or VBA enabled?
No. The Cemetery Dashboard in Excel uses only native pivot tables, charts, and slicers — no macros and no VBA. It works in Microsoft Excel 2016, 2019, 2021, and Microsoft 365 on both Windows and Mac, and you do not need to enable any security exceptions.
How does this compare to PlotBox or CIMS?
PlotBox and CIMS are full cloud-based cemetery management systems with GIS plot maps, CRM, and online ordering — and they cost $150–$500 per user per month. The Cemetery Dashboard in Excel is a one-time $17.99 reporting layer for revenue, cases, plot sales, and director performance. It complements, not replaces, full-platform software for small operators.
Can I customize charts and add my own KPIs?
Yes. Every chart in the Cemetery Dashboard in Excel is a standard Excel pivot chart driven from the Support Sheet. You can edit colors, change chart types, add new measures, or insert your own KPI cards. The file is unlocked — no protection, no hidden formulas.
Will the dashboard work for funeral homes that do not sell plots?
Yes, partially. The Cemetery Dashboard in Excel was built for combined cemetery + funeral operations, so the Service Analysis, Operations, and Sales Trend pages apply to any funeral home. The Plot Analysis page is most useful when you sell plots — funeral-only operators can hide that tab.
Is this a one-time purchase or subscription?
The Cemetery Dashboard in Excel is a one-time purchase. You pay $17.99 once, download the file instantly, and own it for life. No monthly fees, no per-user charges, no expiry — and you can use it on as many computers and as many cemetery sites as you operate.
About the Author
Built by PK — Microsoft Certified Professional with 15+ years of Excel, Google Sheets, and Power BI experience. Founder of NextGenTemplates, reaching 300K+ subscribers across YouTube channels. Every template is hand-built and tested before release.
Conclusion
The Cemetery Dashboard in Excel gives small and mid-size cemetery operators, funeral home owners, and bookkeepers a 5-page interactive reporting layer for revenue, profit, plot sales, services, and operations — at a one-time $17.99 cost instead of $9,000+ per year for enterprise software. Setup takes under 10 minutes. Maintenance is one Refresh All click per month.
👉 Click here to Purchase Cemetery Dashboard in Excel
✅ Instant download · One-time payment · No subscription
🎥 Visit our YouTube channel for step-by-step Excel and dashboard tutorials: YouTube.com/@PK-AnExcelExpert
📅 Last updated: April 2026