The Cemetery Dashboard in Power BI tracks 5 KPI cards and 13 interactive visuals across 5 report pages — Overview, Sales Trend, Plot Analysis, Service Analysis, and Operations — with multiple slicers for region, status, plot type, service type, funeral director, and payment method. Setup takes under 10 minutes — point Power BI Desktop at your case data, click Refresh, and every visual updates automatically.
🌍 Join 8,400+ teams in 40+ countries using NextGenTemplates to replace paid SaaS tools with one-time-purchase Excel, Google Sheets, Power BI, and HTML templates.
✅ Instant download · One-time payment · No subscription · No per-user fees · Lifetime access

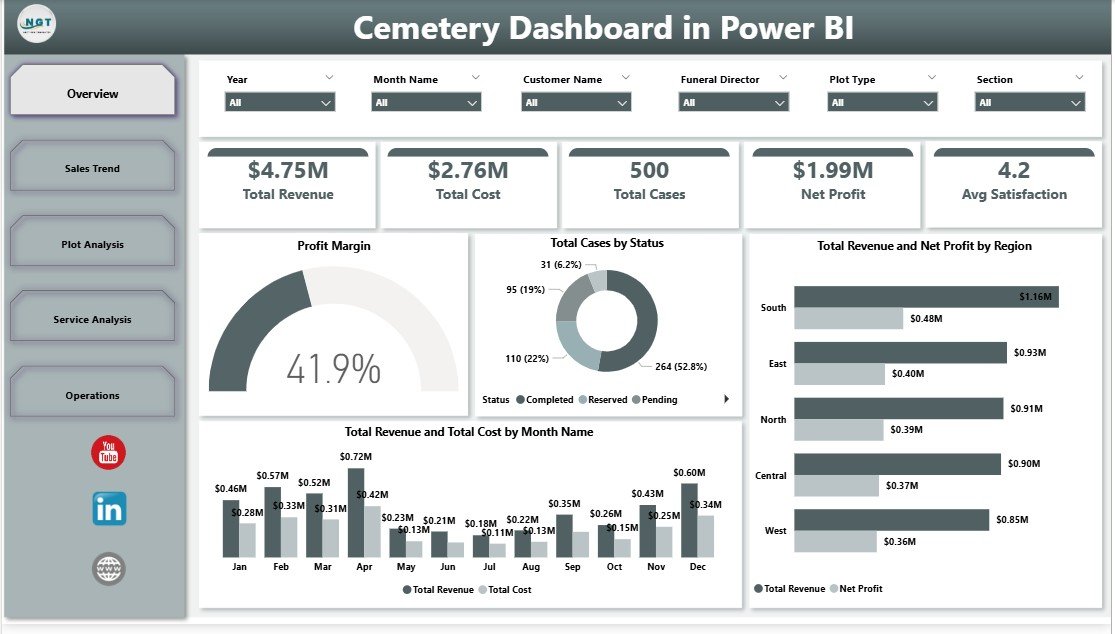
Cemetery Dashboard in Power BI — Overview Page
Introduction to the Cemetery Dashboard in Power BI
Running a cemetery or funeral home today means tracking dozens of moving parts — case counts, plot sales by section, pre-need program growth, payment collection cycles, and funeral director productivity. Most small operators do this in a stack of disconnected spreadsheets or pay $4,000–$30,000 per year for a full cemetery management platform.
The Cemetery Dashboard in Power BI is built for the middle ground: it gives you the analytics layer of an enterprise BI rollout without the per-user license cost or the multi-week implementation cycle. Point Power BI Desktop at your case-level data, click Refresh, and you get a 5-page interactive Power BI report covering revenue, profit, plot sales, services, and operations — ready for board meetings, trustee reports, or board-of-family-management reviews.
According to the National Funeral Directors Association’s industry research, the average funeral home now operates on tighter margins than ever as cremation rates climb above 60% in the United States. That makes Profit Margin, Pre-Need vs At-Need mix, and Service Type analysis more important than ever — exactly what this Power BI dashboard surfaces with cross-filtering across all 5 pages.
Key Features of Cemetery Dashboard in Power BI
📊 5 high-level KPI cards on the Overview page — Total Revenue, Total Cost, Total Cases, Net Profit, and Avg Satisfaction. Every card recalculates the moment you click a slicer or refresh new case data, so every view reflects live numbers.
📈 13 interactive Power BI visuals across 5 pages — Profit Margin, Total Cases by Status, Total Revenue and Net Profit by Region, Total Revenue and Total Cost by Month, Total Cases by Month, Total Revenue by Plot Type, Section, Service Type, Funeral Director, Payment Method, and Net Profit by Service Type.
🎚️ Multiple slicers for instant filtering — slice the entire report by Region, Status, Plot Type, Service Type, Funeral Director, Payment Method, or Year. Slicers use Power BI’s native cross-filtering engine, documented in the official Microsoft Power BI slicer guide.
💰 Revenue, Cost, and Profit tracking — five KPI cards plus dedicated Profit Margin and “Revenue vs Net Profit by Region” visuals make it easy to spot which regions and months actually make money after operating cost.
🏷️ Plot Analysis page — Total Revenue by Plot Type, Total Revenue by Section, and Net Profit by Section identify high-margin sections and underperforming inventory at a glance.
🧑💼 Funeral Director scorecard — compare director productivity across burial, cremation, and memorial services in a single Service Analysis page.
📱 Mobile and team sharing ready — built on free Power BI Desktop, but publish the .pbix to Power BI Service and your board or trustees can open the report from a browser or the Power BI mobile app.
Dashboard Pages Explanation
1. Overview Page — Cards: Total Revenue, Total Cost, Total Cases, Net Profit, Avg Satisfaction. Visuals: Profit Margin, Total Cases by Status, Total Revenue and Net Profit by Region, Total Revenue and Total Cost by Month Name. Slicers at the top filter the whole page in one click, and cross-filtering between visuals is enabled by default.
Cemetery Dashboard in Power BI
2. Sales Trend — track yearly and monthly performance: Total Cases by Month Name, Total Revenue by Month Name, and Net Profit by Month Name. This is the page you take to your monthly board review or trustee meeting.
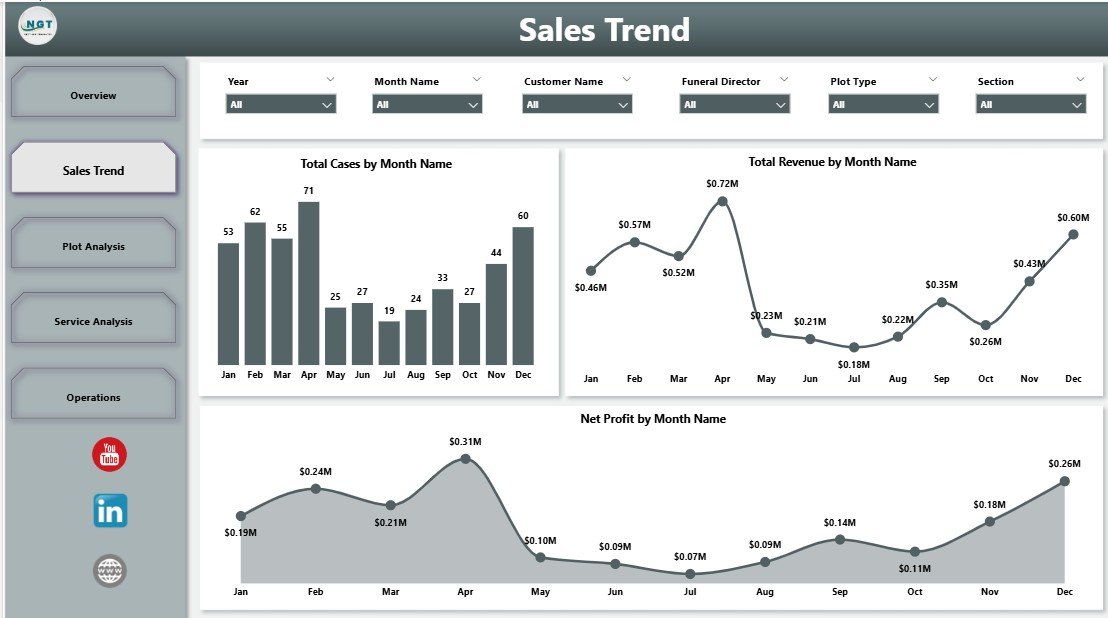
Sales Trend
3. Plot Analysis — see where the money is coming from: Total Revenue by Plot Type, Total Revenue by Section, and Net Profit by Section. Identify high-margin sections and underperforming plot inventory at a glance for quarterly repricing decisions.
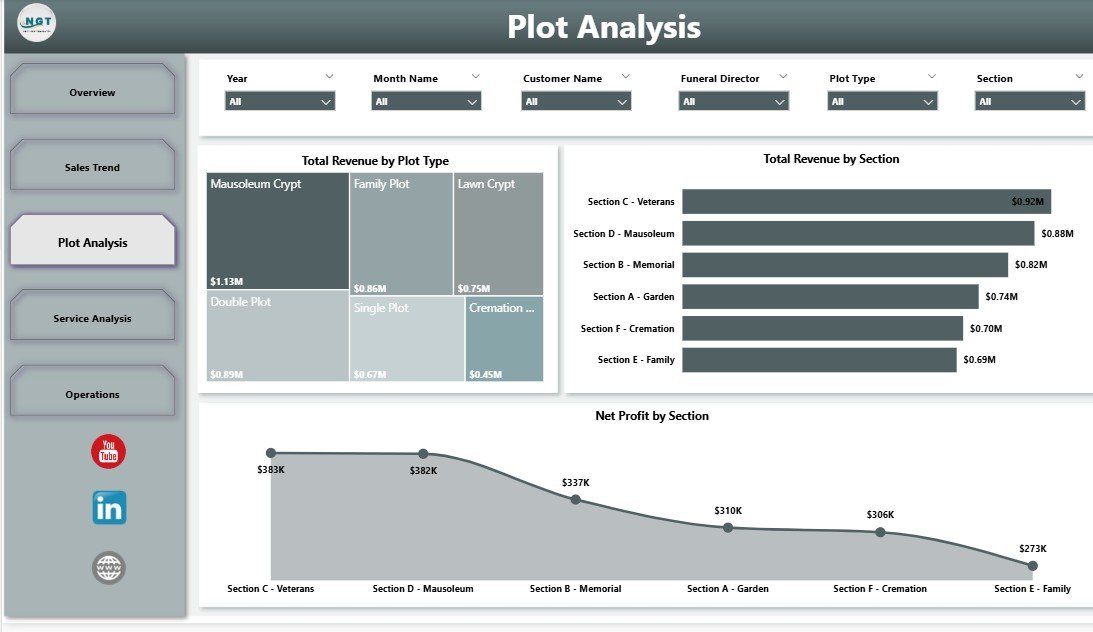
Plot Analysis
4. Service Analysis — Total Revenue by Service Type, Net Profit by Service Type, and Total Revenue by Funeral Director. Compare director productivity and profitability across burial, cremation, and memorial services in one page.
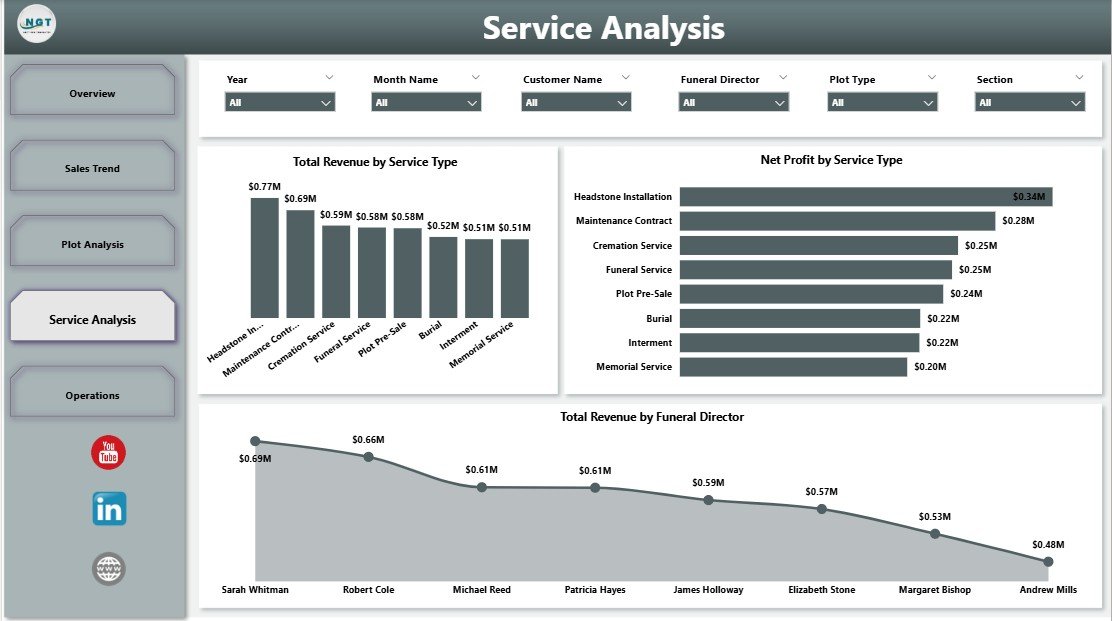
Service Analysis
5. Operations — Total Cases by Region, Total Revenue by Status, and Total Revenue by Payment Method. Use this view for financial planning, regional capacity decisions, and pre-need vs at-need mix tracking.
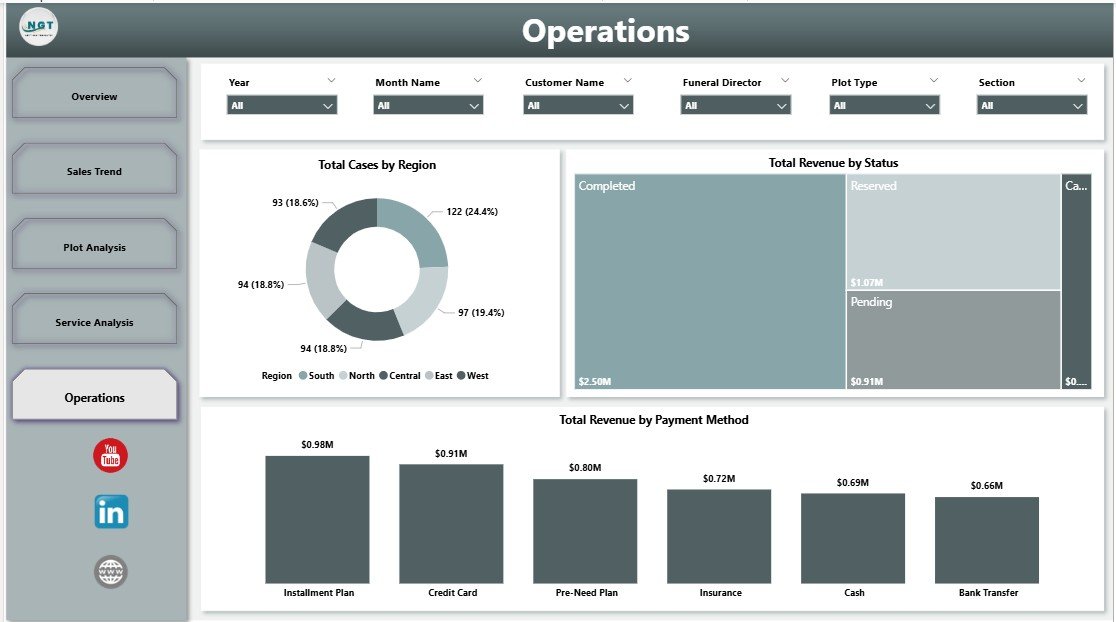
Operations
Cemetery Dashboard in Power BI vs. Tableau Cemetery Template vs. Paid Cemetery SaaS — Feature Comparison
| Feature | Cemetery Dashboard in Power BI | Tableau Cemetery Template | Paid Cemetery SaaS (PlotBox / CIMS / Chronicle) |
|---|---|---|---|
| Cost | $17.99 one-time ✅ | $15–$70 / user / month (Tableau license) | $150–$500 / user / month |
| Platform | Power BI Desktop (free) ✅ | Tableau Desktop / Cloud | Web-based proprietary platform |
| Setup time | Under 10 minutes ✅ | 1–2 hours (data model setup) | 4–12 weeks implementation |
| 5 cemetery-specific report pages | ✅ Built-in | Build from scratch | Fixed reports, vendor-defined |
| Edit visuals and DAX yourself | ✅ Fully editable | ✅ Fully editable | ❌ Vendor only |
| Mobile access | ✅ Power BI mobile app | ✅ Tableau Mobile | ✅ Native app |
| Per-user fees | ❌ None for desktop ✅ | $15+ / user / month | $150+ / user / month |
| Year-1 cost (1 user, 1 site) | $17.99 total ✅ | $180–$840+ | $1,800–$6,000+ |
| Pre-need vs at-need analysis | ✅ Built-in | Configurable | ✅ Configurable |
For independent cemeteries, funeral homes, and memorial parks that want professional Power BI analytics without paying $1,800+ per year for a BI license or $9,000+ per year for enterprise SaaS, the Cemetery Dashboard in Power BI sits in the sweet spot.
Who Should Use This Template
Perfect for:
- Cemetery and funeral home owners running 1–5 locations who want Power BI analytics without hiring a BI consultant.
- Cemetery office managers tracking pre-need vs at-need mix, payment methods, plot section profitability, and funeral director performance from a single .pbix file.
- Memorial-park operators presenting interactive, drillable revenue and cost reports to a board, trustees, or family-management committee.
- Bookkeepers and accountants delivering Power BI deliverables to small cemetery and funeral home clients.
- Cemetery and mortuary-science students learning Power BI through a real-world cemetery dataset.
Not a fit if:
- You run a 50+ location cemetery group needing GIS plot maps, integrated CRM, and multi-location user permissions — evaluate PlotBox or CIMS instead.
- You don’t have Power BI Desktop installed or aren’t comfortable refreshing a data source.
- You want automatic data sync from POS, payment processors, or ERP systems — this template uses manual data entry against a structured table.
Real-World Use Cases
Maria runs a 12-acre family cemetery in upstate New York. Before this dashboard she pulled monthly numbers together from 4 different spreadsheets every quarter. She now uses the Cemetery Dashboard in Power BI to track plot sales by section, monitor pre-need program growth, and present an interactive report to her board every quarter — without paying $4,200/year for a cemetery management subscription. The Plot Analysis page alone helped her spot two underperforming sections that needed repricing before next season.
James is the office manager at a 3-location memorial group in Texas. He uses the Service Analysis and Operations pages to compare cases per funeral director, watch which payment methods are slowing collections (cheques are running 12 days slower than card payments at his sites), and identify the most profitable service type each month. He published the .pbix to Power BI Service so all 3 location managers can open the same live report from any browser.
Priya is a bookkeeper handling 4 small funeral homes in Mumbai. She refreshes each client’s monthly case data, exports the Plot Analysis and Service Analysis pages to PDF from Power BI, and produces clean reports for each owner the same afternoon — replacing 4 separate spreadsheets she used to maintain by hand. Total time for her monthly close dropped from 2 days to 4 hours.
Advantages of Cemetery Dashboard in Power BI
💰 Replaces $4,000–$30,000/year SaaS subscriptions for the analytics layer. You still get a polished, slicer-driven Power BI report — just at a one-time cost.
⏱️ Cuts monthly close time — instead of stitching numbers from multiple sheets, you maintain one data source and the Power BI report rebuilds itself on Refresh.
🔓 Fully unlocked .pbix file — no protection, no hidden DAX, no encryption. Edit any visual, add new measures, change colors to match your brand.
📱 Mobile and team-friendly — publish to Power BI Service and any team member with access can open the report from a browser or the Power BI mobile app.
🧾 Print-and-export ready — every Power BI page can be exported to PDF or PowerPoint for board reports and trustee meetings.
Opportunities for Improvement
Honest take: this template is a Power BI analytics layer, not a full cemetery management system. It does not include plot inventory mapping, GIS integration, online ordering, or contract management. If you need those, pair this dashboard with PlotBox, CIMS, or build a custom backend.
The data source is also manual entry — there is no API, no auto-sync from your POS or payment processor. For most small operators that is fine, but if you process 100+ cases per month it can become tedious.
Finally, the dashboard tracks roughly 11 dimensions out of the box (Region, Status, Plot Type, Section, Service Type, Funeral Director, Payment Method, Year, Month, plus pre-need flag and satisfaction score). If you need additional dimensions like religion, package, or insurance carrier, you will need to add a column in the data source and a corresponding measure in the Power BI model.
Best Practices
📌 Lock in your column headers on Day 1 — once the Power BI model is set up, do not rename source columns. The Power BI queries reference exact column names.
📌 Use the Status field consistently — pick a finite list (Pre-Need, At-Need, Paid, Pending, Cancelled) and stick to it. Inconsistent values fragment your visuals.
📌 Refresh once per month, not per row — load a full month of data, then click Refresh once. Refreshing on every row is slower than necessary.
📌 Publish to Power BI Service for team access — once published, you control who sees the report and can schedule automatic dataset refresh. Microsoft has a detailed guide on scheduling Power BI dataset refresh.
📌 Save a clean master copy of the .pbix — keep an empty version with just the data model intact. Each year, copy it and start fresh so historical files stay isolated.
📌 Back up the .pbix weekly — Power BI files are essentially zipped JSON and can corrupt occasionally. A weekly OneDrive or SharePoint backup is enough to protect 6 months of work.
Explore Relevant Templates
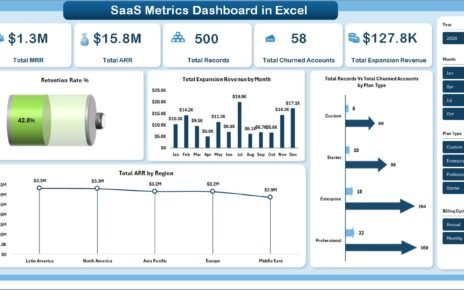
📌 Cemetery Dashboard in Excel — same 5-page cemetery analytics, built in Excel with pivot tables, slicers, and a Data Sheet for those who prefer spreadsheet workflows.
📌 Yoga & Wellness Studio Dashboard in Power BI — another service-business Power BI dashboard with the same multi-page slicer-driven layout.
📌 B&B Dashboard in Power BI — Power BI version of a small-business operations dashboard with channel and revenue tracking.
📌 Customer Support SLA KPI Dashboard in Power BI — for cemetery and funeral home customer service teams tracking response times and SLAs.
📌 Browse all Power BI Dashboard Templates on NextGenTemplates.
Frequently Asked Questions
What KPIs does the Cemetery Dashboard in Power BI track?
The Cemetery Dashboard in Power BI tracks 5 main KPIs on the Overview page — Total Revenue, Total Cost, Total Cases, Net Profit, and Avg Satisfaction. It also analyzes Profit Margin, cases by status, revenue and profit by region, plot type, section, service type, funeral director, payment method, and monthly trend across all 5 report pages.
How long does setup take for the Cemetery Dashboard in Power BI?
Setup takes under 10 minutes. Open the .pbix in Power BI Desktop, point the data source at your cemetery and funeral case data using Transform Data → Data Source Settings, click Refresh, and the entire Cemetery Dashboard in Power BI updates automatically with no DAX changes required.
Do I need a paid Power BI license to use this template?
No. The Cemetery Dashboard in Power BI runs entirely on free Power BI Desktop for Windows. A Power BI Pro license is only needed if you want to publish the report to Power BI Service for online team sharing — single-user desktop use is completely free.
How does this compare to PlotBox or CIMS?
PlotBox and CIMS are full cloud-based cemetery management systems with GIS plot maps, CRM, genealogy lookups, and online ordering — and they cost $150–$500 per user per month. The Cemetery Dashboard in Power BI is a one-time $17.99 analytics layer for revenue, cases, plot sales, and director performance. It complements, not replaces, full-platform software for small operators.
Can I customize the regions, plot types, and service types?
Yes. Add or rename any region, plot type, section, service type, funeral director, or payment method directly in your data source, click Refresh, and the Cemetery Dashboard in Power BI adapts automatically. No DAX edits or data model changes are needed for new categories.
Will the dashboard work for funeral homes that do not sell plots?
Yes, partially. The Cemetery Dashboard in Power BI was built for combined cemetery and funeral operations, so the Overview, Sales Trend, Service Analysis, and Operations pages apply to any funeral home. The Plot Analysis page is most useful when you sell plots — funeral-only operators can hide that page.
Is this a one-time purchase or subscription?
The Cemetery Dashboard in Power BI is a one-time $17.99 purchase with lifetime access — no subscription, no per-user fees, no expiry. You receive an instant download immediately after checkout and can use it across as many cemetery sites and funeral homes as you operate.
About the Author
Built by PK — Microsoft Certified Professional with 15+ years of Excel, Google Sheets, and Power BI experience. Founder of NextGenTemplates, reaching 300K+ subscribers across YouTube channels. Every template is hand-built and tested before release.
Conclusion
The Cemetery Dashboard in Power BI gives small and mid-size cemetery operators, funeral home owners, and bookkeepers a 5-page interactive Power BI report covering revenue, profit, plot sales, services, and operations — at a one-time $17.99 cost instead of $1,800+ per year for a Tableau license or $9,000+ per year for enterprise cemetery SaaS. Setup takes under 10 minutes. Maintenance is one Refresh click per month.
👉 Click here to Purchase Cemetery Dashboard in Power BI
✅ Instant download · One-time payment · No subscription
🎥 Visit our YouTube channel for step-by-step Excel, Power BI, and dashboard tutorials: YouTube.com/@PK-AnExcelExpert
📅 Last updated: April 2026