The Photography Business Dashboard in Excel tracks 5 KPI cards and 16 charts across 5 interactive pages — covering booking channels, photographer performance, service profitability, and regional revenue. Photography studios lose an average of 15–20% of potential profit from under-analyzed service lines; this template gives you the data to fix that. Setup takes under 10 minutes, and every chart refreshes automatically when you update the data sheet.
🌍 Join 8,400+ teams in 40+ countries using NextGenTemplates to replace paid SaaS tools with one-time-purchase Excel templates — instant download, no subscription, no per-user fees.
👉 Click here to Purchase the Photography Business Dashboard in Excel
Key Features of Photography Business Dashboard in Excel
The Photography Business Dashboard in Excel delivers five analyst-grade insights in a single file:
- 5 KPI Cards on the Overview page — Total Bookings, Total Revenue, Total Cost, Net Profit, and Average Satisfaction score. All cards calculate automatically from your data sheet entries.
- 16 pre-built charts across 5 dashboard pages — every page has 4 charts covering a distinct business angle: booking trends, service insights, photographer performance, and profitability.
- Dynamic slicers for instant filtering — filter by booking channel, region, package type, service type, or payment status. Every chart on that page updates simultaneously.
- Photographer-level tracking — Revenue per Hour, Total Photos Delivered, and Satisfaction score per photographer, so you know exactly which team members are driving the most profitable work.
- Pivot-table architecture — the Support sheet holds all pivot tables. Click Data → Refresh All after updating your data, and the entire dashboard refreshes in seconds.
Microsoft Excel 2016 or later (Windows or Mac) is required. No macros, no add-ins, no internet connection needed once downloaded. For a detailed overview of Excel pivot table best practices, refer to Microsoft’s official PivotTable documentation.
Dashboard Pages Explanation
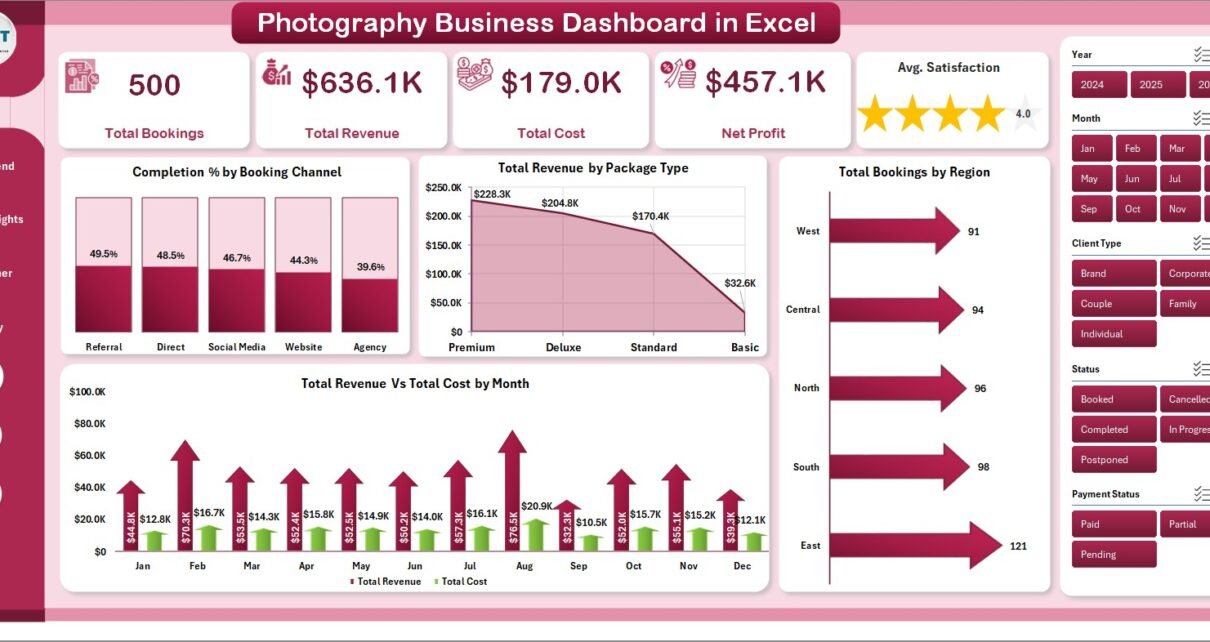
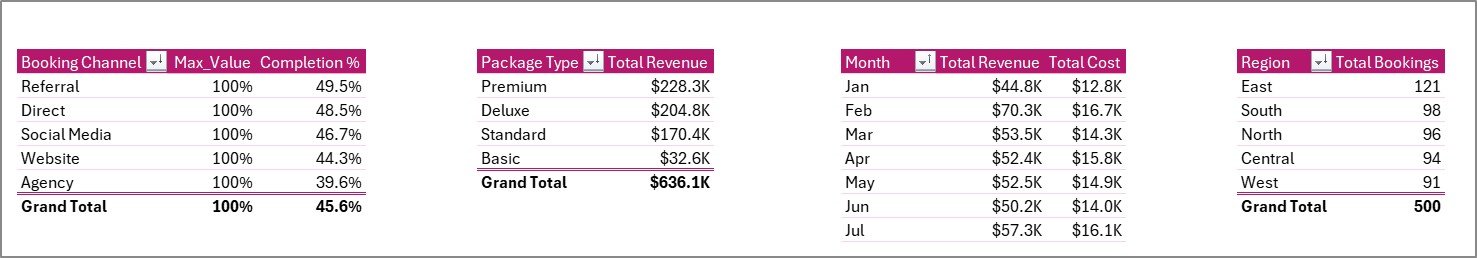
1. Overview Page
The Overview page is the command center. Five KPI cards give a real-time snapshot of Total Bookings, Total Revenue, Total Cost, Net Profit, and Average Satisfaction. Four charts break down performance at a high level: Completion % by Booking Channel, Total Revenue by Package Type, Total Bookings by Region, and Total Revenue vs Total Cost by Month. Multiple slicers allow filtering by channel, region, or period instantly.
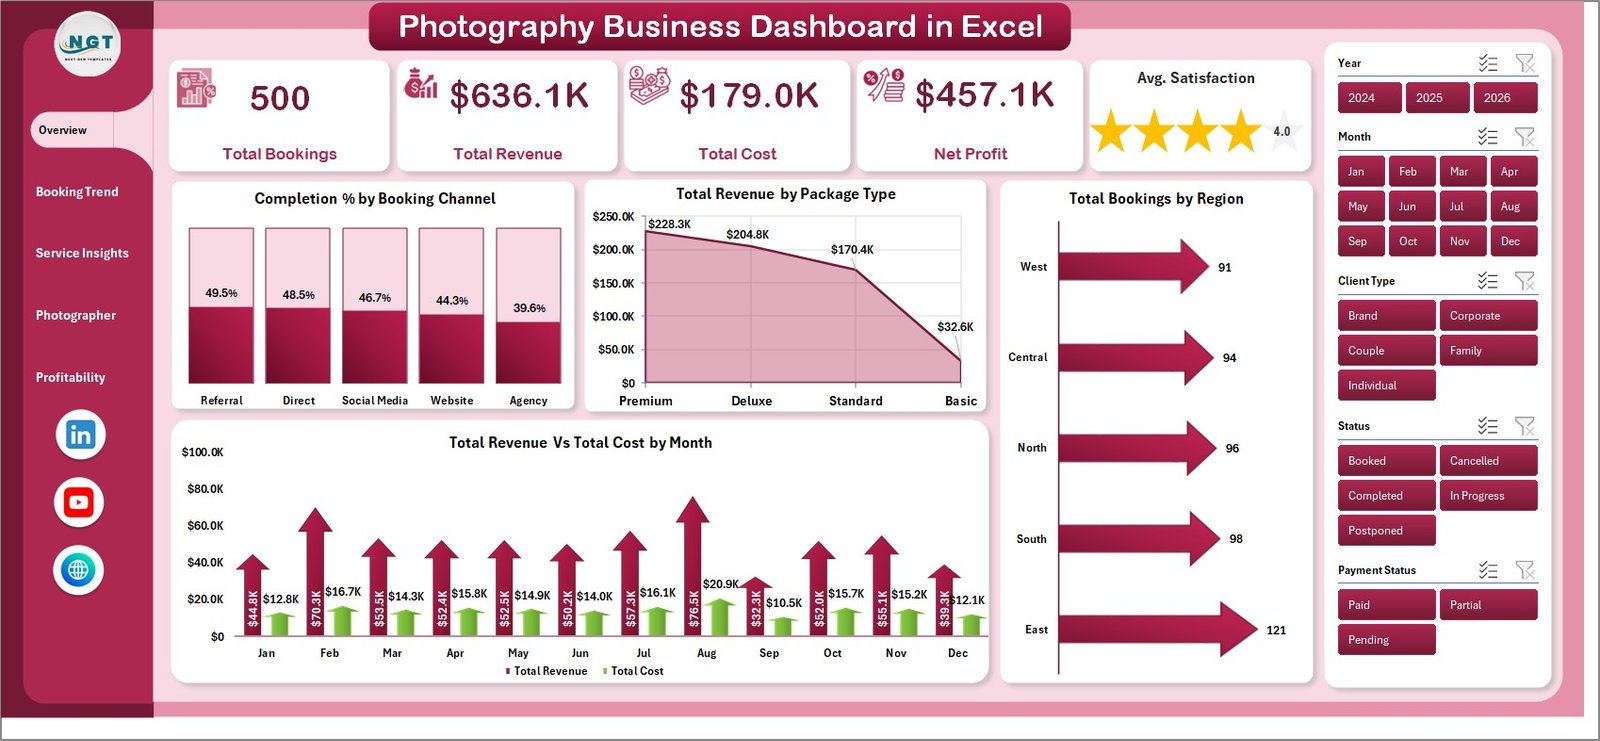
Overview Page
2. Booking Trend Page
The Booking Trend page digs into how revenue and cost are distributed across channels. Four charts cover: Total Revenue by Booking Channel, Profit Margin % by Region, Total Bookings by Payment Status, and Total Cost vs Total Revenue by Booking Channel. This page answers the question every studio owner asks: which channel is most profitable, not just most popular?
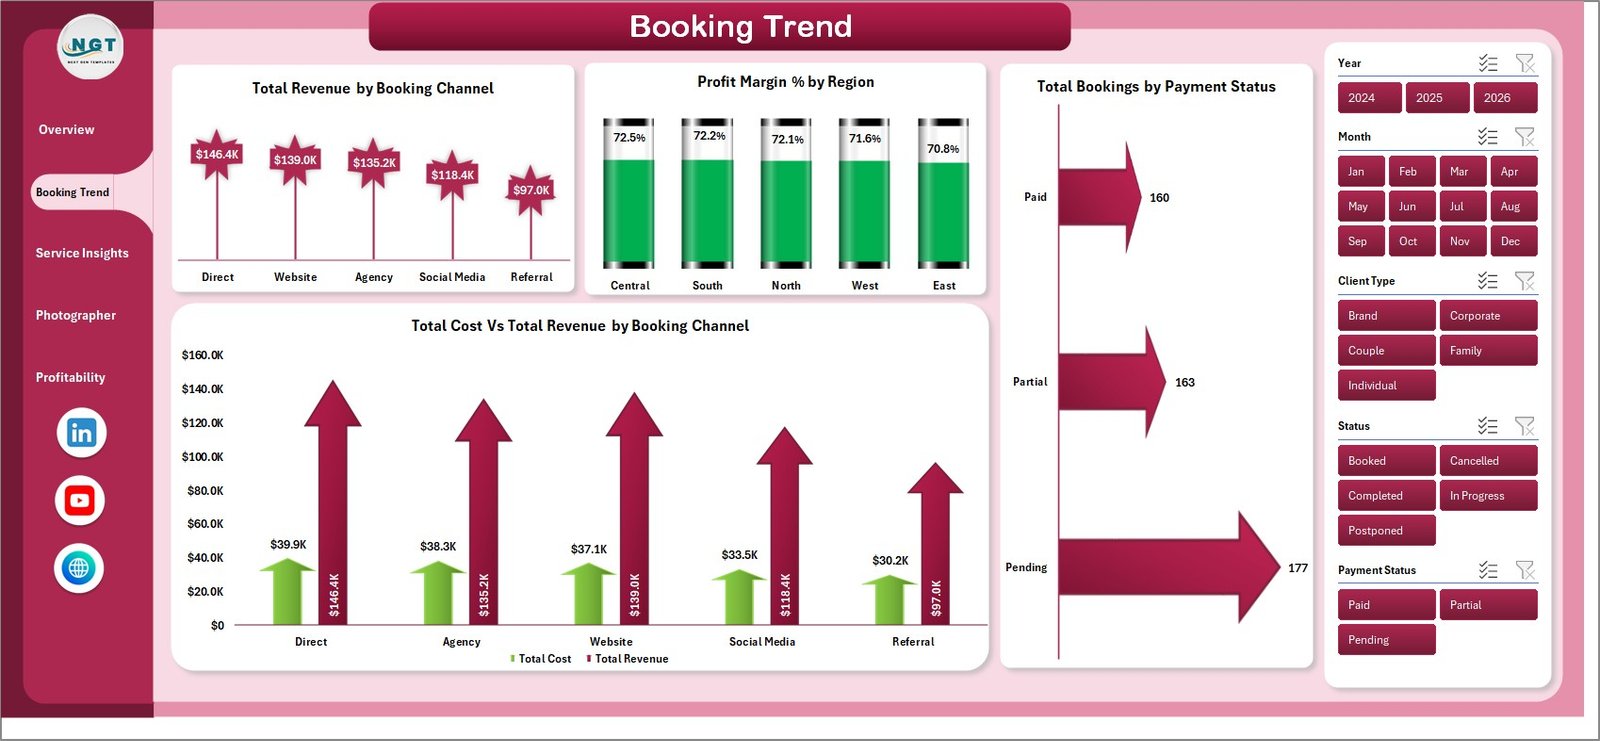
Booking Trend Page
3. Service Insights Page
The Service Insights page analyzes performance across service categories and client types: Profit Margin % by Client Type, Net Profit by Package Type, Total Bookings by Service Type, and Total Revenue vs Total Cost by Service Type. Use this page to identify which packages generate the highest margins and which client segments are most valuable.
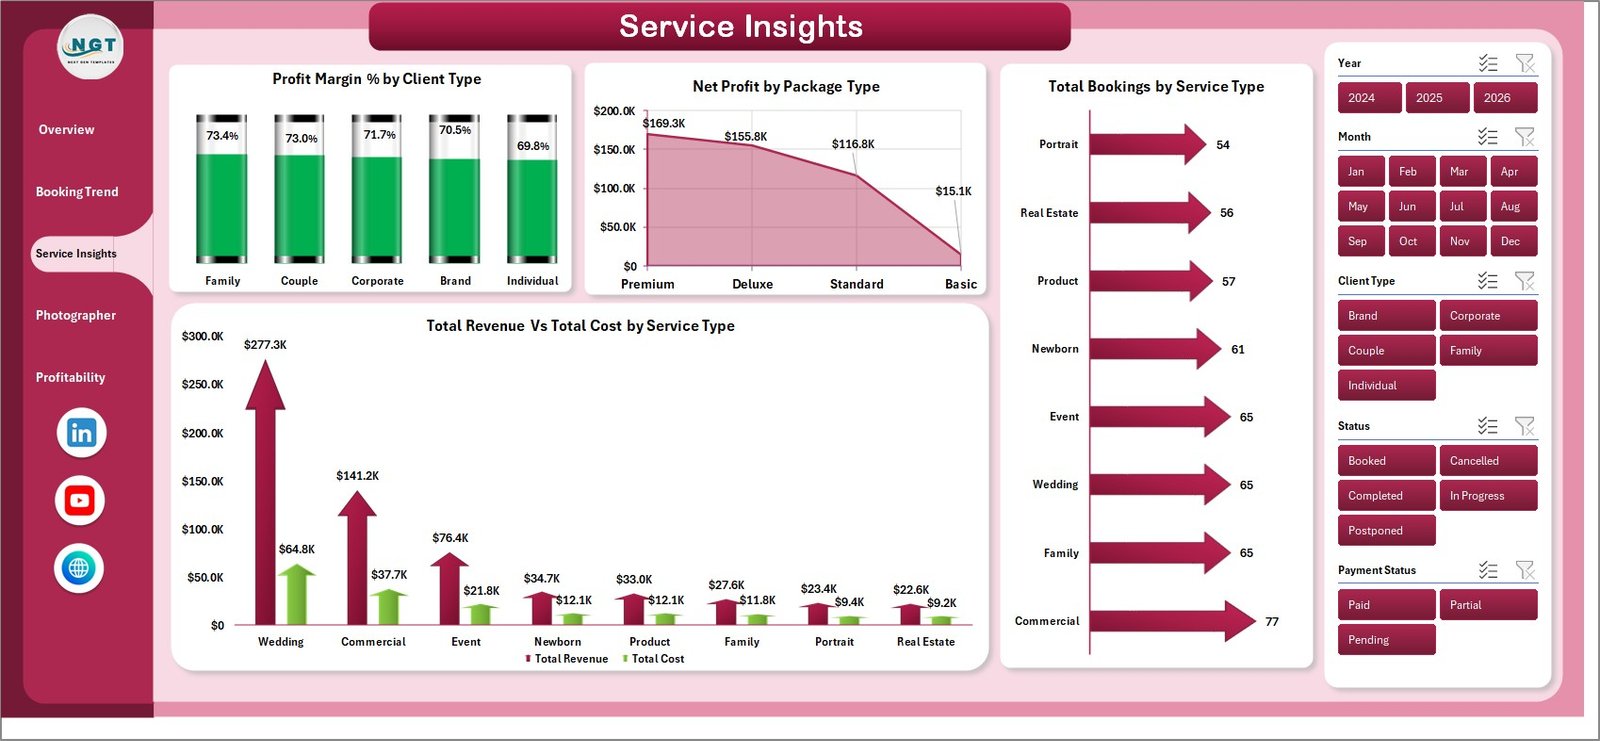
Service Insights Page
4. Photographer Page
The Photographer page tracks individual team member performance with four charts: Avg. Satisfaction by Photographer, Revenue per Hour by Photographer, Total Photos by Photographer, and Total Revenue vs Total Cost by Photographer. Studio managers can use this to make informed scheduling, training, and compensation decisions.
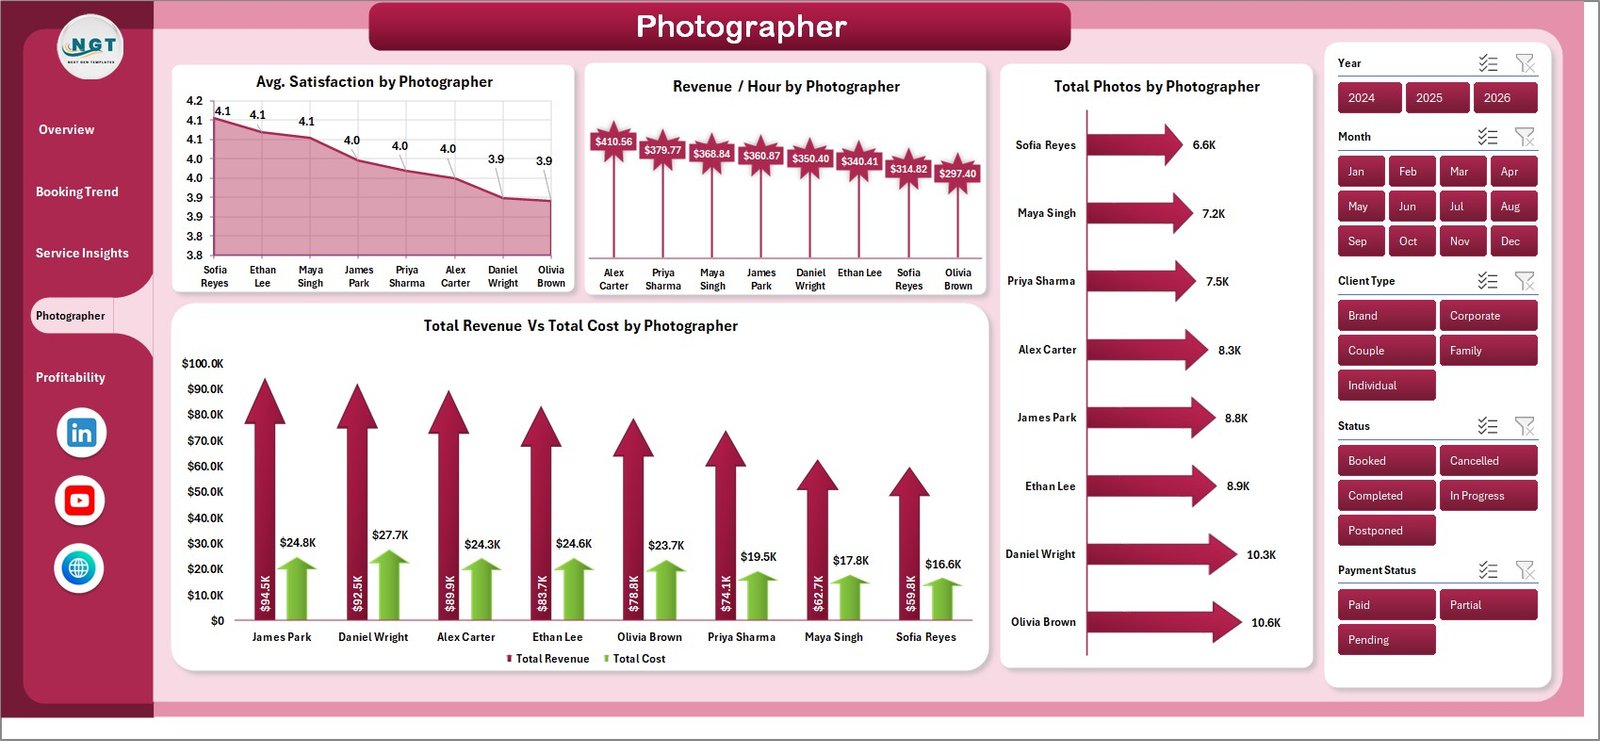
Photographer Performance Page
5. Profitability Page
The Profitability page drills into margins by geography and service mix: Net Profit by Region, Total Cost by Package Type, Net Profit by City, and Profit Margin % by Service Type. This page surfaces which cities and service types you should double down on — and which are quietly draining margin.
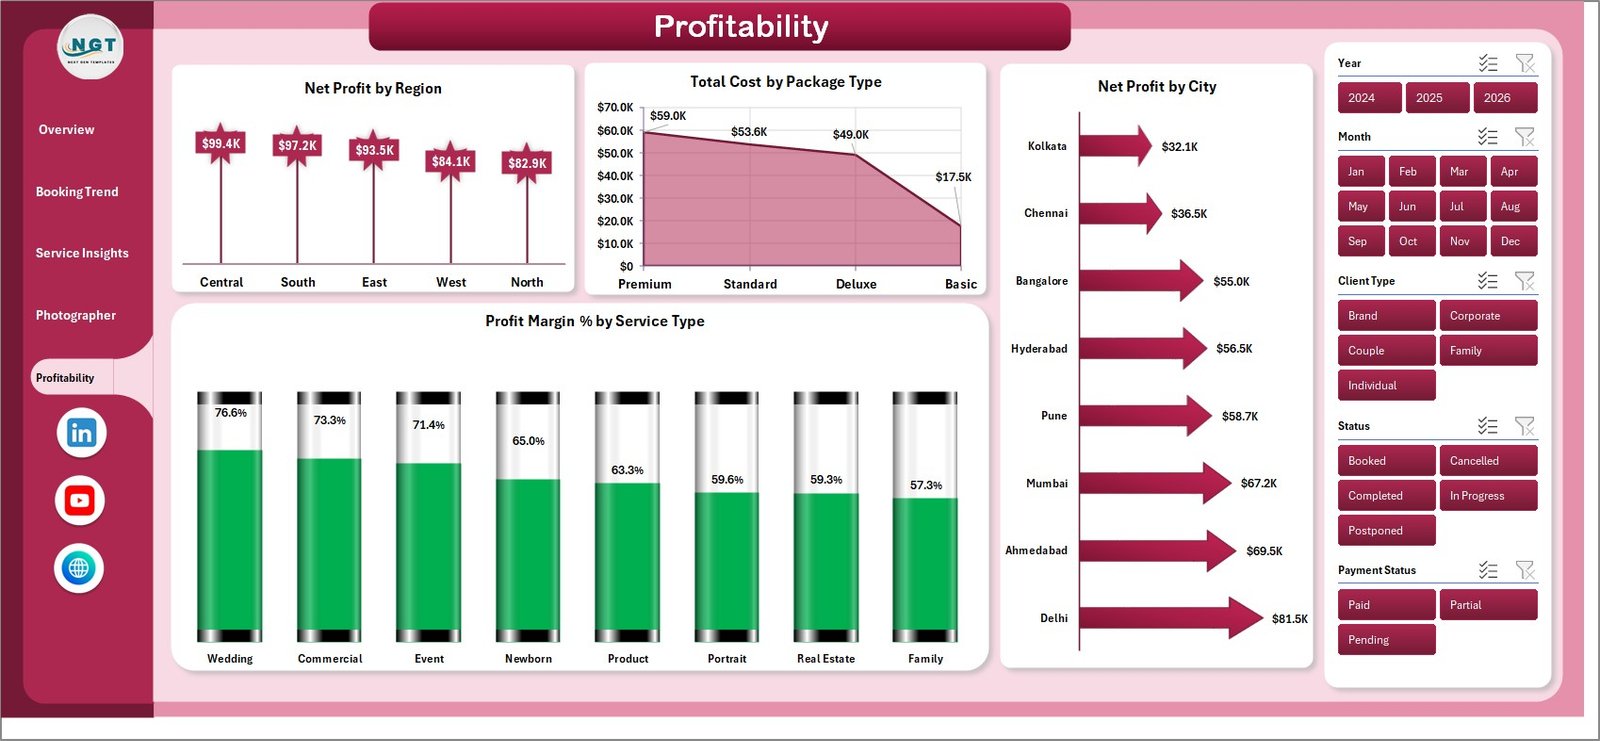
Profitability Analysis Page
6. Data Sheet Tab
The Data sheet is where you input all booking records. Each row is one booking. The columns match the fields used by the pivot tables — booking channel, photographer, service type, package type, region, city, client type, revenue, cost, photos delivered, satisfaction score, and payment status. Add your data here and the dashboard reads it automatically.
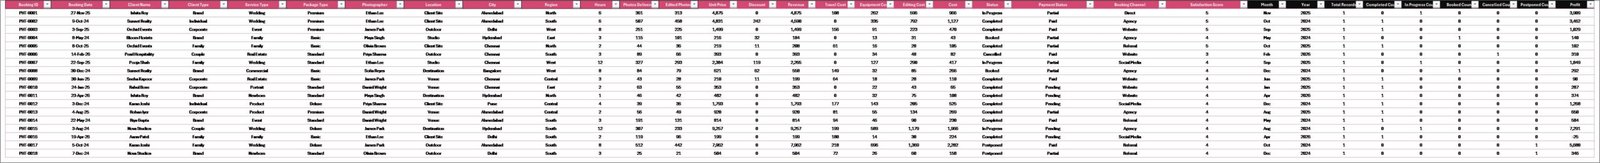
Data Sheet Tab
7. Support Sheet Tab
The Support sheet contains all pivot tables that drive the dashboard charts dynamically. You don’t need to edit this sheet — it works automatically. After updating the data sheet, go to the Data tab in the Excel ribbon and click Refresh All. All pivots and charts update instantly. You can keep this sheet hidden.
Support Sheet Tab
Photography Business Dashboard in Excel vs. Google Sheets vs. Studio Ninja — Feature Comparison
| Feature | Photography Business Dashboard in Excel | Google Sheets Equivalent | Studio Ninja / HoneyBook |
|---|---|---|---|
| Cost | $17.99 one-time | Free (manual build) | $35–75 / month |
| Platform | Microsoft Excel (offline + online) | Google Sheets (online only) | SaaS (online only) |
| Setup Time | Under 10 minutes | Hours of formula setup | 1–3 hours onboarding |
| Photographer Analytics | ✅ Revenue/hour, satisfaction, photos | ❌ Manual | ⚠️ Basic only |
| Profitability by City | ✅ Yes | ❌ Not included | ❌ Not available |
| One-Click Refresh | ✅ Pivot Refresh All | ❌ Manual recalculation | ✅ Auto-sync |
| No Subscription | ✅ One-time purchase | ✅ Free | ❌ Monthly recurring |
| Year-1 Cost (5 users) | $17.99 total | $0 | $420–$900 |
| Offline Access | ✅ Full offline | ❌ Requires internet | ❌ Online only |
For photography businesses that want multi-dimensional booking analytics without monthly SaaS fees, the Photography Business Dashboard in Excel sits in the sweet spot.
Who Should Use This Template
Perfect for:
- Freelance photographers managing 10–200+ bookings per month who want clear revenue and cost data
- Photography studio owners with multiple photographers who need team-level performance visibility
- Wedding, portrait, commercial, and event photographers wanting profitability analysis by service type
- Studio managers who present booking data in weekly or monthly reviews and need a ready chart
- Business-focused photographers already comfortable with Excel who want a structured analytics file
Not a fit if:
- You need CRM features (contracts, client emails, scheduling automation) — use HoneyBook or Studio Ninja instead
- Your team needs live multi-user cloud access to the same file simultaneously
- You have no Excel experience and need a tool with zero learning curve
Real-World Use Cases
Marco runs a wedding photography studio with 3 photographers. Each month he pastes that month’s booking records into the Data sheet, clicks Refresh All, and within 2 minutes has a full breakdown of which booking channel drove the highest revenue, which photographer delivered the best margin per hour, and which package types customers prefer. He presents the Overview page at his monthly team review — no extra prep needed.
Priya photographs portraits and corporate events across 4 cities. She uses the Profitability page to compare Net Profit by City quarter-over-quarter. After noticing that City C had 30% lower profit margins despite similar booking volumes, she traced it to higher travel costs and adjusted her pricing for that market. The dashboard paid for itself in the first analysis.
Jake manages operations at a 6-photographer commercial studio. The Photographer page lets him compare Revenue per Hour across the team and identify which photographers need extra support or training. He also uses the Service Insights page to evaluate whether adding a new package type (drone photography) was improving overall margins before committing to equipment investment.
Advantages of Photography Business Dashboard in Excel
- Cost efficiency — $17.99 one-time vs $35–75/month for SaaS analytics tools means year-1 savings of $400+
- Purpose-built for photography — KPIs like Avg. Satisfaction, Revenue/Hour per Photographer, and Booking Channel completion rates are specific to the photography business model
- No dependency on internet or third-party servers — your data stays in your Excel file, on your machine
- Scales with business growth — add new photographers, service types, cities, or channels by simply adding rows to the data sheet
- Presentation-ready — charts are clean and formatted for use in team meetings, investor decks, or business planning sessions
Opportunities for Improvement
- The dashboard does not include a client-level CRM — for contract tracking, payment reminders, and client communication, pair it with a dedicated CRM tool
- It does not support real-time data feeds — data must be entered manually or imported from an export of your booking system
- The Support sheet uses standard pivot tables which do not support measures as advanced as DAX in Power BI — users needing complex custom calculations may eventually want a Power BI version for that department
Best Practices
- Enter data in the exact column format of the sample rows — the pivot tables reference specific column headers
- Use consistent naming for photographers, service types, and booking channels (avoid “Instagram” and “instagram” as separate values)
- Refresh the dashboard at the same interval you want to report on — weekly or monthly is typical for most studios
- Hide the Support sheet once the dashboard is set up to keep the file clean for non-technical team members
- Back up the file before adding large batches of new data, especially in the first few months of use
Explore Relevant Templates
Looking for similar dashboards for other creative or service-based businesses?
- Graphic Design Report in Excel — track project revenue and profitability for graphic design studios
- Print Shop Dashboard in Excel — multi-page operations and revenue analytics for print businesses
- Pet Care Business Dashboard in Excel — service-business analytics with a similar dashboard architecture
Browse the full Excel Dashboard Templates collection on NextGenTemplates for more industry-specific dashboards.
Frequently Asked Questions
What KPIs does the Photography Business Dashboard in Excel track?
The Photography Business Dashboard in Excel tracks 5 KPI cards — Total Bookings, Total Revenue, Total Cost, Net Profit, and Average Satisfaction — across 5 dashboard pages with 16 pre-built charts covering booking channels, service types, photographer performance, and regional profitability.
Does this work with Excel on Mac?
Yes. The Photography Business Dashboard in Excel works on Microsoft Excel for Mac 2016 or later and all versions of Excel for Windows. It requires no add-ins or macros — it runs entirely on native pivot tables and Excel charts.
How long does setup take?
Setup takes under 10 minutes. Download the file, open it in Excel, paste your booking records into the Data sheet in the provided column format, and click Data → Refresh All. Every KPI card and chart updates automatically.
Can I customize the photographers, service types, and regions?
Yes. Add or change photographers, service types, regions, cities, booking channels, and package types in the Data sheet. The pivot tables automatically include the new values after a Refresh All — no formula editing required.
How does this compare to Studio Ninja or HoneyBook?
Studio Ninja and HoneyBook are CRM tools designed for client management (contracts, scheduling, invoicing). The Photography Business Dashboard in Excel is a business analytics tool focused on booking trends, profitability, and photographer performance. It costs $17.99 once vs $35–75/month for SaaS alternatives.
Is there a Power BI version of this dashboard?
Currently this template is available in Excel format. Browse the Power BI Dashboards collection on NextGenTemplates for similar analytics templates in Power BI format.
What happens to the Support sheet if I hide it?
Hiding the Support sheet has no impact on dashboard functionality. The pivot tables continue to power the charts whether the sheet is visible or hidden. You can keep it hidden permanently once the dashboard is set up.
About the Author
Built by PK — Microsoft Certified Professional with 15+ years of Excel, Google Sheets, and Power BI experience. Founder of NextGenTemplates, reaching 300K+ subscribers across YouTube channels (@PK-AnExcelExpert, @NextGenTemplates, @NeoTechNavigators). Every template is hand-built and tested before release.
Conclusion
The Photography Business Dashboard in Excel is a purpose-built analytics tool that gives photography studio owners and freelance photographers a clear, data-backed view of their bookings, costs, profits, and team performance. For $17.99 — a one-time payment with no subscription — it replaces months of manual spreadsheet work with a refresh-ready dashboard that updates in seconds.
👉 Click here to Purchase the Photography Business Dashboard in Excel
✅ Instant download · One-time payment · No subscription · Lifetime access
🎥 Watch the step-by-step tutorial on Youtube.com/@PK-AnExcelExpert
📅 Last updated: May 2026