Intellectual Property Law Firms Dashboard in Excel is a ready-to-use workbook for IP firms that need clear reporting across billing, expense cost, net profit, billable utilization, client ratings, matters, outcomes, deadlines, risk levels, and practice areas. The dashboard includes 7 worksheet tabs, 5 dashboard pages, 5 headline KPI cards, 19 chart views, multiple slicers, a Data Sheet, and a Support Sheet. Instead of rebuilding monthly IP performance reports manually, users can update the Data Sheet, refresh the workbook, and review the dashboard pages in minutes.
Excel remains a practical reporting layer for many legal teams because it is editable, familiar, and widely available through Microsoft 365. Microsoft also documents slicers as a way to filter table and PivotTable data visually, which supports the filtering workflow used in this dashboard. Reference: Microsoft Support on using slicers to filter data.
Click here to purchase Intellectual Property Law Firms Dashboard in Excel
Key Features of Intellectual Property Law Firms Dashboard in Excel
- Overview Page: High-level cards for Total Expense Cost, Net Profit, Total Hours Worked, Avg. Client Rating, and Billable Utilization %.
- Firm Analysis: Net profit by firm, billed amount by region, billed amount by practice area, and total hours worked versus billable hours by month.
- Practice Mix: Settlement value, client-type utilization, matter outcomes, and profit margin by risk level.
- Matter Outcomes: Case stage, deadline missed status, billing model economics, and regional profit margin review.
- Billing Review: Quarterly billed amount plus yearly and monthly profit margin and monthly billable utilization.
- Interactive slicers: Filter dashboard views by relevant legal, client, time, risk, outcome, and billing dimensions.
- Data and Support sheets: Replace sample records, then refresh the pivot tables and charts from the Excel Data ribbon.
Dashboard Pages Explanation
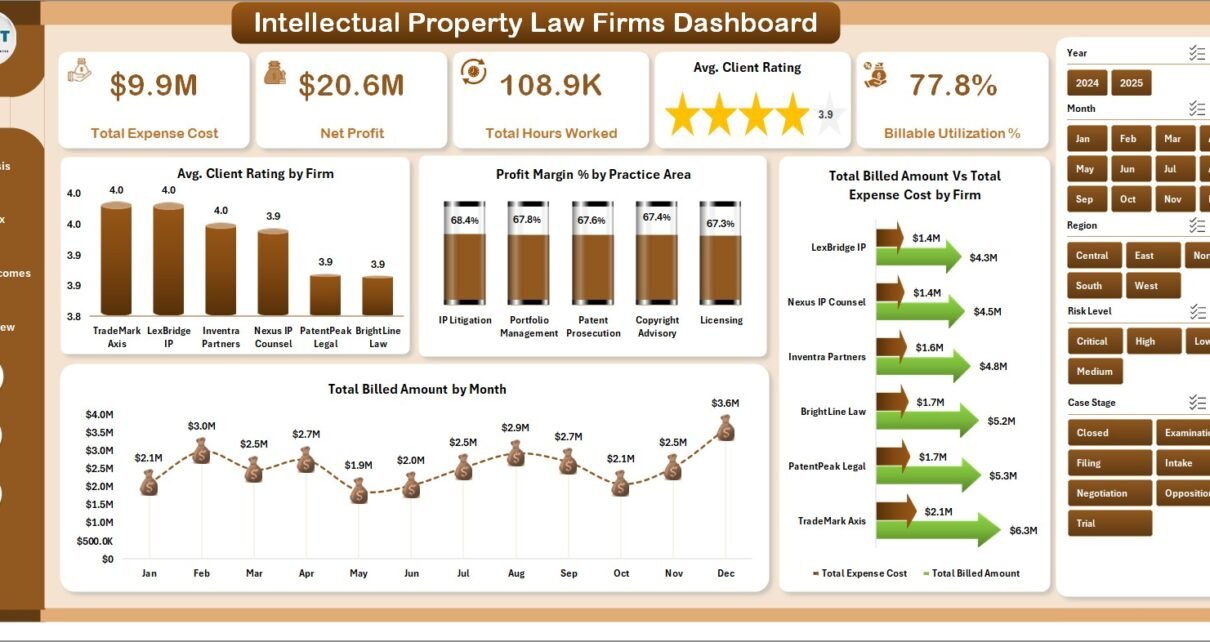
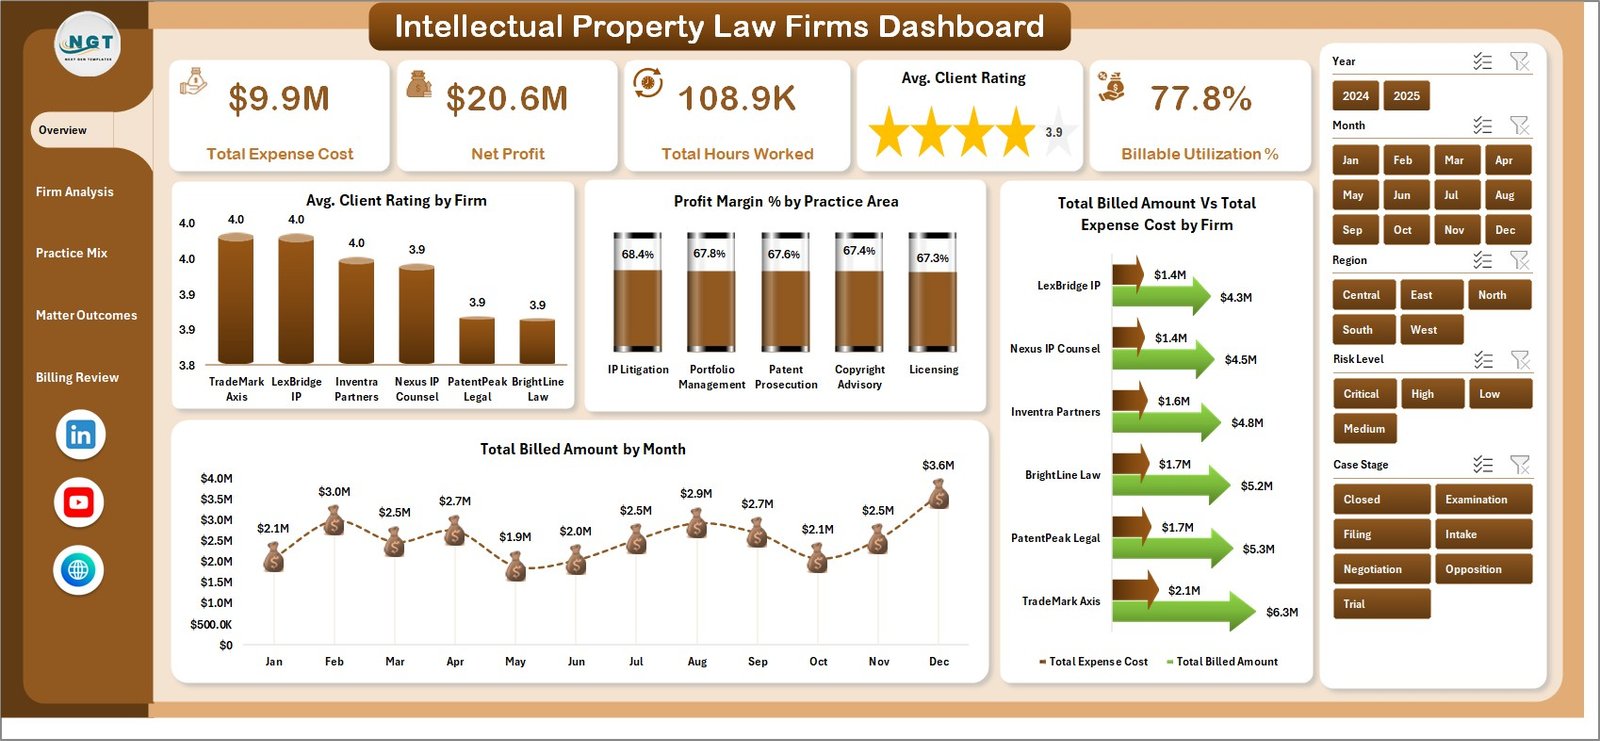
1. Overview Page
The Overview Page is the executive summary for the workbook. It shows Total Expense Cost, Net Profit, Total Hours Worked, Avg. Client Rating, and Billable Utilization % at the top so partners and managers can quickly understand cost, profitability, effort, client experience, and utilization.
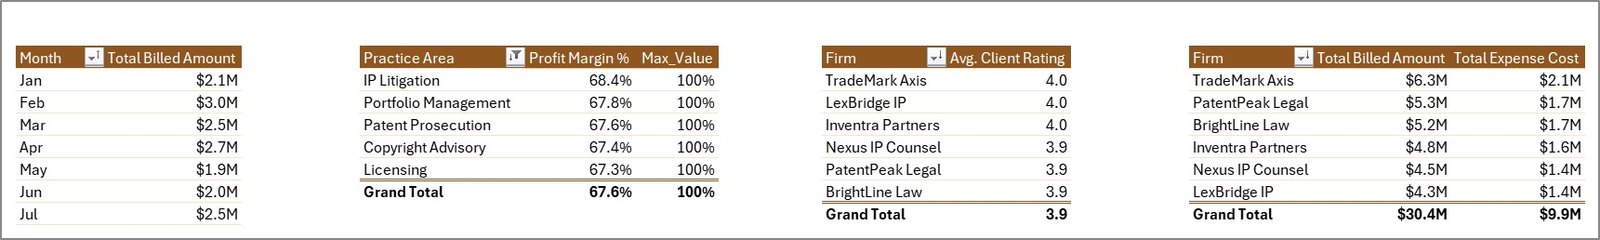
Avg. Client Rating by Firm: This chart compares client satisfaction across firms or firm groups. It helps leaders identify stronger client relationships and teams that may need service-quality follow-up.
Profit Margin % by Practice Area: This chart compares margin across IP practice areas. It helps firms see whether patents, trademarks, copyrights, licensing, litigation, or advisory work are producing stronger profitability.
Total Billed Amount Vs Total Expense Cost by Firm: This visual compares revenue and cost by firm. It is useful for identifying firm groups where expense cost is reducing net profit.
Total Billed Amount by Month: This trend shows billing movement across months. It helps reveal strong billing periods, slow months, and possible seasonality in IP law work.
Click here to purchase Intellectual Property Law Firms Dashboard in Excel
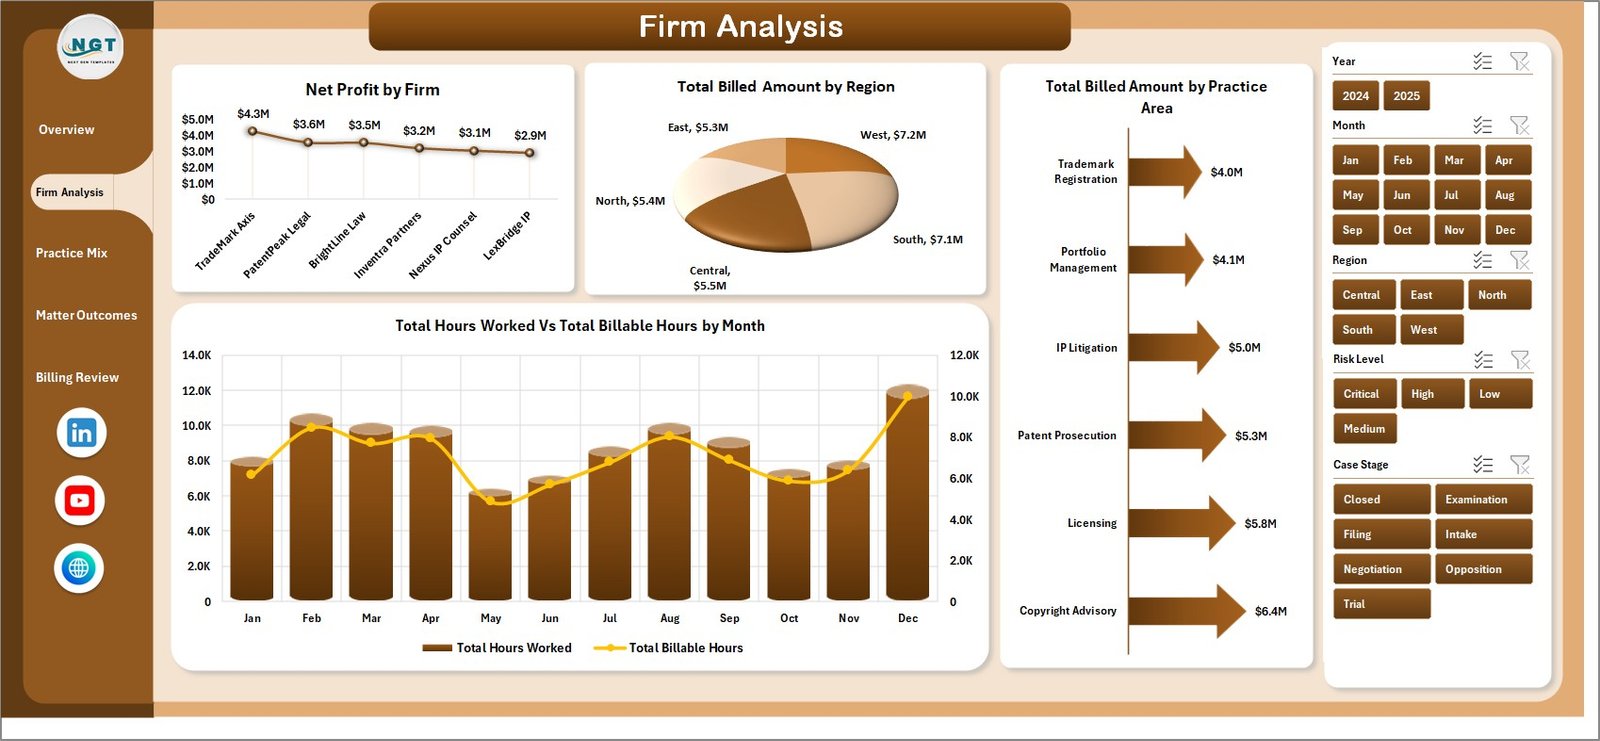
2. Firm Analysis
The Firm Analysis page gives a firm-level and regional view of billing, profitability, practice-area contribution, and workload conversion.
Net Profit by Firm: This chart ranks each firm or firm group by net profit. It helps practice leaders identify which areas are contributing the most after expenses.
Total Billed Amount by Region: This visual compares billed amount across regions. It helps firms understand where IP legal revenue is strongest.
Total Billed Amount by Practice Area: This chart shows which IP services drive the most billing. It is useful for planning partner focus, marketing, and staffing.
Total Hours Worked Vs Total Billable Hours by Month: This chart compares overall work effort with billable effort. It helps managers spot months where non-billable work may be reducing utilization.
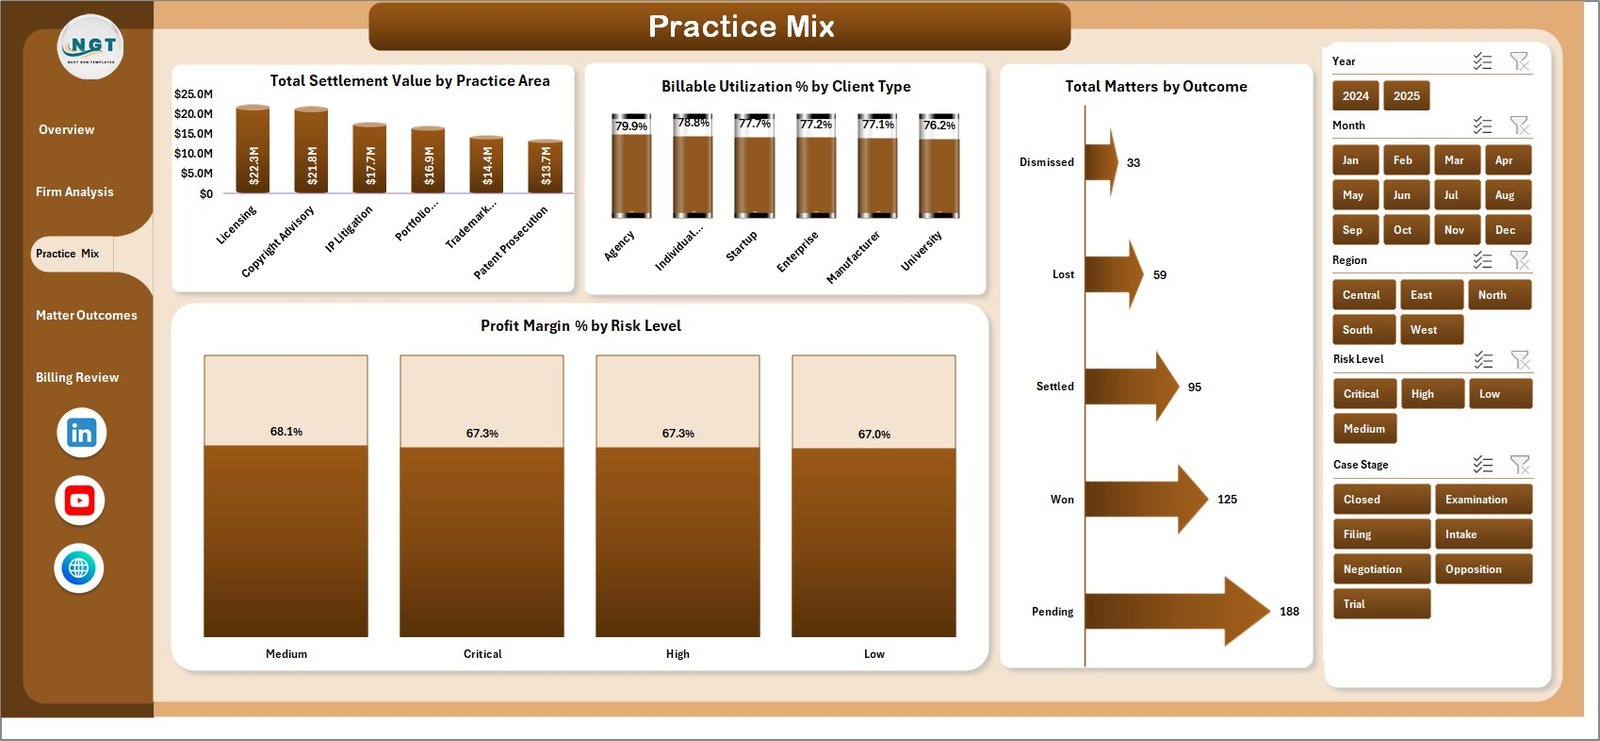
3. Practice Mix
The Practice Mix page connects practice-area financial value with utilization, outcomes, and risk. It is useful for partners reviewing which parts of the IP practice are producing the best return.
Total Settlement Value by Practice Area: This chart compares settlement value across practice areas. It helps identify where matters carry higher financial impact.
Billable Utilization % by Client Type: This visual compares utilization across client types. It helps firms see which client segments create more billable versus non-billable work.
Total Matters by Outcome: This chart groups matters by outcome. It helps legal teams review settlement, win, loss, withdrawal, pending, or closed patterns.
Profit Margin % by Risk Level: This chart compares margin across risk levels. It helps determine whether high-risk IP matters are generating enough profit for the effort required.
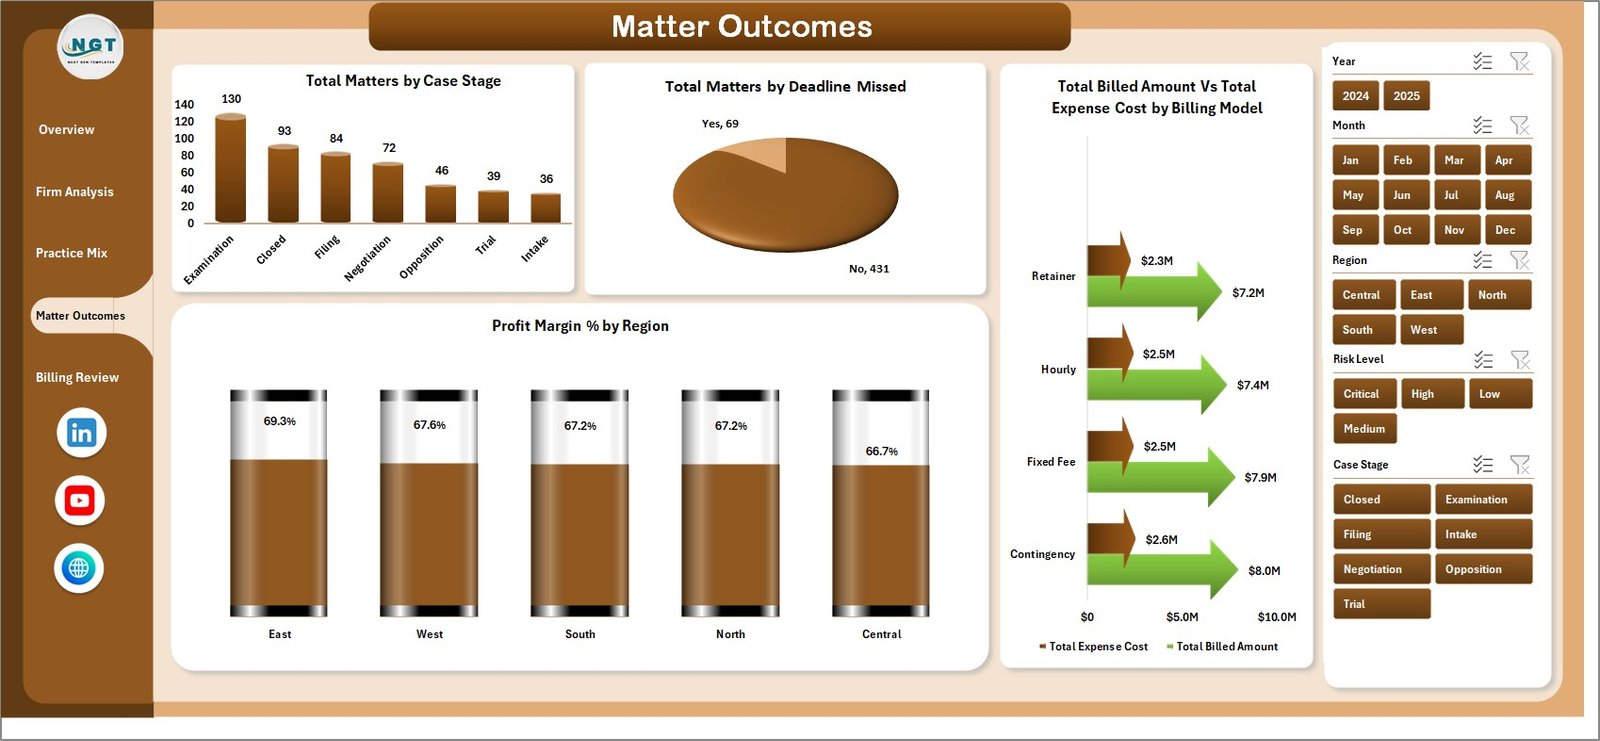
4. Matter Outcomes
The Matter Outcomes page is built for operational review. It helps teams understand matter stage distribution, missed deadlines, billing model economics, and regional profitability.
Total Matters by Case Stage: This chart shows the matter pipeline by stage. It helps users identify where work is concentrated and where follow-up may be needed.
Total Matters by Deadline Missed: This visual separates matters by deadline status. It gives managers a quick way to monitor deadline discipline.
Total Billed Amount Vs Total Expense Cost by Billing Model: This chart compares billing and costs across billing models such as hourly, fixed fee, retainer, contingency, or mixed models.
Profit Margin % by Region: This chart compares profitability by region. It helps leaders identify regions with stronger or weaker cost-to-billing performance.
Click here to purchase Intellectual Property Law Firms Dashboard in Excel
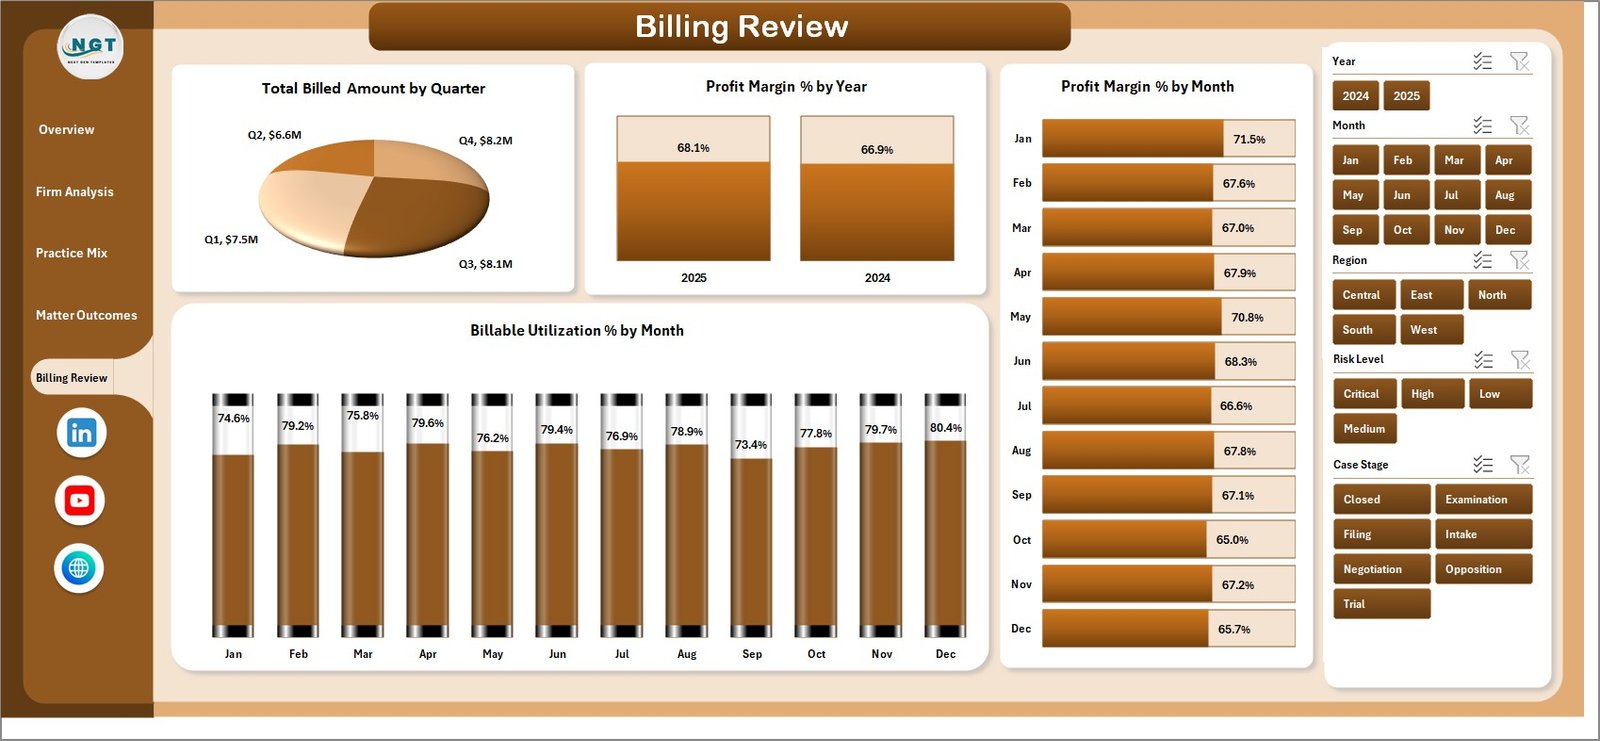
5. Billing Review
The Billing Review page gives finance and leadership teams a time-based view of billed amount, profit margin, and utilization.
Total Billed Amount by Quarter: This chart summarizes billed amount by quarter. It helps compare billing performance across the year.
Profit Margin % by Year: This visual shows annual profitability movement. It helps teams see whether overall margin is improving or declining.
Profit Margin % by Month: This chart tracks monthly profitability. It helps identify months where expense cost may have risen faster than billed amount.
Billable Utilization % by Month: This trend shows monthly utilization efficiency. It helps managers understand whether worked hours are converting into billable hours.
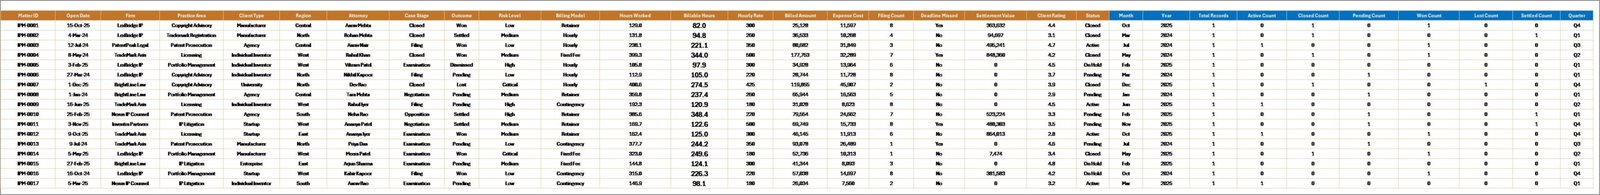
6. Data Sheet Tab
The Data Sheet is where users add or replace matter-level records in the same structure as the sample data. Keep the columns consistent so cards, slicers, pivots, and charts continue to refresh correctly.
7. Support Sheet
The Support Sheet contains the pivot tables that create the dashboard dynamically. After updating the Data Sheet, go to the Data tab in the Excel Ribbon and click Refresh All. The pivot tables and all connected charts will refresh, and the Support Sheet can be hidden for everyday users.
Intellectual Property Law Firms Dashboard in Excel vs. Google Sheets vs. Paid CRM/SaaS – Feature Comparison
| Feature | Intellectual Property Law Firms Dashboard in Excel | Google Sheets alternative | Paid legal CRM/SaaS |
|---|---|---|---|
| Cost | $17.99 one-time | Template cost or manual build | Monthly or annual subscription |
| Platform | Microsoft Excel | Google Sheets | Vendor cloud platform |
| Setup time | Replace data and refresh | Import records and adjust formulas | Implementation and onboarding |
| Real-time team collaboration | Available through OneDrive or SharePoint | Native collaboration | Usually included by plan |
| Mobile access | Excel mobile or web for light review | Google Sheets mobile app | Vendor app or browser |
| Customizable fields | Editable workbook, charts, and pivots | Editable but may need formula changes | Depends on vendor settings |
| Share with link | Possible through Microsoft 365 | Native link sharing | Often login controlled |
| Year-1 cost at 5 users | $17.99 plus Microsoft licensing if needed | Low software cost plus setup time | Often hundreds or thousands |
| IP law reporting | Billing, cost, profit, utilization, outcomes, deadlines, risk, and practice mix included | Must be built or adapted | Depends on module and configuration |
Who Should Use This Template
This template is ideal for intellectual property law firms, patent attorneys, trademark teams, IP litigation teams, legal operations managers, law firm finance teams, and consultants who need a structured Excel reporting workbook for IP matters and profitability.
It is also useful for small and mid-sized legal teams that do not want to buy a full legal analytics platform just to review monthly billing, expense, utilization, and outcome trends.
Real-World Use Cases
Anika, IP practice partner: Anika reviews net profit, billed amount, practice-area margin, and client rating before the monthly partner meeting.
Marcus, legal operations manager: Marcus monitors deadline missed status, case stages, and billable utilization so the team can follow up on process risks quickly.
Priya, finance analyst: Priya compares billed amount versus expense cost by firm and billing model before preparing quarterly profitability notes.
Advantages of Intellectual Property Law Firms Dashboard in Excel
- Faster monthly reporting: Start from a finished workbook instead of building charts and pivots from scratch.
- Excel-native flexibility: Edit labels, fields, formulas, charts, slicers, colors, and sheets as needed.
- Financial and operational view together: Review profit, expenses, billing, utilization, matters, deadlines, outcomes, and ratings in one place.
- Meeting-ready pages: Use separate pages for leadership, firm analysis, practice mix, matter outcomes, and billing review.
- No recurring template subscription: The workbook is a one-time downloadable product from NextGenTemplates.
Opportunities for Improvement
- Source system connection: Advanced users can connect Excel to exported data from billing, matter management, or practice management tools.
- Additional IP metrics: Firms can add filing type, jurisdiction, renewal status, docket status, claim count, or portfolio value if those fields exist in their data.
- Security workflow: Teams should store the workbook in a secure location and apply firm access controls when using real client or matter data.
- Automation: Larger firms may add Power Query to transform exported data before refreshing pivots.
Best Practices
- Keep column names consistent: Do not rename Data Sheet columns unless related pivots and charts are updated.
- Use standard values: Keep firm, region, practice area, client type, outcome, risk level, case stage, and billing model names consistent.
- Refresh after every update: Click Refresh All after adding or replacing matter records.
- Review utilization monthly: Compare total hours worked with total billable hours to identify non-billable workload pressure.
- Hide the Support Sheet: Keep pivot tables protected from accidental edits during normal dashboard use.
Explore Relevant Templates
You may also like Employment Law Services Dashboard in Excel, Cyber Law Advisory Dashboard in Excel, and Contract Management KPI Dashboard in Excel. Browse more Excel Dashboard templates.
Frequently Asked Questions
What is the Intellectual Property Law Firms Dashboard in Excel?
It is a ready-to-use Excel dashboard for tracking IP law firm billing, expense cost, net profit, hours worked, billable utilization, client ratings, settlement value, matter outcomes, deadlines, practice areas, and risk levels.
What pages are included?
The workbook includes Overview Page, Firm Analysis, Practice Mix, Matter Outcomes, Billing Review, Data Sheet, and Support Sheet tabs.
Can I replace the sample data?
Yes. Add your records to the Data Sheet in the same format and click Refresh All from the Excel Data ribbon.
Does this dashboard require macros?
No macro workflow is required for normal dashboard use. It is built around Excel data, pivot tables, slicers, cards, and charts.
Can I customize the dashboard?
Yes. You can edit fields, formulas, labels, charts, pivots, colors, slicers, and sheet names if you are comfortable working in Excel.
Is this a legal practice management system?
No. It is an Excel reporting dashboard, not a docketing system, billing platform, document system, e-filing tool, or client portal.
About the Author
Built by PK – Microsoft Certified Professional with 15+ years of Excel, Google Sheets, and Power BI experience. Founder of NextGenTemplates, reaching 300K+ subscribers across YouTube channels. Every template is hand-built and tested before release.
Conclusion
The Intellectual Property Law Firms Dashboard in Excel gives IP legal teams a practical way to review billing, expenses, profit, utilization, outcomes, deadlines, risk, regions, practice areas, and client ratings from one workbook. It is especially useful for firms that already collect matter data in Excel or export records from another system and need a cleaner performance reporting layer.
Click here to download Intellectual Property Law Firms Dashboard in Excel.
Visit our YouTube channel for step-by-step Excel and dashboard tutorials: Youtube.com/@PKAnExcelExpert.