Bridge construction projects demand precise tracking across dozens of moving variables — budget allocations, contractor performance, safety incidents, completion milestones, and regional cost variances — all at once. According to the Federal Highway Administration (FHWA), the United States manages over 617,000 bridges, with infrastructure investment running into the tens of billions of dollars annually. Even a 5% cost overrun on a $5 million bridge project represents $250,000 in uncontrolled spending.
The Bridge Construction Dashboard in Excel solves this challenge directly. It tracks 5 headline KPIs across 5 dedicated analysis pages, with 19 pre-built charts covering cost variance by contractor and bridge type, safety incidents by phase, completion rate by month, quality scores, and regional performance by state — all refreshing automatically from a single structured Data sheet. This post walks through every page, chart, and feature so you know exactly what you’re getting before you download.
👉 Click here to Purchase the Bridge Construction Dashboard in Excel
Key Features of the Bridge Construction Dashboard in Excel
The Bridge Construction Dashboard in Excel is built on a pivot-driven architecture, meaning all 19 charts connect to Excel pivot tables in a hidden Support sheet. After updating the Data sheet with your project records, one click on Data → Refresh All in the Excel Ribbon updates every card, chart, and slicer across all five pages simultaneously — no formula editing, no manual chart updates.
Here are the core features that make this template stand out for construction teams:
- 5 KPI cards on the Overview page — Total Budget, Total Actual Cost, Total Records, Total Safety Incidents, and Total Bridge Length give executives and project managers a portfolio-level snapshot the moment they open the file.
- Cost variance monitoring across four dimensions — The dashboard tracks budget vs. actual cost by Bridge Type, Contractor, Priority level, and Region, so you can pinpoint overruns precisely rather than just knowing the total is off.
- Safety and quality tracking in one dedicated page — Incidents by contractor and construction phase, combined with quality scores by bridge type and inspection result, make compliance reporting straightforward rather than a manual export exercise.
- State-level regional performance breakdown — Regional directors and government infrastructure departments can compare budget vs. actual cost by state, delay rate % by region, and contractor headcount in a single view.
- Multiple slicers on every page — Apply filters by bridge type, region, contractor, priority, or status. All slicers are interconnected, so every chart on the page updates in a single click.
- No macros or add-ins required — Built entirely on standard Excel pivot tables, pivot charts, and slicers. Works with Excel 2016 or later on Windows or Mac, including Microsoft 365.
Dashboard Pages Explanation
1. Overview Page
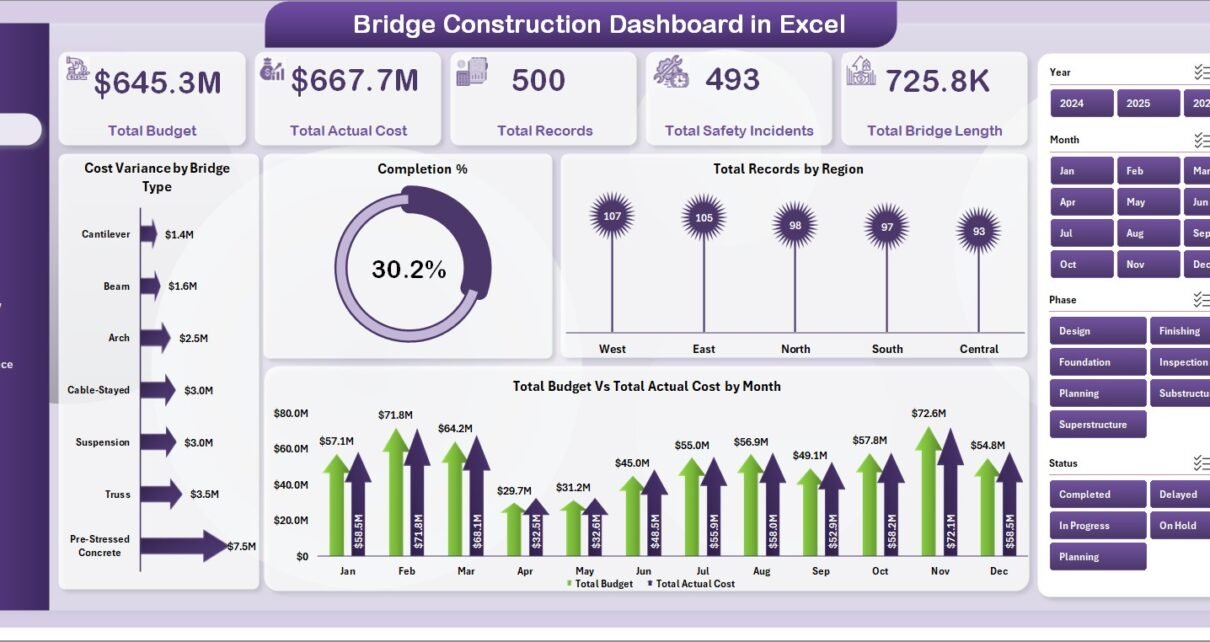
The Overview page is the command center of the Bridge Construction Dashboard in Excel. At the top, five KPI cards display the key headline numbers at a glance:
- Total Budget — the aggregate planned spend across all bridge projects in the dataset
- Total Actual Cost — cumulative expenditure to date, updated automatically from the Data sheet
- Total Records — total number of bridge project entries in the current filtered view
- Total Safety Incidents — portfolio-wide count of recorded safety incidents
- Total Bridge Length — summed bridge length across all projects, useful for infrastructure portfolio reporting
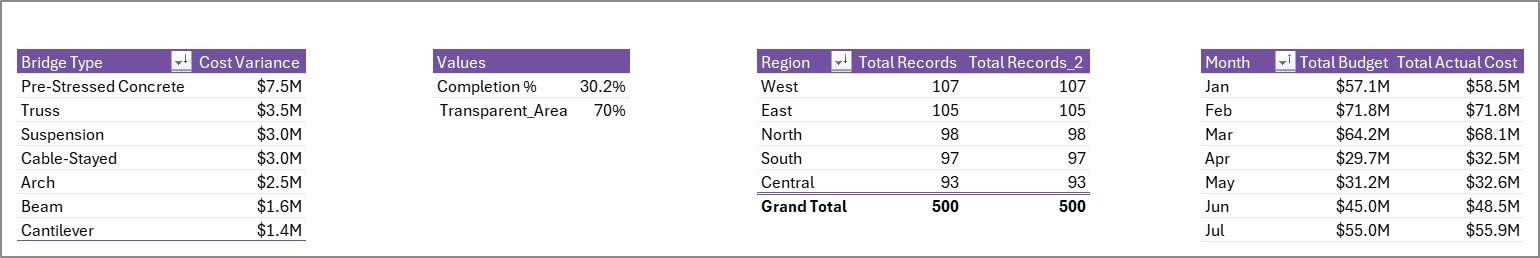
Below the KPI cards, four charts break down performance at a category level:
- Cost Variance by Bridge Type — compares planned vs. actual spend across bridge types (suspension, cable-stayed, beam, arch, etc.), immediately surfacing which structural categories are running over or under budget
- Completion % — shows the overall construction completion percentage, giving leadership a single number that summarises progress across the entire portfolio
- Total Records by Region — visualises the distribution of bridge projects across geographic regions, helping identify where the portfolio is most concentrated
- Total Budget vs. Total Actual Cost by Month — a time-series comparison that shows whether cost deviations are trending up or correcting over time, month by month
Multiple slicers at the top of the page let you filter all four charts and all five KPI cards simultaneously by any combination of bridge type, region, contractor, priority, or status.
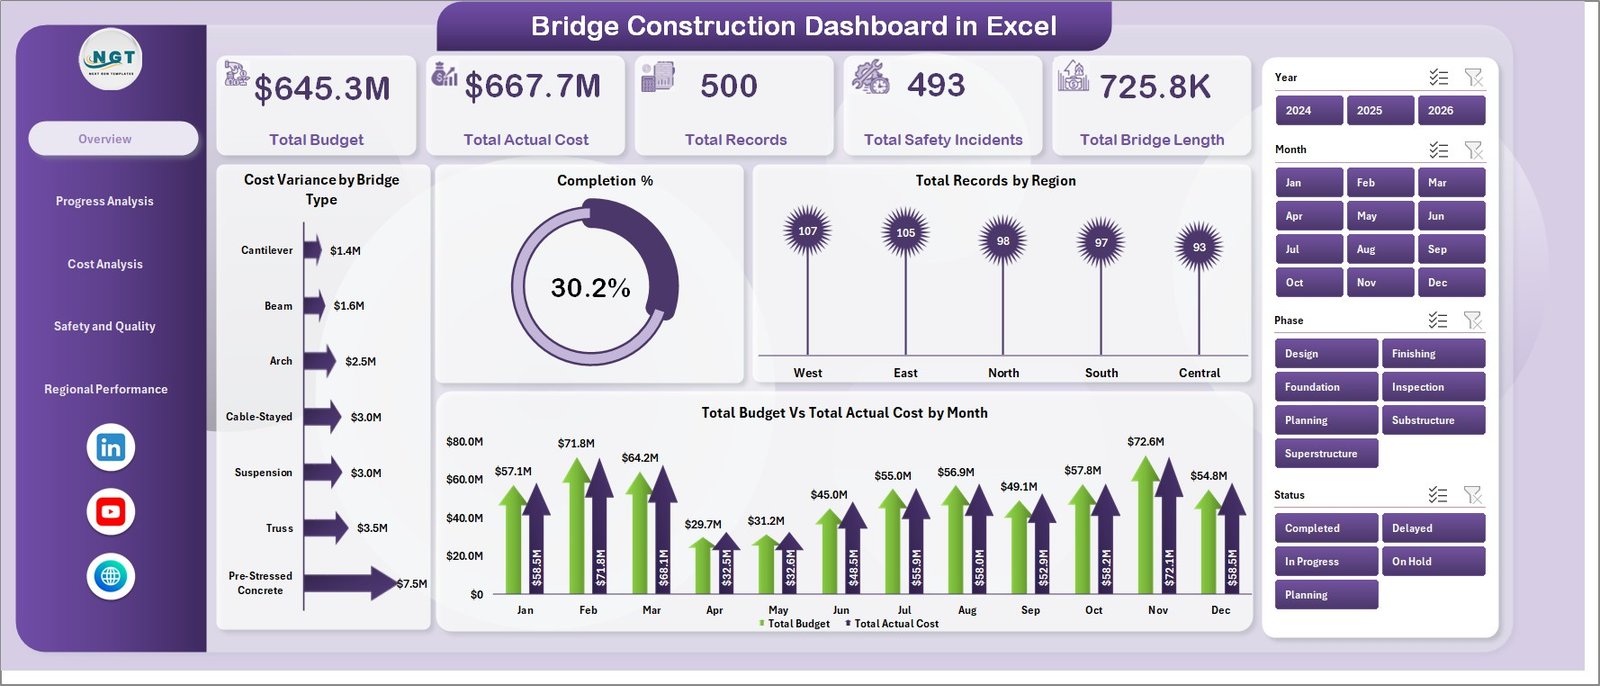
Overview Page
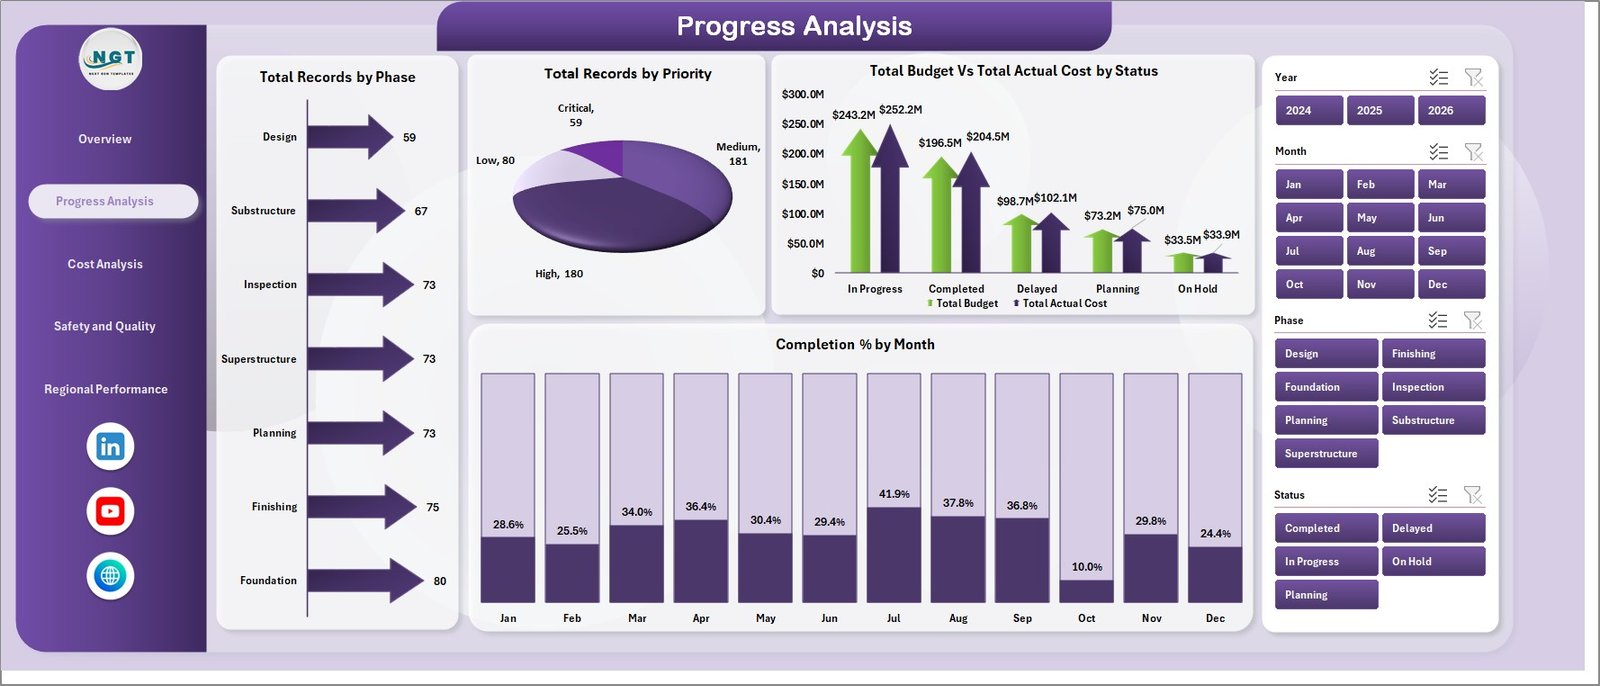
2. Progress Analysis Page
The Progress Analysis page focuses on pipeline health and construction phase tracking. It answers the question: where are projects in the construction lifecycle, and which phases or priority levels are experiencing delays?
- Total Records by Phase — breaks down the number of bridge projects in each construction phase (planning, design, foundation, superstructure, finishing, etc.), making it easy to see where work is concentrated
- Total Records by Priority — segments projects by priority tier (Critical, High, Medium, Low), so project controllers can focus attention on the most time-sensitive work
- Total Budget vs. Total Actual Cost by Status — shows budget adherence for projects grouped by status (On Track, Delayed, Completed, On Hold), making it clear whether delayed projects are also the ones with the largest cost overruns
- Completion % by Month — tracks monthly progress trends, showing whether the portfolio is accelerating toward completion or plateauing
Progress Analysis Page
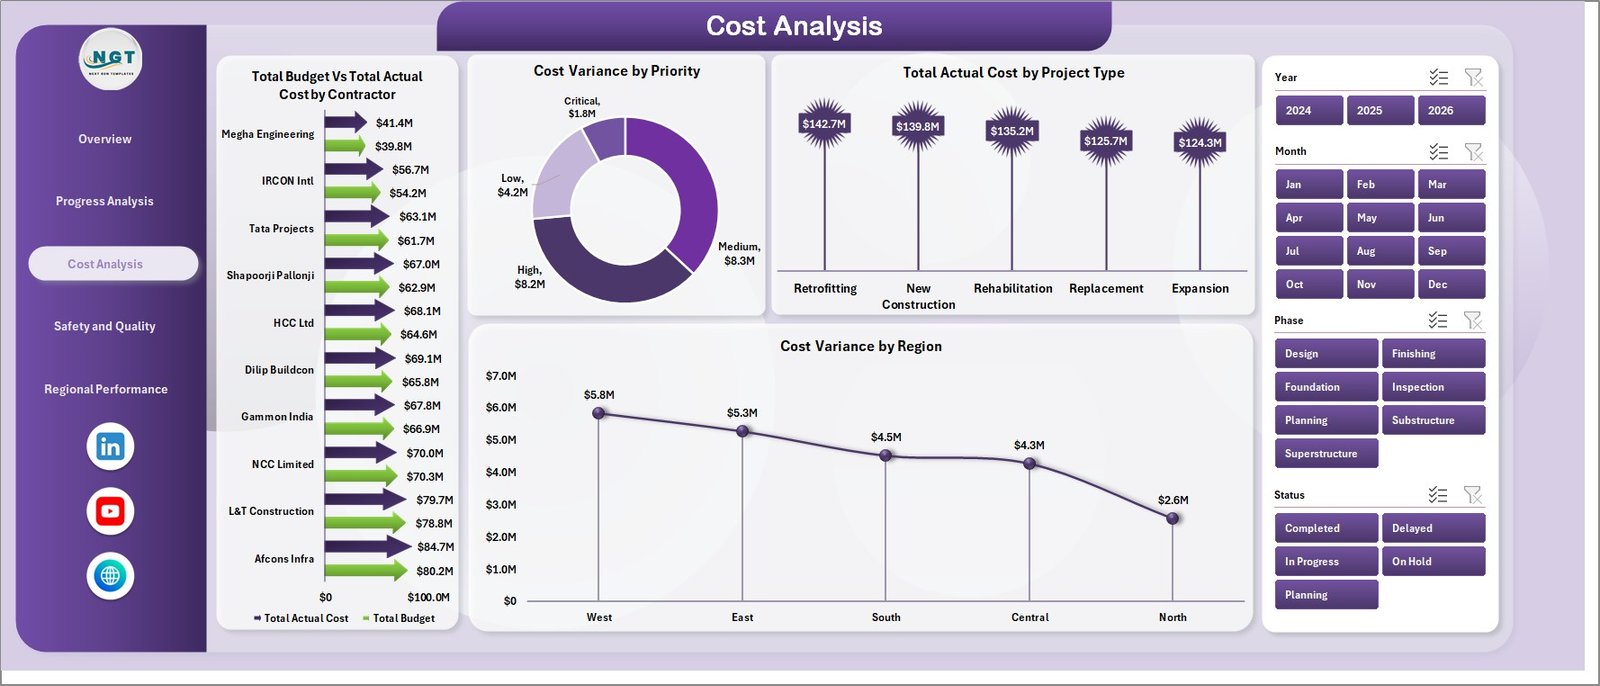
3. Cost Analysis Page
The Cost Analysis page is built for project controllers and finance teams who need contractor-level and region-level cost accountability. It provides four charts that dissect cost variances from multiple angles:
- Total Budget vs. Total Actual Cost by Contractor — ranks all contractors by their budget adherence, immediately showing which ones are delivering within budget and which are overrunning
- Cost Variance by Priority — identifies whether cost overruns are concentrated in high-priority projects (where overruns are most damaging) or spread across priority tiers
- Total Actual Cost by Project Type — breaks down cumulative spend by project type (new construction, rehabilitation, replacement, maintenance), helping directors understand where the real money is going
- Cost Variance by Region — geographic cost variance analysis showing which regions are running over or under budget, supporting resource reallocation decisions
Cost Analysis Page
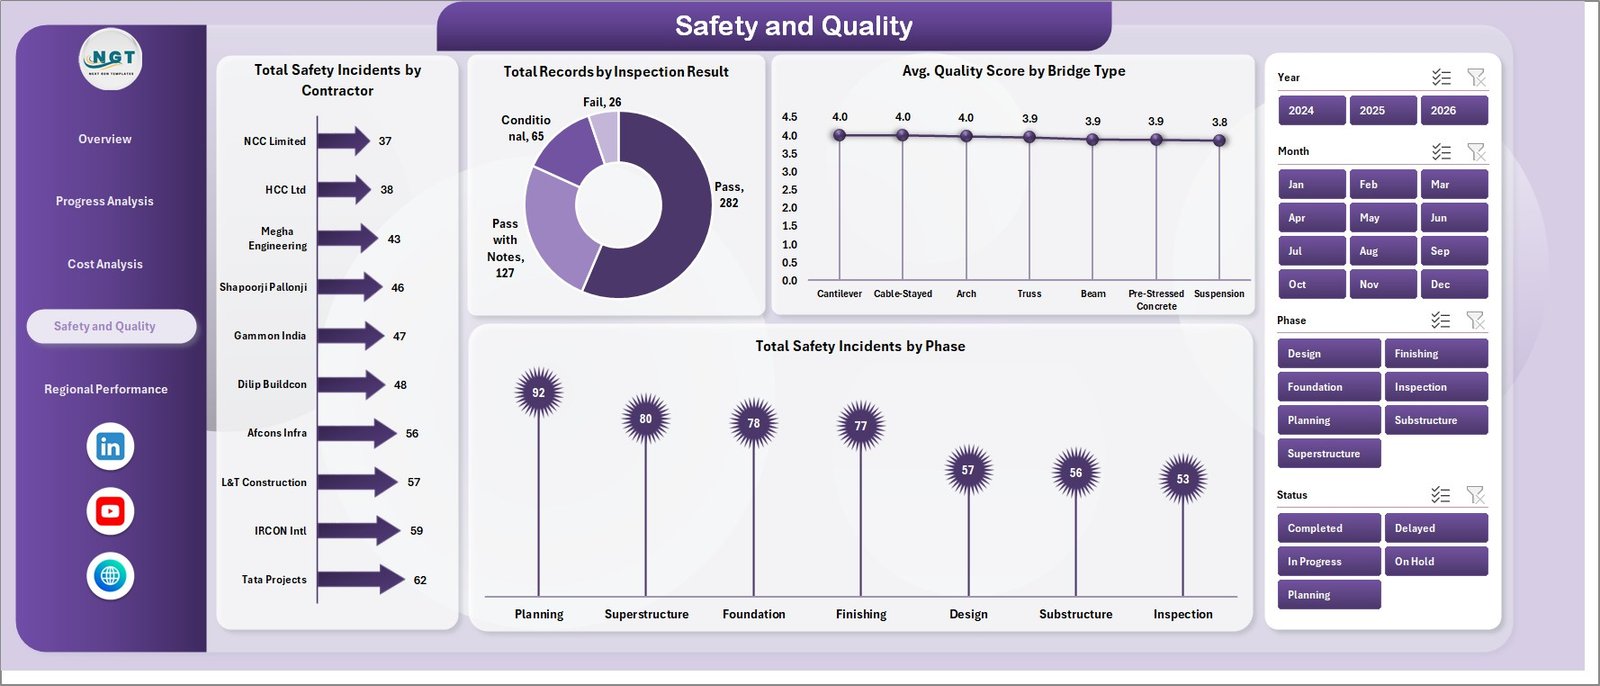
4. Safety and Quality Page
The Safety and Quality page is designed for compliance officers, site safety managers, and quality assurance teams. Infrastructure projects carry significant safety and regulatory obligations, and this page consolidates the key metrics into a single view:
- Total Safety Incidents by Contractor — ranks contractors by their total recorded safety incidents, making performance conversations and contractor evaluations data-driven
- Total Records by Inspection Result — shows how bridge projects are distributed across inspection outcomes (Pass, Conditional Pass, Fail, Pending), supporting audit reporting and corrective action tracking
- Avg. Quality Score by Bridge Type — compares average quality scores across bridge types, helping quality teams identify which structural categories may need additional inspection attention
- Total Safety Incidents by Phase — identifies which construction phases carry the highest incident rates, allowing safety officers to intensify on-site monitoring during high-risk phases
Safety and Quality Page
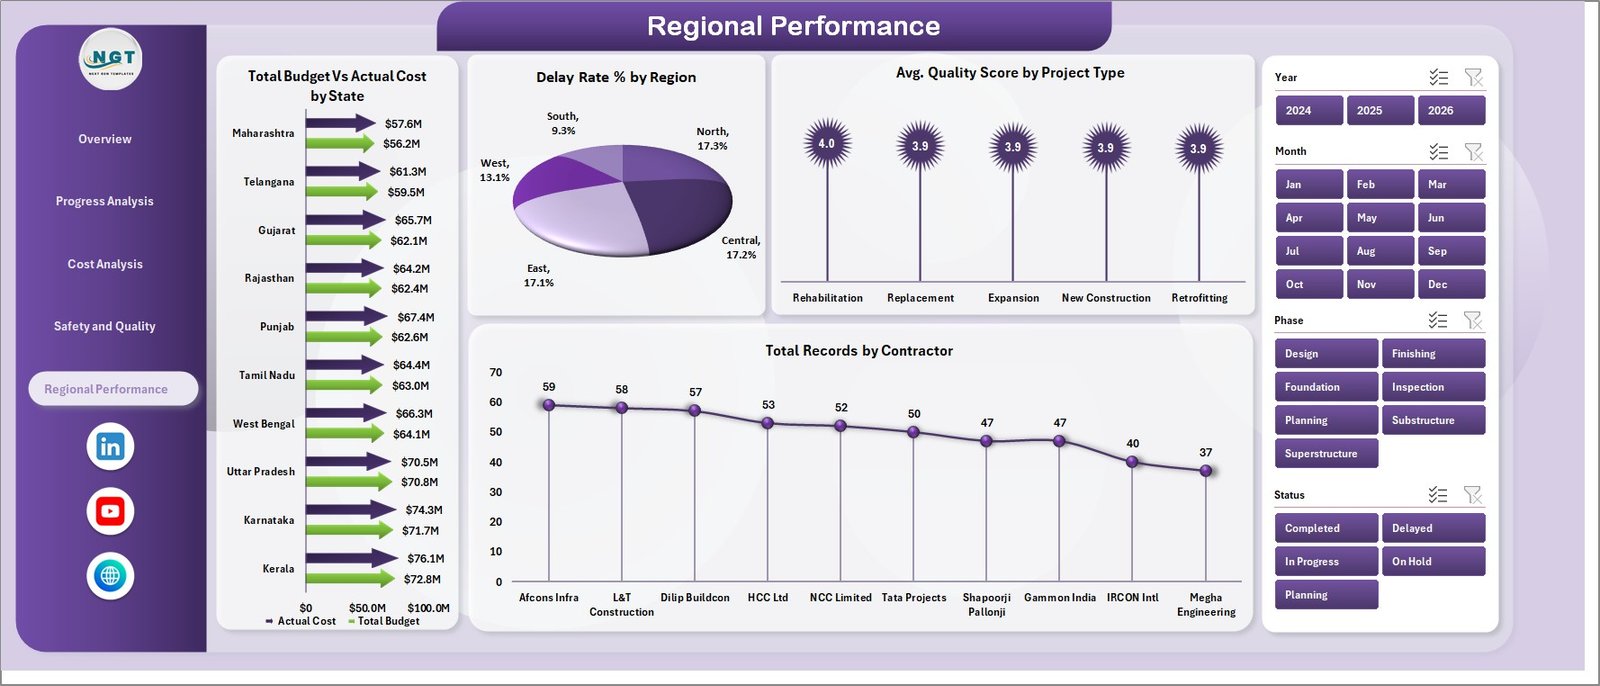
5. Regional Performance Page
The Regional Performance page is the view for regional directors and government infrastructure departments managing bridge portfolios across multiple states or territories. Four charts provide geographic intelligence:
- Total Budget vs. Actual Cost by State — state-level budget adherence comparison, enabling regional managers to flag cost overruns in specific jurisdictions before they escalate
- Delay Rate % by Region — shows the proportion of delayed projects in each region, making it straightforward to identify which geographic areas have the most scheduling challenges
- Avg. Quality Score by Project Type — cross-references quality outcomes by project type across regions, surfacing whether rehabilitation projects consistently score lower than new construction, for example
- Total Records by Contractor — shows contractor workload distribution across the portfolio, useful for capacity planning and contractor dependency risk assessment
Regional Performance Page
6. Data Sheet Tab
The Data sheet is where all your project records live. Each row represents one bridge project record, with columns for project name, bridge type, contractor, region, state, phase, priority, status, budget, actual cost, safety incidents, quality score, bridge length, and date fields. Replace the sample rows with your actual project data — no formula changes required. The structure must be maintained for the pivot tables to refresh correctly.

Data Sheet Tab
7. Support Sheet Tab
The Support sheet contains all the Excel pivot tables that power the 19 dashboard charts. It is designed to remain hidden during normal use — right-click the tab and select Hide to keep it out of view. After updating records in the Data sheet, go to the Data tab in the Excel Ribbon and click Refresh All. All pivots will refresh simultaneously, and every chart and KPI card across all five dashboard pages will update automatically.
Support Sheet Tab
Bridge Construction Dashboard in Excel vs. Google Sheets vs. Procore — Feature Comparison
| Feature | Bridge Construction Dashboard in Excel | Google Sheets Dashboard | Procore / Autodesk |
|---|---|---|---|
| Cost | $17.99 one-time | Free (manual build) | $375–$1,200+/user/year |
| Platform | Microsoft Excel (offline) | Google Sheets (cloud) | Web/mobile SaaS |
| Setup time | Under 10 minutes | 3–8 hours | Days to weeks |
| Works offline | ✅ Yes | Limited | ❌ No |
| Cost variance by contractor & region | ✅ Built-in | Manual setup required | ✅ Yes (enterprise) |
| Safety incident tracking | ✅ Built-in | Manual setup required | ✅ Advanced |
| Regional performance by state | ✅ Built-in | Manual setup required | ✅ Yes |
| Year-1 cost at 5 users | $17.99 total | Free (time investment) | $1,875–$6,000+ |
| Subscription required | ❌ Never | ❌ Never | ✅ Annual contract |
For infrastructure teams that need contractor-level cost accountability and safety tracking without enterprise SaaS contracts, the Bridge Construction Dashboard in Excel sits in the sweet spot.
Who Should Use This Template
Perfect for:
- Project managers overseeing multiple concurrent bridge and infrastructure construction projects
- Government DOT departments tracking regional bridge portfolio performance and budget adherence by state
- Construction contractors who need to monitor cost variance, delay rates, and quality scores across subcontractors
- Safety officers and compliance teams tracking incident rates by construction phase and contractor
- Finance and budget controllers needing contractor-level and priority-level cost accountability without enterprise SaaS
Not a fit if:
- Your team needs real-time IoT sensor data integrated directly from the construction site
- Your organization requires SOC 2-compliant role-based access controls and audit logs for 100+ users
- You don’t have access to Microsoft Excel 2016 or later — pivot charts and slicers require a current Excel version
Real-World Use Cases
Marcus manages a regional infrastructure portfolio for a state DOT. Each month, he pastes updated project records into the Data sheet and shares the refreshed file with his director. The Regional Performance page shows delay rates by region and budget vs. actual by state — giving leadership the geographic breakdown they need for budget allocation decisions, without waiting for IT to run custom reports.
A mid-size construction contractor uses the Cost Analysis page for monthly subcontractor reviews. The Cost Variance by Contractor chart immediately flags which subcontractors are running over budget, letting the project controller address overruns before the next billing cycle. The team estimates this visibility has reduced uncontrolled cost escalation by 8–12% since adopting the dashboard.
A site safety officer at a civil engineering firm monitors the Safety and Quality page weekly. She tracks Total Safety Incidents by Phase to identify which stages of construction carry the highest incident rates, and uses Avg. Quality Score by Bridge Type to prioritise inspection resources — converting quarterly compliance scrambles into a weekly five-minute review routine.
Advantages of the Bridge Construction Dashboard in Excel
- One-time cost, zero subscription: $17.99 covers unlimited use, unlimited projects, and unlimited users within your organisation — no per-seat fees, no annual renewal.
- Works completely offline: Unlike cloud-based SaaS tools, Excel works without an internet connection — critical for on-site use in areas with poor connectivity.
- Covers the full project lifecycle: From budget planning and progress tracking to safety compliance and regional performance — all five analysis dimensions in a single file.
- Refresh-ready architecture: The pivot-table backend means adding new project rows or updating existing records requires only one click — Data → Refresh All — to reflect changes across all 19 charts.
- No learning curve for Excel users: Built entirely on familiar Excel features — no macros, no Power Query, no complex formulas — so any team member comfortable with Excel can use and maintain it.
Opportunities for Improvement
- No automatic real-time data connection: Data must be entered or pasted manually into the Data sheet. Teams using project management software (Primavera, MS Project) would benefit from a manual export step before refreshing.
- Single-user file by default: Excel is not natively a multi-user real-time collaboration tool. Teams needing simultaneous editing should store the file in SharePoint or OneDrive and use Excel’s co-authoring feature.
- Fixed column structure in Data sheet: The pivot table connections depend on the existing column headers. Adding entirely new data dimensions requires adjusting the pivot table field list in the Support sheet.
Best Practices
- Keep the Support sheet hidden to prevent accidental pivot table changes that could break chart connections.
- Store the file in SharePoint or OneDrive if multiple team members need access — this enables Excel’s built-in co-authoring without losing the pivot functionality.
- Set a monthly data refresh routine: export records from your project management system, paste into the Data sheet, click Refresh All, and distribute the updated file — the entire cycle takes under 15 minutes.
- Use the slicers as a presentation tool during leadership reviews — filtering live in front of stakeholders is more impactful than pre-built static screenshots.
- Archive monthly snapshots by saving a copy of the file with a date in the filename (e.g., Bridge_Dashboard_May2026.xlsx) before overwriting the Data sheet with new records.
Explore Relevant Templates
If the Bridge Construction Dashboard in Excel fits your workflow, here are related infrastructure and construction templates worth exploring on NextGenTemplates:
- 📋 Bridge Maintenance Dashboard in Excel — Track inspection schedules, repair costs, and maintenance records for existing bridge assets.
- 🌐 Construction Dashboard in HTML — A browser-based interactive dashboard; no Excel installation required.
- 📐 Architecture & Design Report in Excel — Structured project reporting for architecture and design firms.
- ⚡ Bridge Construction KPI Dashboard in Power BI — The Power BI version for teams already in the Microsoft BI ecosystem.
Frequently Asked Questions
What KPIs does the Bridge Construction Dashboard in Excel track?
The Bridge Construction Dashboard in Excel tracks 5 headline KPIs — Total Budget, Total Actual Cost, Total Records, Total Safety Incidents, and Total Bridge Length — across the Overview page. The full template includes 19 charts covering cost variance, completion rate, safety incidents by phase, quality scores by bridge type, regional performance by state, and contractor-level analysis.
How long does setup take?
Setup takes under 10 minutes. Open the file in Microsoft Excel, paste your project records into the Data sheet in the same column format as the sample data, then click Data → Refresh All. Every KPI card, chart, and slicer across all five pages updates automatically — no formula editing or chart rebuilding required.
Does the Bridge Construction Dashboard in Excel require macros or add-ins?
No. The dashboard is built entirely on standard Excel features — pivot tables, pivot charts, and slicers. No VBA macros, add-ins, or Power Query connections are used. It works with Microsoft Excel 2016 or later on Windows or Mac, including Excel included in Microsoft 365 subscriptions.
How does this compare to Procore or Autodesk Construction Cloud?
Procore and Autodesk Construction Cloud are enterprise SaaS platforms costing $375–$1,200+ per user per year with weeks of onboarding. The Bridge Construction Dashboard in Excel delivers cost variance, safety tracking, progress analysis, and regional performance in a $17.99 one-time download — with no subscription, no per-user fees, and no vendor lock-in.
Can I add more projects or extend the Data sheet?
Yes. Add as many project rows as needed — the pivot tables will capture all rows in the Data sheet on the next Refresh All. If you need to add entirely new data columns, you can extend the pivot table field list in the Support sheet, though the pre-built charts are designed around the existing data structure.
Is the Support sheet safe to hide?
Yes — hiding the Support sheet is recommended for normal use. It contains the pivot tables that power all 19 charts and does not need direct editing. Right-click the tab and select Hide. Do not delete it, as removing it will break all dashboard charts.
About the Author
Built by PK — Microsoft Certified Professional with 15+ years of Excel, Google Sheets, and Power BI experience. Founder of NextGenTemplates, reaching 300K+ subscribers across YouTube channels. Every template in the NextGenTemplates library is hand-built and tested before release, with regular updates based on user feedback.
📺 Follow for tutorials: YouTube.com/@PK-AnExcelExpert
Conclusion
The Bridge Construction Dashboard in Excel gives infrastructure project teams a structured, refresh-ready tool for tracking budget variance, construction progress, safety compliance, and regional performance — without the subscription cost or onboarding overhead of enterprise SaaS platforms.
👉 Click here to Purchase the Bridge Construction Dashboard in Excel
✅ Instant download · One-time payment · No subscription · Lifetime access
📅 Last updated: May 2026