Managing corporate travel costs without a dedicated system is one of the most common pain points for finance and operations teams. According to the Global Business Travel Association (GBTA), unmanaged business travel spend can run 20–30% over budget annually when policy compliance isn’t tracked in real time. The Business Travel Services Dashboard in Excel solves this with a 5-page, pivot-driven analytics workbook — 5 KPI cards, 14 pre-built charts, and interactive slicers — all refreshable in one click.
In this post, we’ll walk through every page of the dashboard, explain how the pivot architecture works, and show you how to adapt it to your organization’s travel data.
https://nextgentemplates.com/product/business-travel-services-dashboard-in-excel/
Key Features of the Business Travel Services Dashboard in Excel
The Business Travel Services Dashboard in Excel tracks 5 headline KPIs — Total Spend, Total Trips, Total Travelers, Total Approved Budget, and Total Refunds — across 5 interactive pages. Every metric is driven by Excel pivot tables, so a single Data → Refresh All updates every chart and card simultaneously.
Key capabilities include:
- 14 pre-built charts covering spend, compliance, destinations, and trends
- Multi-dimensional slicers on the Overview page for instant cross-filtering
- Policy Compliance % tracked by booking channel, department, and approval status
- Destination intelligence — top 5 cities, region spend, and approved budget breakdowns
- Month-by-month trend tracking for trips, refunds, and budget vs actual
- Fully customizable — add columns in the Data sheet and extend pivots in the Support sheet
Dashboard Pages Explanation
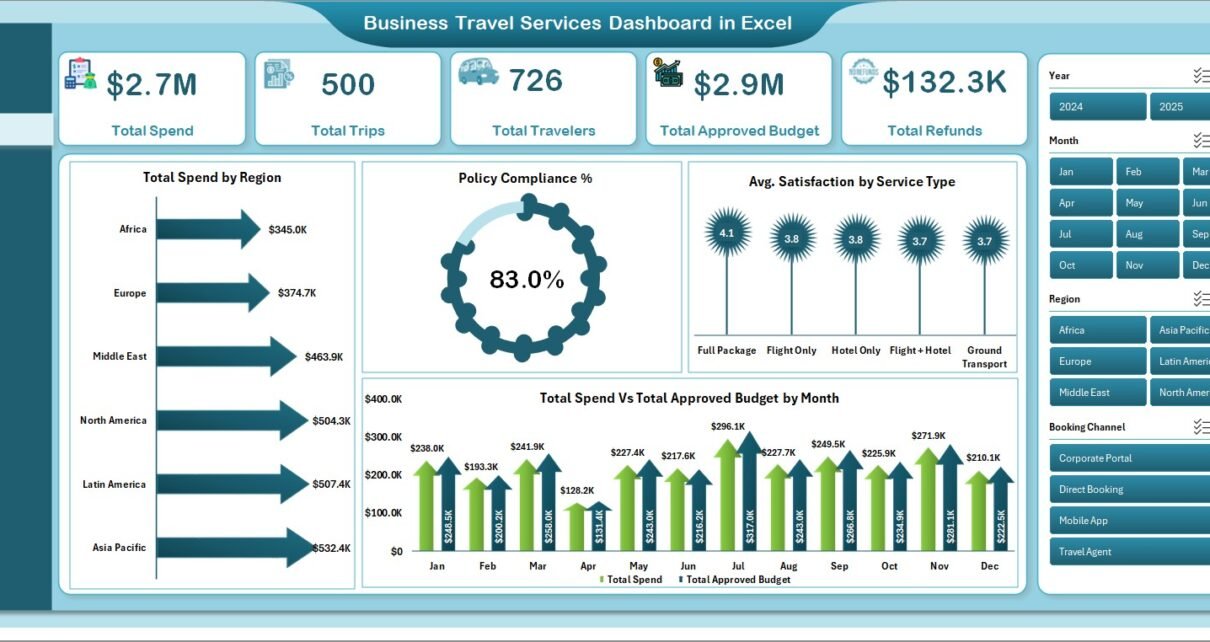
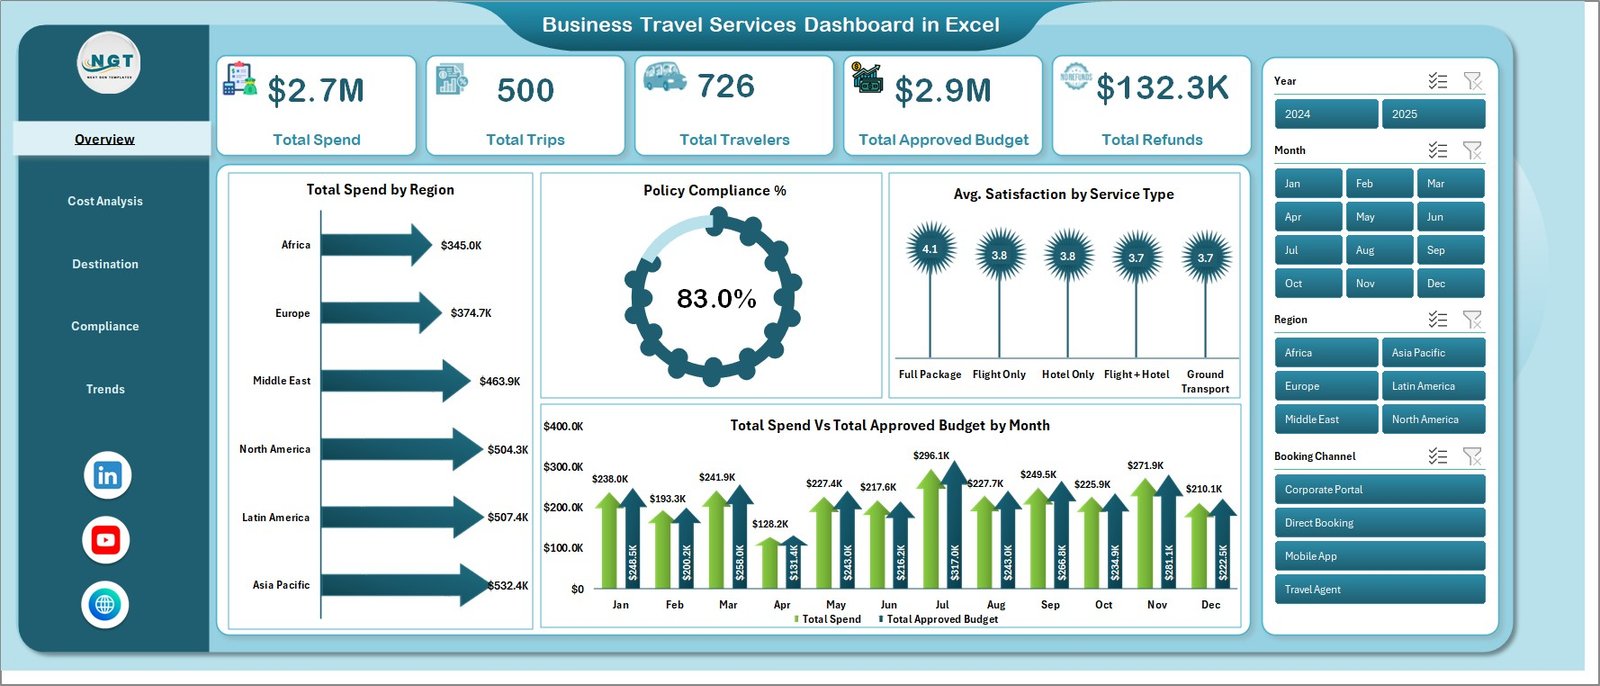
1 — Overview Page
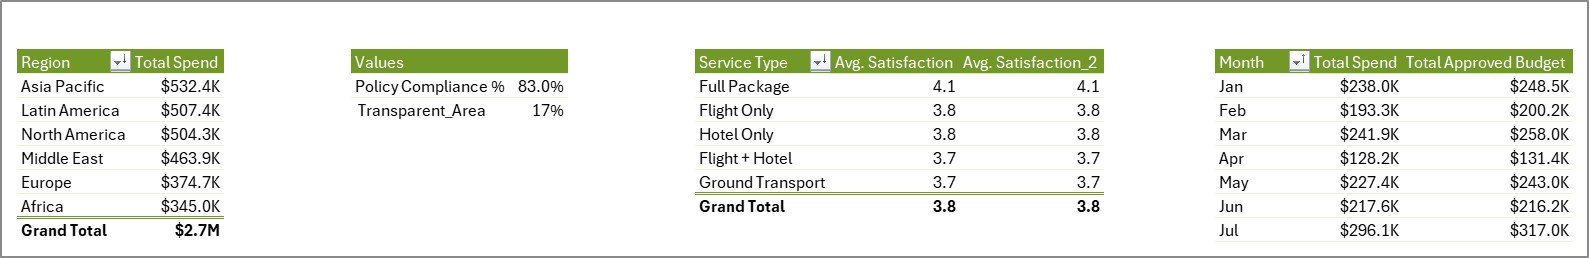
The Overview page is the executive view of your corporate travel program. Five KPI summary cards at the top display Total Spend, Total Trips, Total Travelers, Total Approved Budget, and Total Refunds at a glance. Below the cards, four charts provide analytical depth: Total Spend by Region shows geographic cost distribution; Policy Compliance % visualizes how well travelers are following booking policies; Avg. Satisfaction by Service Type captures service quality scores across hotels, airlines, and ground transport; and Total Spend vs Total Approved Budget by Month tracks budget adherence over time. The interactive slicers on this page let you filter the entire view by any dimension in seconds.
 Overview Page
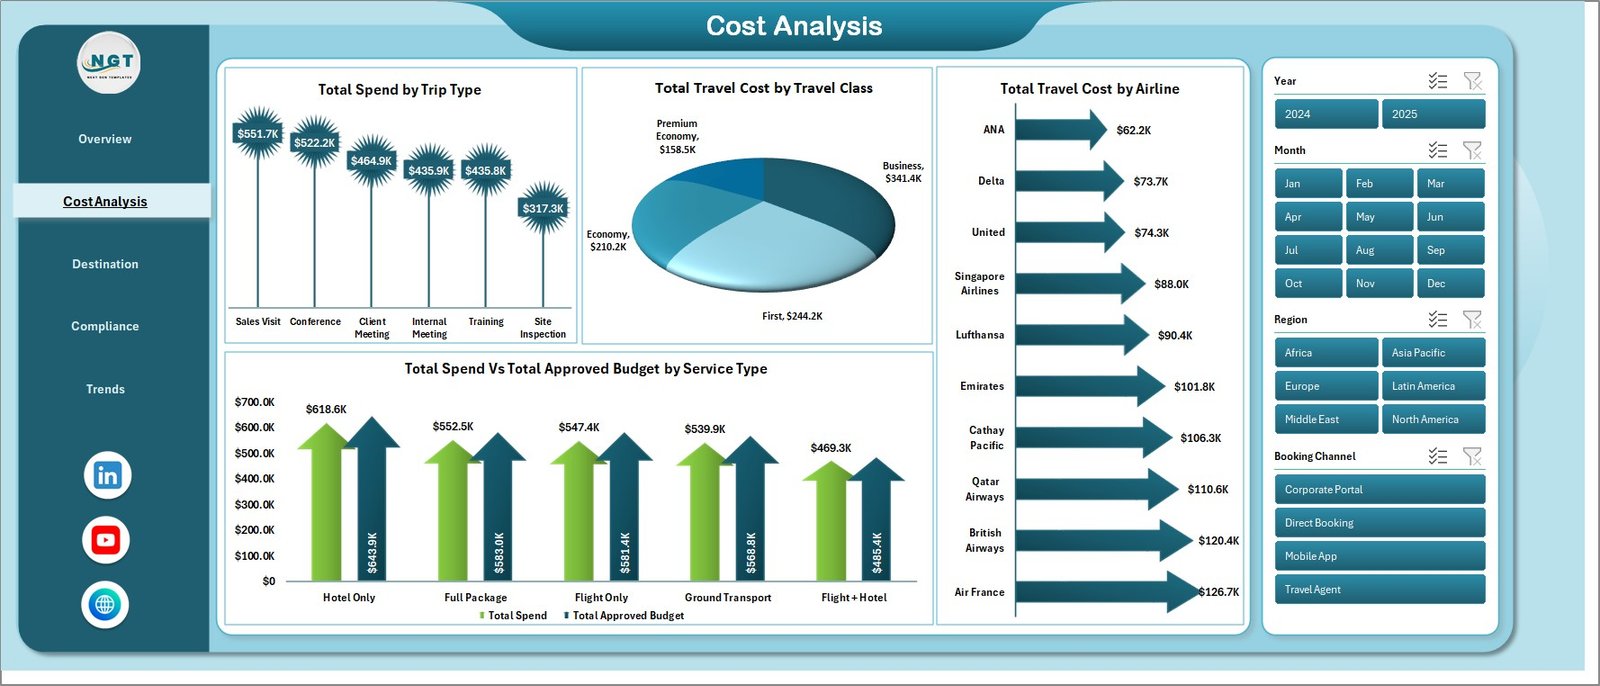
2 — Cost Analysis
The Cost Analysis page breaks down travel expenditure along four dimensions to surface the most impactful cost drivers. Total Spend by Trip Type distinguishes domestic, international, and client-facing trips. Total Travel Cost by Travel Class reveals whether business class vs economy usage is in line with policy. Total Travel Cost by Airline shows which carriers are consuming the largest share of the travel budget. And Total Spend vs Total Approved Budget by Service Type highlights where overspending is occurring at the service level — hotels, flights, ground transport, or meals.
 Cost Analysis
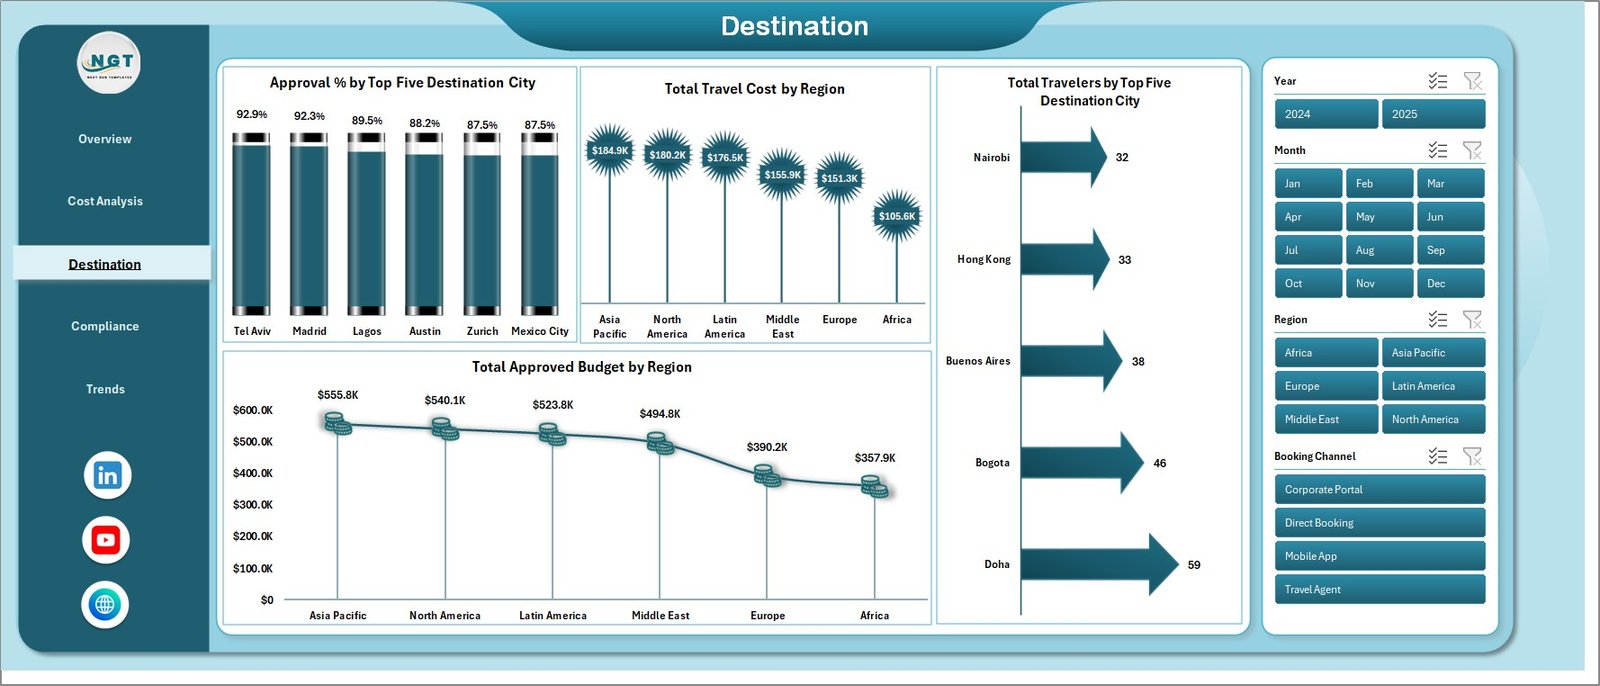
3 — Destination
The Destination page focuses on where your travelers are going and how much it costs. Approval % by Top Five Destination City shows which cities have the highest and lowest approval rates — a proxy for policy compliance by location. Total Travel Cost by Region gives a macro geographic view of spend. Total Travelers by Top Five Destination City shows headcount concentration, useful for negotiating preferred vendor rates. Total Approved Budget by Region lets you compare allocated budgets against actual usage at a regional level.
 Destination Analysis
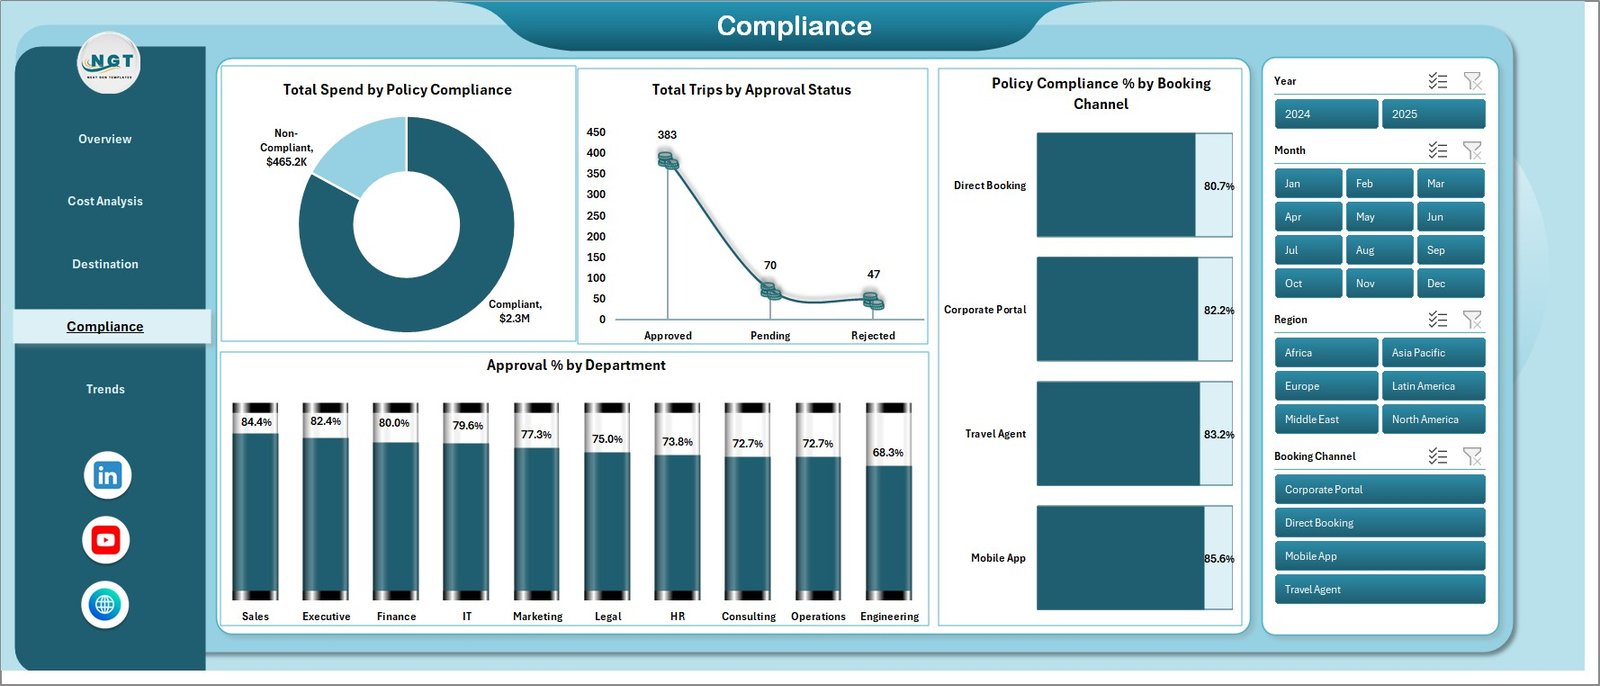
4 — Compliance
The Compliance page is designed for travel managers and finance auditors who need policy adherence reporting. Four views surface compliance risks: Total Spend by Policy Compliance separates in-policy from out-of-policy spend; Total Trips by Approval Status shows the proportion of approved, pending, and rejected trips; Policy Compliance % by Booking Channel identifies which channels (online booking tool, direct, agency) have the worst compliance rates; and Approval % by Department pinpoints which teams are the biggest policy offenders — critical for targeted training or process intervention.
 Compliance
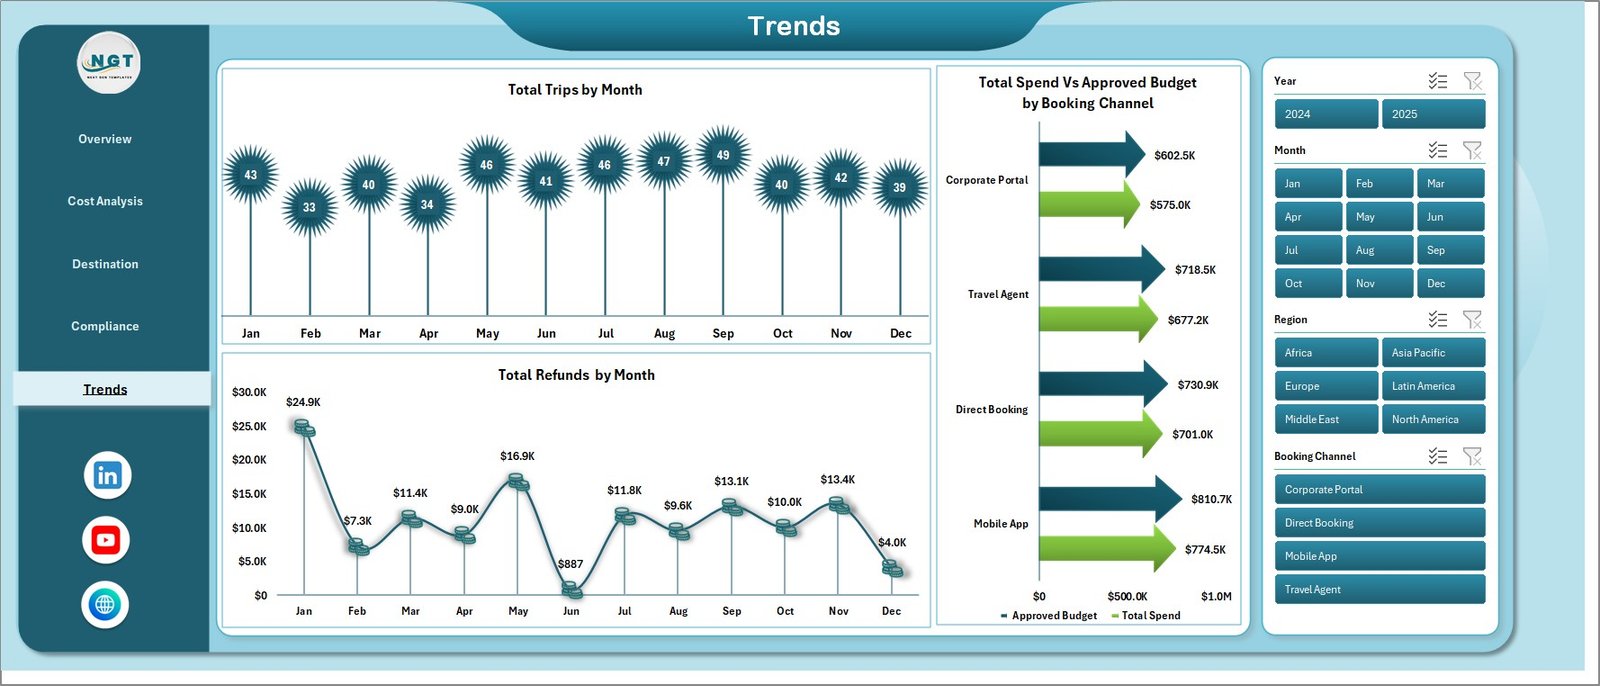
5 — Trends
The Trends page tracks movement over time using three charts. Total Trips by Month surfaces seasonal travel patterns so finance teams can forecast ahead of peak periods. Total Refunds by Month highlights months with unusually high cancellations or reimbursements — often tied to specific events or policy changes. Total Spend vs Approved Budget by Booking Channel shows, on a month-by-month basis, whether each channel is staying within allocated budgets or consistently drifting over.
 Trends
6 — Data Sheet
The Data sheet is where all input lives. Add your travel records in the pre-defined column format — each row represents a single trip or travel event with fields for traveler name, department, destination, service type, travel class, airline, booking channel, spend amount, approved budget, approval status, policy compliance flag, satisfaction score, and more. Keep the column headers intact and the pivot tables will pick up new rows automatically on the next refresh.
 Data Sheet Tab
7 — Support Sheet
The Support sheet contains all the underlying pivot tables that feed the 14 dashboard charts. You never need to touch this sheet during normal use — just click Data → Refresh All from the Excel Ribbon after updating the Data sheet, and every pivot refreshes simultaneously. If you want to add new charts or dimensions, extend the pivots here. In production, keep this sheet hidden to maintain a clean user experience.
 Support Sheet Tab
Business Travel Services Dashboard in Excel vs. Google Sheets vs. Paid Travel SaaS — Feature Comparison
| Feature | Business Travel Services Dashboard (Excel) | Google Sheets Dashboard | Concur / TripActions (Paid SaaS) |
|---|---|---|---|
| Cost | $17.99 one-time ✅ | Free (manual build) | $50–$150 / user / month |
| Platform | Microsoft Excel ✅ | Google Sheets (browser) | Cloud SaaS |
| Setup Time | <10 minutes ✅ | Hours (build from scratch) | Days (IT + SSO setup) |
| Works Offline | Yes ✅ | Limited | No |
| Pivot-Driven Refresh | One-click Refresh All ✅ | Manual formula updates | Auto (but locked) |
| Policy Compliance Tracking | Yes — 4 views ✅ | Manual build | Yes (at $$$) |
| Customizable Fields | Full Excel control ✅ | Yes | Limited / vendor-locked |
| Year-1 Cost at 10 Users | $17.99 total ✅ | $0 (self-built) | $6,000–$18,000 |
For travel managers who want real analytics without a SaaS contract, the Business Travel Services Dashboard in Excel sits in the sweet spot between free and over-engineered.
Who Should Use This Template
Perfect for:
- Corporate travel managers at SMEs (10–500 employees) tracking spend and compliance
- Finance analysts who report quarterly travel budgets vs actuals to leadership
- Operations managers running department-level travel cost reviews
- Business analysts who need a ready-made travel reporting framework
Not a fit if:
- You need live booking integration with Concur, Amex GBT, or Navan
- You require automatic data syncs from travel booking platforms
- Your team works exclusively in Google Sheets (check our Google Sheets dashboard templates instead)
Real-World Use Cases
Priya manages travel operations at a 120-person consulting firm. She uses the Business Travel Services Dashboard in Excel to submit monthly travel spend reports to the CFO, broken down by department, region, and airline. The pivot-refresh workflow has cut her monthly reporting time from 4 hours to under 30 minutes.
Marcus is a finance analyst at a mid-size tech company. He monitors policy compliance across 4 booking channels and flags departments with below-threshold approval rates using the Compliance page — insights that used to require a full day of manual VLOOKUP work.
Elena leads HR at a manufacturing group with offices in 3 regions. She uses the Destination and Trends pages each quarter to identify which cities are driving the highest refunds and which months see unexplained booking spikes — data points that feed directly into her annual travel policy review.
Advantages of the Business Travel Services Dashboard in Excel
- No subscription cost — one $17.99 purchase, unlimited use
- Instant deployment — download, paste your data, refresh, done
- Full transparency — every formula, pivot, and chart is visible and editable
- Works offline — no internet dependency, no cloud outage risk
- Covers the full travel analytics stack — spend, compliance, destination, trends in one file
Opportunities for Improvement
- No live booking system integration — data must be entered or pasted manually
- Not suited for real-time multi-user collaborative editing (use Google Sheets version for that)
- The Support sheet pivot tables require basic Excel familiarity to extend
Best Practices
- Keep the Data sheet column headers exactly as provided — pivot tables reference named fields
- Use Excel’s Data → Refresh All shortcut (Ctrl+Alt+F5) after each data update for fastest refresh
- Archive monthly snapshots by duplicating the Data sheet tab before adding new records
- Hide the Support sheet when distributing the file to non-technical stakeholders
- Use the Compliance page data as the basis for monthly travel policy email reminders to departments
Explore Relevant Templates
Looking for related Excel dashboards? Explore our Excel Dashboard Templates collection or check these related options:
- Fleet Management Dashboard in Excel
- Expense Tracking Dashboard in Excel
- Also available as a Google Sheets Dashboard
Frequently Asked Questions
What is the Business Travel Services Dashboard in Excel?
The Business Travel Services Dashboard in Excel is a 7-sheet Microsoft Excel workbook with 5 interactive dashboard pages, 5 KPI cards, and 14 pivot-driven charts for tracking business travel spend, compliance, destinations, and trends. It works in Excel 2016 and above with no macros required.
How do I update the dashboard with real data?
Paste or type your travel records into the Data sheet, keeping the column headers intact. Then click Data → Refresh All in the Excel Ribbon. All pivot tables and charts across all 5 pages update automatically — no manual formula changes needed.
Does the Business Travel Services Dashboard require macros or VBA?
No. The entire dashboard is built on native Excel pivot tables and standard chart objects. No macros, VBA, or add-ins are required. It works on all modern Excel versions including Microsoft 365, Excel 2021, 2019, and 2016.
How does this Excel dashboard compare to Concur or SAP Concur?
Concur starts at $8–$12 per user per month for basic expense management, scaling to $25–$75+ for full travel management. The Business Travel Services Dashboard delivers equivalent analytical reporting for a flat $17.99 — no per-user pricing, no IT setup, no annual contract.
Can I add my own custom KPIs or charts?
Yes. The Support sheet contains all underlying pivot tables. You can add new data columns to the Data sheet, extend the pivots in the Support sheet, and build additional charts using standard Excel tools. The architecture is fully open — nothing is locked or protected.
How many sheets does the file contain?
The Business Travel Services Dashboard in Excel contains 7 sheets: Overview, Cost Analysis, Destination, Compliance, Trends (5 dashboard pages), plus a Data entry sheet and a Support sheet with the pivot tables. The Support sheet can be hidden in production.
About the Author
Built by PK — Microsoft Certified Professional with 15+ years of Excel, Google Sheets, and Power BI experience. Founder of NextGenTemplates, reaching 300K+ subscribers across YouTube channels. Every template is hand-built and tested before release.
Conclusion
The Business Travel Services Dashboard in Excel gives finance teams, travel managers, and operations analysts a complete, ready-to-use reporting framework — 5 pages, 14 charts, and 5 KPI cards — without a SaaS subscription or IT dependency.
https://nextgentemplates.com/product/business-travel-services-dashboard-in-excel/
✅ Instant download · One-time payment · No subscription · Works in Excel 2016 and above
📺 Watch step-by-step tutorials on Youtube.com/@PK-AnExcelExpert
📅 Last updated: May 2026