Scholarship teams need clear reporting because award decisions, student outcomes, renewal rates, fund utilization, and donor expectations all move at the same time. A missed disbursement target or delayed application review can affect students directly, while unclear KPI reporting can make leadership meetings slower than they need to be. In this article we have created Scholarship Program KPI Scorecard in Excel. This is a ready to use Scorecard template designed to help education teams track monthly performance, compare actual results against targets, and review MTD and YTD trends in a structured Excel workbook.
The template is useful for universities, foundations, nonprofit education programs, training institutes, donor-funded programs, and scholarship administrators who want a practical KPI scorecard without buying a full scholarship management platform. Since it is built in Excel, teams can update data, adjust KPI definitions, and review results using a familiar tool.
Key Features of Scholarship Program KPI Scorecard in Excel
Below are the key features of this KPI Scorecard:
- Dropdown menus for month, MTD, and YTD performance analysis.
- Actual vs Target values for each scholarship program KPI.
- Visual indicators and conditional formatting for quick performance status review.
- KPI Trend sheet with Actual, Target, and PY trend charts.
- Input Data sheet for monthly KPI values, targets, and supporting metrics.
- KPI Definition sheet for KPI name, group, unit, formula, type, and definition.
- Simple Excel structure that can be adjusted for different scholarship program models.
Dashboard Pages Explanation
In this template, we have 4 worksheets. Each worksheet has a clear role so the scorecard is easy to maintain and easy to review.
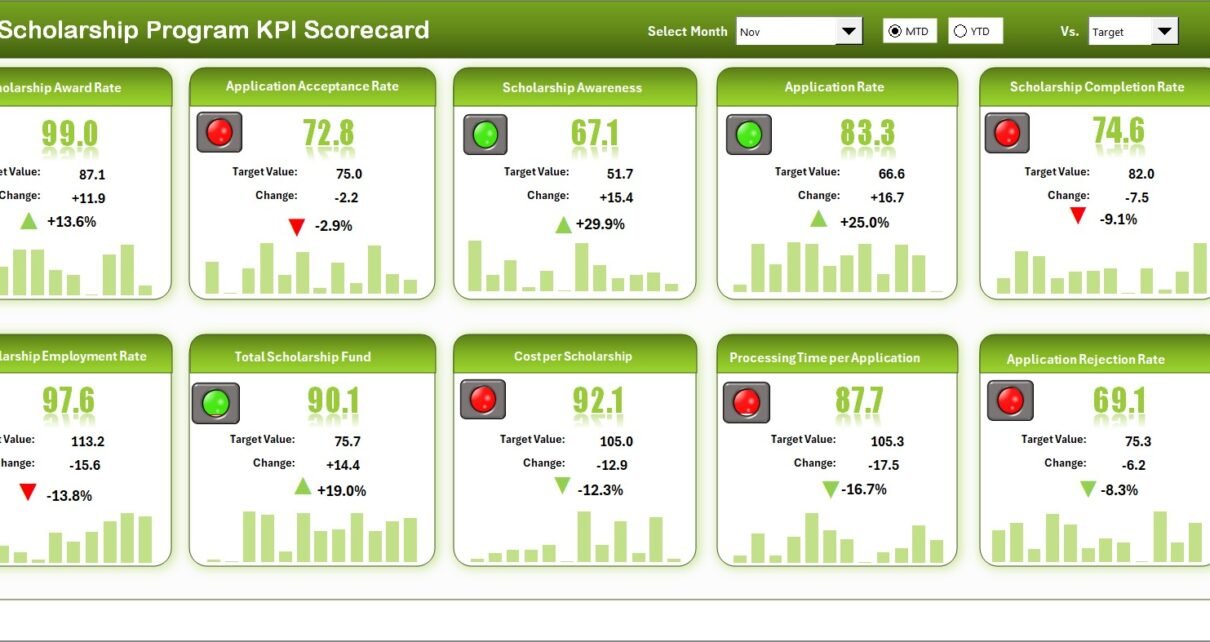
1. Scorecard Sheet
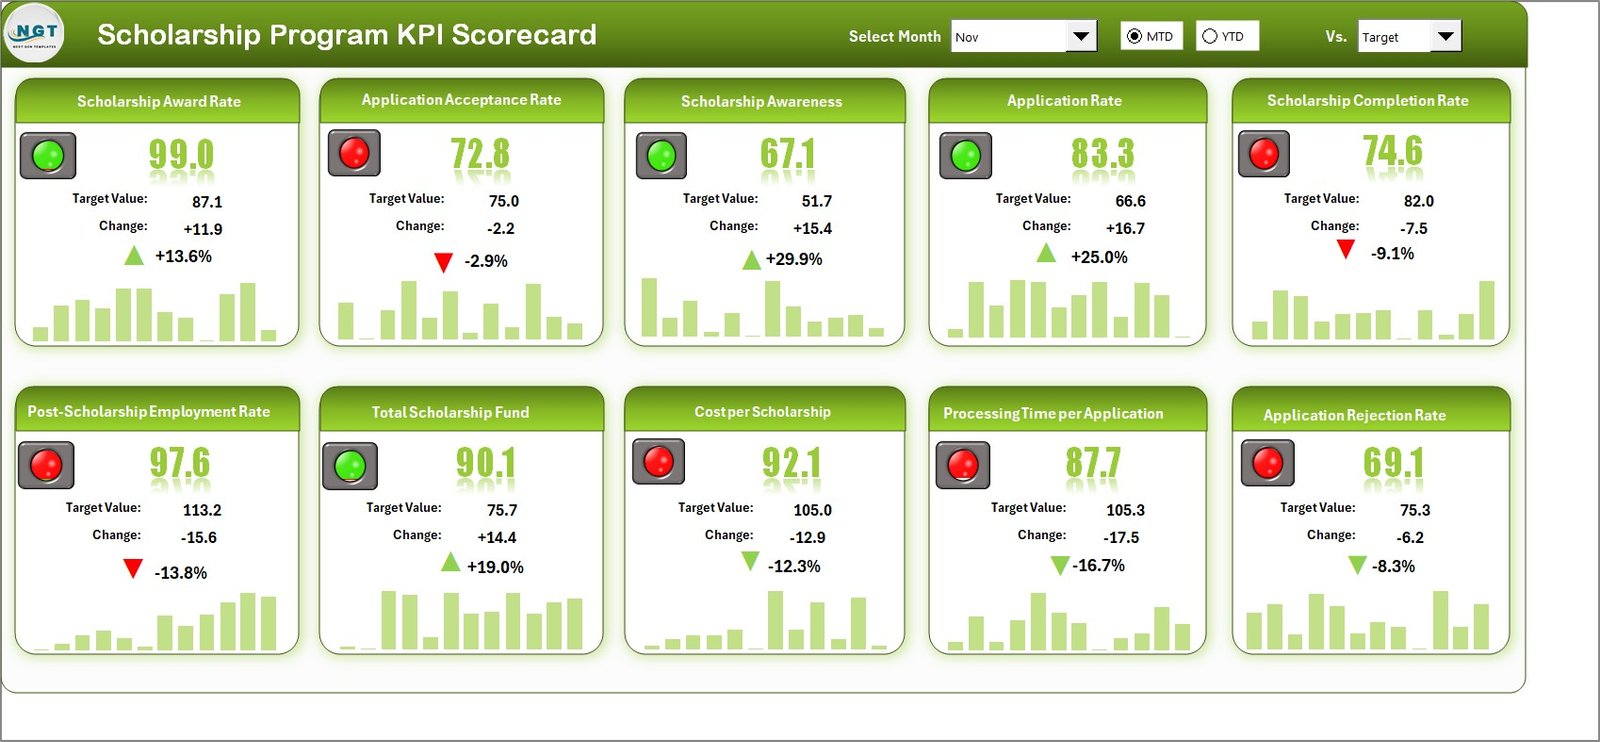
The Scorecard sheet is the main interface where you can view KPI performance. It brings the most important scholarship program measures into one view so managers can review results quickly. Dropdown menus allow you to select the month, MTD, or YTD view for performance analysis. This makes the same scorecard useful for monthly review meetings, year-to-date leadership updates, and donor reporting preparation.
The sheet compares actual performance against target values for each KPI. Visual indicators help you identify whether performance is on track, needs attention, or requires immediate action. Instead of reading through raw tables, users can scan the scorecard and quickly understand which metrics need follow-up.
2. KPI Trend Sheet Tab
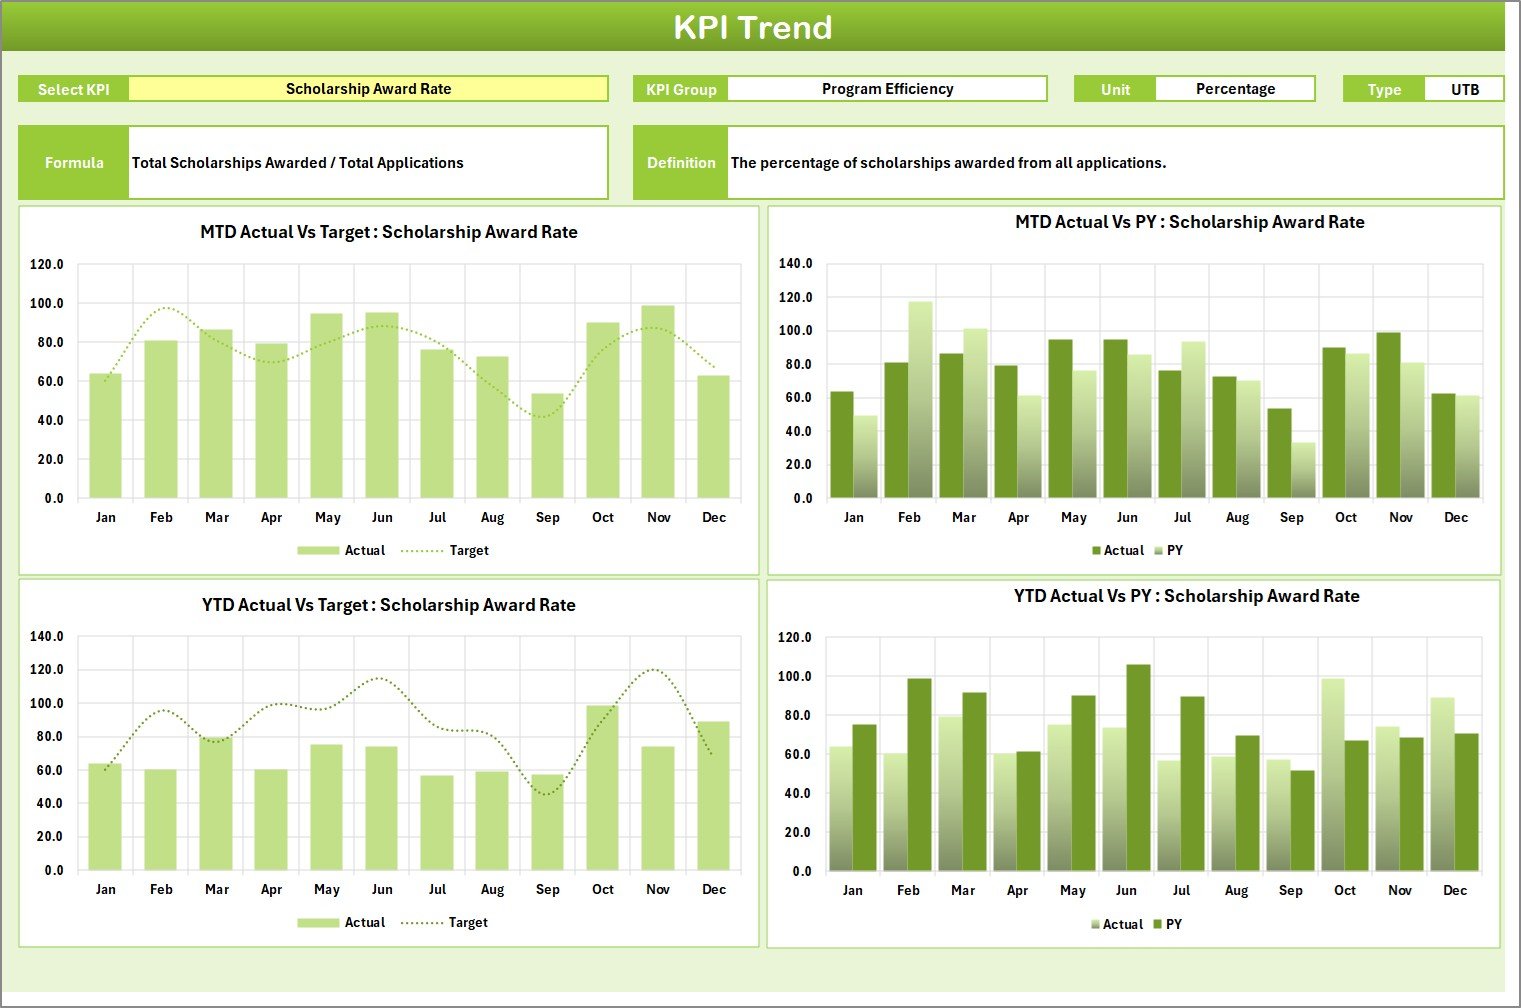
In the KPI Trend sheet tab, you can select the KPI name from the dropdown available in range C3. After selecting a KPI, the sheet displays the KPI Group, Unit of KPI, Type of KPI, Formula of the KPI, and Definition of the KPI. This is useful because users can understand not only the number but also the business meaning behind the number.
The sheet also shows MTD and YTD trend charts for Actual, Target, and PY numbers. These trend charts help program teams identify whether performance is improving, declining, or moving inconsistently over time. For example, an application completion rate might look acceptable in one month but show a downward trend across the year. The KPI Trend sheet makes those patterns easier to discuss.
3. Input Data Sheet
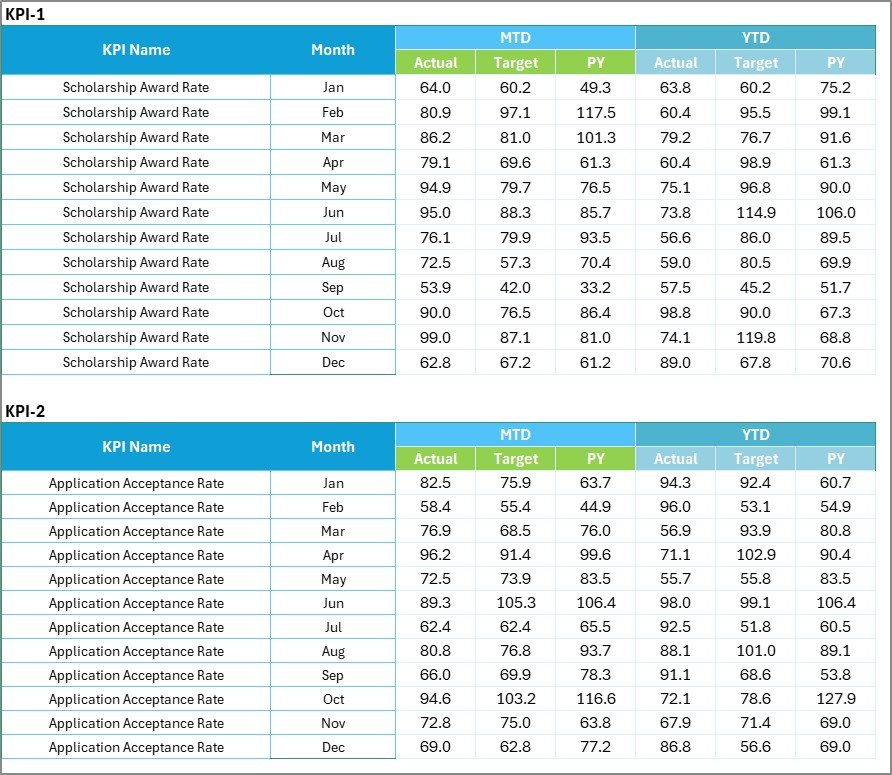
The Input Data sheet is where you enter all KPI data. Users can record actual values, targets, previous year values, and other metrics for each KPI. This creates a single structured place for monthly performance updates.
The biggest advantage of this sheet is flexibility. As new results become available, users can update the input table and keep the scorecard current. Scholarship teams can adapt the template to track metrics such as applications received, eligibility completion rate, awards issued, disbursement timeliness, renewal rate, fund utilization, student retention, and support request resolution time.
4. KPI Definition Sheet Tab
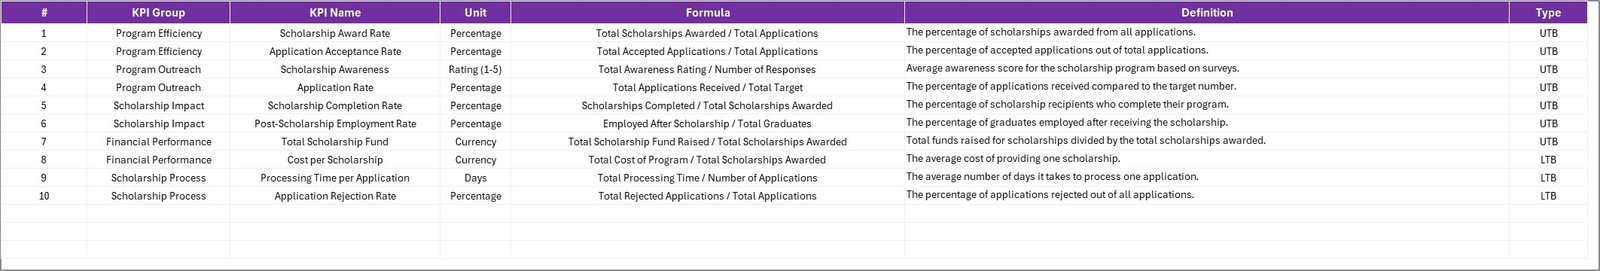
In the KPI Definition sheet tab, you enter the KPI Name, KPI Group, Unit, Formula, and KPI Definition. This sheet helps keep reporting consistent. When multiple people are involved in scholarship operations, definitions matter. A KPI like award utilization rate or application completion rate should mean the same thing every month.
You can also define the KPI type, such as whether a higher value is better or a lower value is better. This supports correct performance status calculation and makes the scorecard easier to interpret.
Scholarship Program KPI Scorecard in Excel vs. Google Sheets vs. Paid CRM/SaaS – Feature Comparison
| Feature | This Excel Scorecard | Google Sheets Alternative | Paid SaaS Alternative |
|---|---|---|---|
| Cost | One-time template purchase | Free or workspace subscription | Monthly or annual subscription |
| Platform | Microsoft Excel | Google Sheets | Cloud-based application |
| Setup time | Quick setup after download | Requires sharing and permissions | Requires onboarding and configuration |
| Real-time collaboration | Possible through OneDrive or SharePoint | Strong built-in collaboration | Usually included |
| Customizable fields | Fully editable workbook structure | Editable sheet structure | Depends on plan and admin controls |
| Scholarship KPI tracking | Purpose-built scorecard and trend sheets | Usually built manually | May be part of a broader system |
| Year-1 cost at 5 users | Low one-time cost | Depends on Google Workspace plan | Can become expensive quickly |
Who Should Use This Template
This template is a good fit for scholarship coordinators, program managers, nonprofit education teams, college financial aid analysts, donor reporting teams, and foundation administrators. It is especially useful when a team already collects data in Excel but wants a cleaner way to present performance.
It is not meant to replace a full applicant portal, student database, payment system, or automated workflow tool. If your team needs application intake, document upload, student messaging, or payment automation, this scorecard can support reporting but should not be treated as the full operations system.
Real-World Use Cases
Scholarship Program KPI Scorecard in Excel
Monthly Scholarship Review: A program manager can review application progress, award release status, renewal completion, and support performance before a leadership meeting.
Donor-Funded Program Reporting: A nonprofit director can prepare a clear view of actual vs target results for donor updates and board review.
College Financial Aid Operations: An analyst can track scholarship processing KPIs and identify delays before they affect students.
Advantages of Scholarship Program KPI Scorecard in Excel
The main advantage is speed. You do not need to design the workbook from scratch. The template already includes a Scorecard sheet, KPI Trend sheet, Input Data sheet, and KPI Definition sheet. Another advantage is control. Since the file is in Excel, users can edit KPI names, formulas, targets, and definitions based on their own scholarship model.
Excel also remains one of the most common tools for operational reporting. Microsoft provides extensive documentation for working with Excel formulas and tables, and users can learn more from Microsoft Excel support. This makes the template easier to adopt for teams that already use Microsoft Office.
Opportunities for Improvement
Scholarship Program KPI Scorecard in Excel
Every template has limits. This scorecard is built for reporting and performance review, not for collecting applications or managing applicant documents. Teams may also need to customize formulas if they add many new KPIs or change the underlying data structure. For larger organizations, connecting Excel to Power Query or a database could improve refresh workflows over time.
Best Practices
- Define every KPI clearly before entering monthly values.
- Use consistent KPI names between the Input Data and KPI Definition sheets.
- Review both MTD and YTD views before making decisions.
- Keep target values realistic and aligned with program goals.
- Back up the workbook before changing formulas or adding new KPI rows.
- Use trend charts to identify patterns, not just single-month performance.
Explore Relevant Templates
You can download the product draft here: Scholarship Program KPI Scorecard in Excel. You may also find these related templates useful: Educational Nonprofits Dashboard in Power BI, Secondary Schools Dashboard in Excel, and Colleges & Universities Dashboard in Excel.
Frequently Asked Questions
What is included in the Scholarship Program KPI Scorecard in Excel?
The workbook includes a Scorecard sheet, KPI Trend sheet, Input Data sheet, and KPI Definition sheet.
Can I change the KPIs?
Yes. You can update KPI names, groups, units, formulas, and definitions in the KPI Definition sheet.
Does the template support MTD and YTD reporting?
Yes. The template is designed for month, MTD, and YTD performance analysis.
Can nonprofits use this scorecard?
Yes. It is suitable for nonprofit scholarship programs, education foundations, donor-funded programs, and academic support teams.
Do I need advanced Excel skills?
Basic Excel knowledge is enough for data entry and review. Formula changes require more comfort with Excel.
Does this template include a YouTube video?
No YouTube video link was provided for this product, so no video embed is included.
About the Author
Built by PK – Microsoft Certified Professional with 15+ years of Excel, Google Sheets, and Power BI experience. Founder of NextGenTemplates, reaching 300K+ subscribers across YouTube channels. Every template is hand-built and tested before release.
Conclusion
The Scholarship Program KPI Scorecard in Excel gives scholarship teams a ready-to-use structure for monitoring performance, reviewing Actual vs Target values, and understanding monthly and year-to-date trends. With four focused worksheets, the template keeps KPI definitions, input data, scorecard results, and trend analysis connected in one workbook. For teams that need a practical Excel-based scorecard before investing in larger systems, this template is a strong starting point.
Scholarship Program KPI Scorecard in Excel
Visit our YouTube channel for Excel and dashboard tutorials: https://youtube.com/@PKAnExcelExpert