
The Compliance Audits Dashboard in Power BI is a ready-to-use .pbix dashboard for compliance managers, internal auditors, risk officers, and GRC consultants who need to track findings, penalties, overdue audits, audit cost, and controls performance in one place. Many audit teams still prepare monthly committee reports by exporting data from GRC tools, SharePoint lists, spreadsheets, and email trackers. That process can take 6 to 12 hours every month and still leave leaders asking for another slice by region, risk level, status, or department.
This Power BI template reduces that manual reporting work by organizing compliance audit records into 5 interactive report pages: Overview, Audit Analysis, Risk Assessment, Regional Compliance, and Trend Analysis. The template includes 5 KPI cards, 15 analytical visuals, and slicers so the same report can answer questions for audit committees, compliance heads, department leaders, and regional managers.
Click here to purchase the Compliance Audits Dashboard in Power BI
Key Features of Compliance Audits Dashboard in Power BI
- 5 executive KPI cards for Total Penalties, Total Findings, Total Critical Findings, Total Audit Cost, and Overdue Audits.
- 5 Power BI report pages built around audit leadership workflows: Overview, Audit Analysis, Risk Assessment, Regional Compliance, and Trend Analysis.
- 15 pre-built charts covering risk level, audit type, month, department, region, priority, status, controls pass rate, and remediation.
- Interactive slicers help users filter the dashboard quickly during audit reviews and management meetings.
- Editable Power BI Desktop file so teams can adjust visuals, connect new data sources, update colors, and add custom DAX measures.
- One-time purchase for teams that need audit visibility without starting with a full GRC software implementation.
Dashboard Pages Explanation
The dashboard is organized into five pages. Each page focuses on a specific audit reporting question, from executive summary to risk exposure, regional compliance, and trend monitoring.
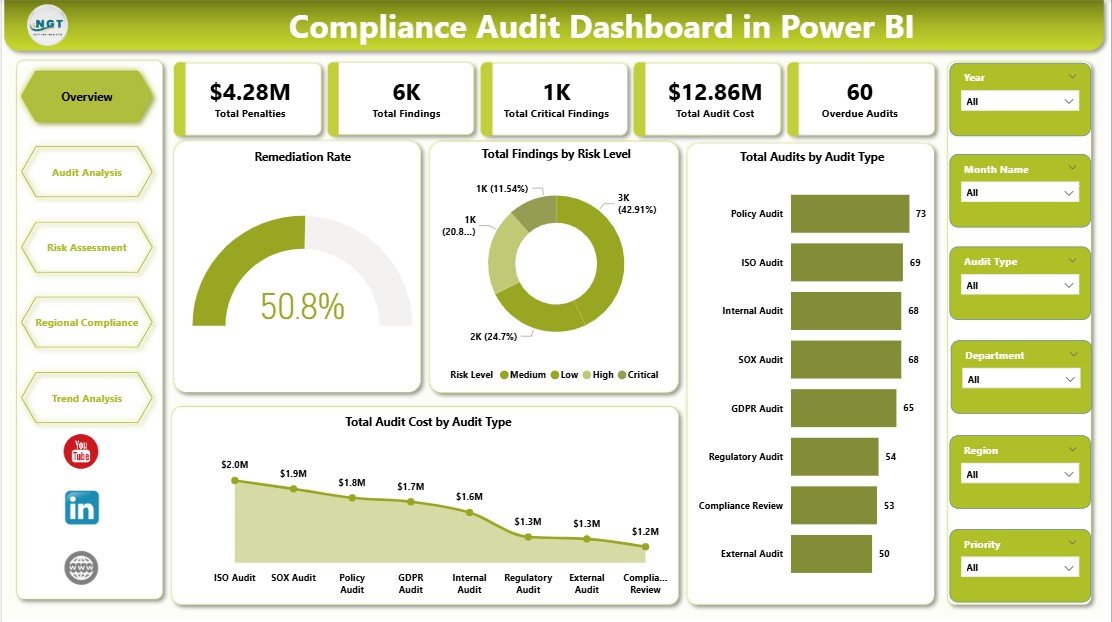
1 – Overview Page
The Overview page is the executive landing page. At the top of the page, the dashboard shows five cards: Total Penalties, Total Findings, Total Critical Findings, Total Audit Cost, and Overdue Audits. These cards give leadership a quick answer to the most common audit committee questions: how much exposure exists, how much it is costing, and where urgent follow-up is needed.
Remediation Rate shows the percentage of findings that have been remediated. This visual helps compliance leaders understand whether the organization is closing issues quickly enough or carrying too much unresolved risk.
Total Findings by Risk Level breaks findings into critical, high, medium, and low categories. It helps teams prioritize audit actions instead of treating all findings as equal.
Total Audits by Audit Type compares audit volume across internal, external, regulatory, IT, operational, or other audit types. This chart shows where audit effort is concentrated and where the team may be over- or under-sampling.
Total Audit Cost by Audit Type connects audit type to financial impact. It is useful for finance and compliance leaders who need to explain why certain audit areas consume more budget.
Compliance Audits Dashboard in Power BI
2 – Audit Analysis
The Audit Analysis page focuses on audit volume, timing, and department cost. It is designed for audit managers who need to understand where the audit workload is concentrated and whether audit activity is increasing or decreasing across the calendar.
Total Audits by Risk Level shows how many audits fall into each risk category. This helps teams confirm whether high-risk areas are receiving the right level of attention.
Total Audits by Month Name shows audit distribution by month. It helps managers spot busy periods, planning gaps, and seasonal audit workload pressure.
Total Audit Cost by Department compares audit spend across departments. This makes it easier to identify which functions require the most audit investment and where process improvements may reduce future cost.
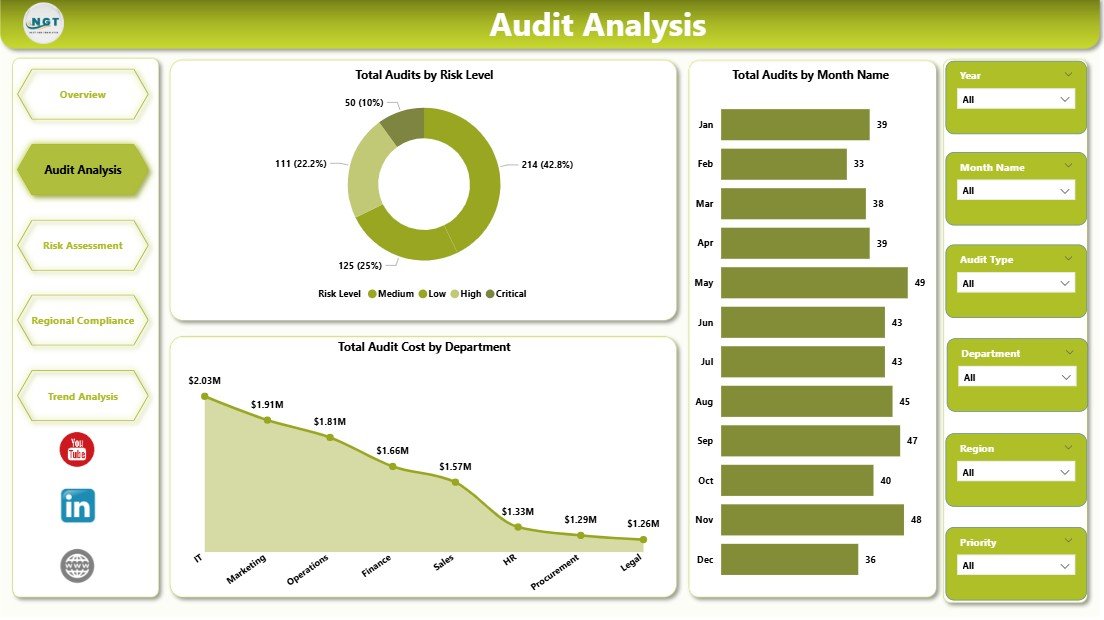
Audit Analysis
3 – Risk Assessment
The Risk Assessment page turns audit results into risk-focused decision support. It is especially useful for risk officers, SOX leaders, and compliance heads who need to prioritize remediation based on severity, geography, and urgency.
Total Audit Cost by Risk Level shows how much spend is attached to each risk level. This chart helps leaders understand whether critical or high-risk areas are driving a disproportionate share of cost.
Total Findings by Region compares findings across geographies. It helps regional managers see where controls are weaker and where training, process fixes, or leadership attention may be needed.
Total Audits by Priority shows the number of audits by priority level. This visual helps audit teams confirm whether urgent audits are being tracked separately from routine monitoring work.
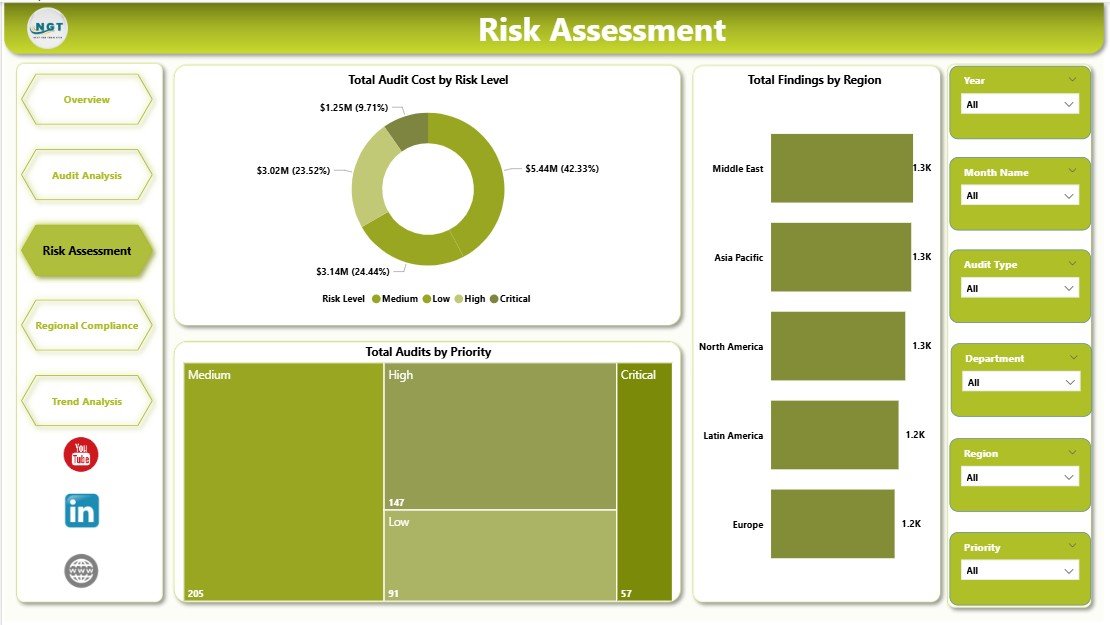
Risk Assessment
4 – Regional Compliance
The Regional Compliance page is built for organizations with multiple locations, countries, branches, plants, or business units. It helps management compare penalties, audit cost, and findings across regions without building separate reports for each location.
Total Penalties by Region shows where regulatory or compliance penalties are concentrated. This is one of the clearest visuals for identifying geographic compliance exposure.
Total Audit Cost by Region compares cost across regions. It helps finance and compliance teams understand where audit activity is becoming expensive and whether higher cost aligns with higher risk.
Total Findings by Department shows which departments are producing the most findings. This helps department heads focus process improvement efforts on the areas creating the largest control burden.
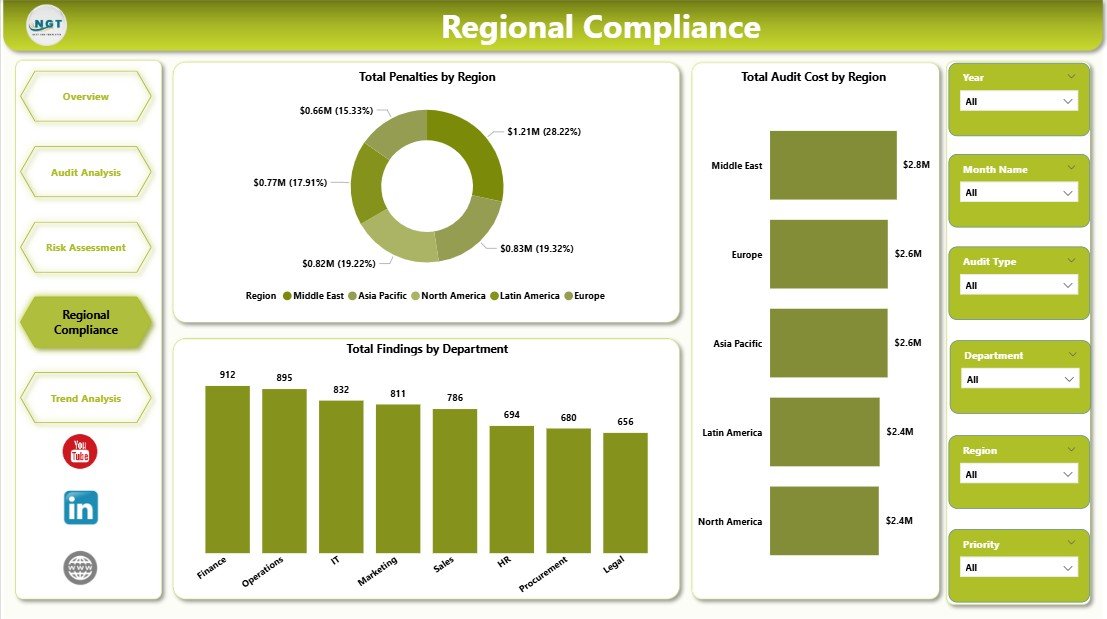
Regional Compliance
5 – Trend Analysis
The Trend Analysis page is designed for recurring management review. It helps audit committees and compliance leaders understand whether the organization is improving over time or simply creating the same issues every month.
Total Audits by Status shows open, in-progress, overdue, completed, and closed audit counts. It gives leaders a fast view of the audit pipeline and any backlog risk.
Controls Pass Rate by Region compares control effectiveness across regions. It helps teams identify locations where controls are consistently passing and locations that need stronger oversight.
Total Audit Cost by Month Name shows how audit cost changes month by month. This helps leadership monitor spending trends and connect cost spikes to audit cycles, regulatory reviews, or remediation pushes.
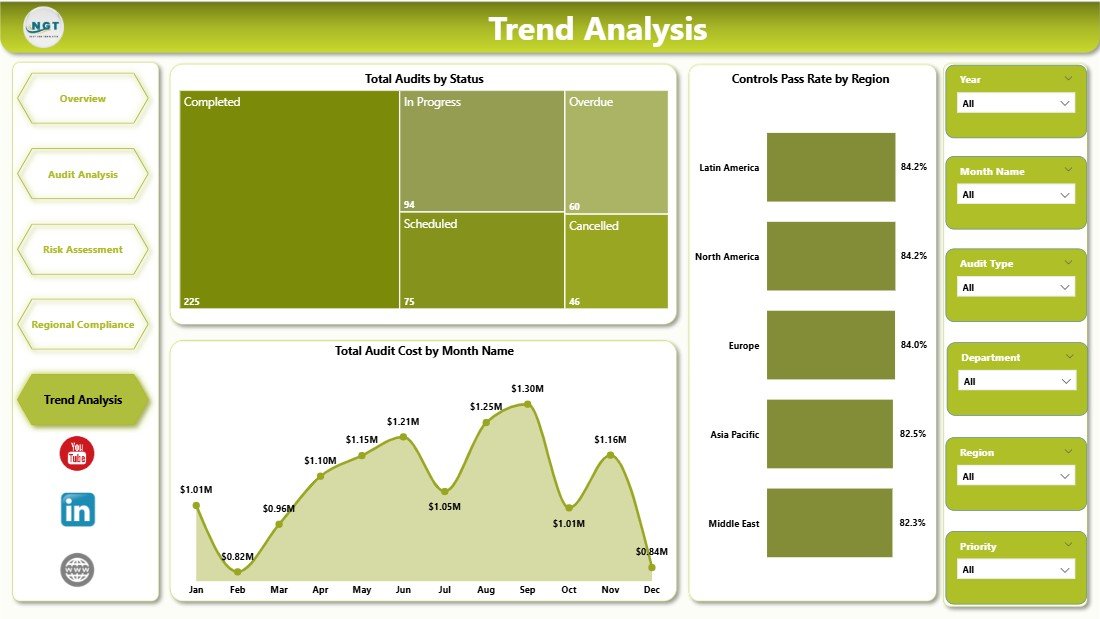
Trend Analysis
Compliance Audits Dashboard in Power BI vs. Tableau vs. Paid GRC SaaS – Feature Comparison
| Feature | Compliance Audits Dashboard in Power BI | Tableau or Qlik Alternative | Paid GRC SaaS |
|---|---|---|---|
| Cost | $17.99 one-time | $70+ per user per month plus build time | Often $30,000 to $250,000+ per year |
| Platform | Power BI Desktop | Tableau Desktop, Tableau Cloud, or Qlik | Vendor-hosted GRC platform |
| Setup time | Under 15 minutes with clean data | Hours or days to build from scratch | Weeks or months of onboarding |
| Pre-built audit pages | 5 report pages included | Custom development required | Included but vendor-controlled |
| Customizable fields | Editable in Power BI Desktop | Editable with BI skills | Limited to configured fields |
| Share with link | Possible through Power BI Service | Requires paid server/cloud option | Included in SaaS plan |
| Year-1 cost at 5 users | $17.99 total | About $4,200+ before build time | Often $30,000+ |
| Best fit | Fast audit reporting layer | Custom enterprise BI build | End-to-end workflow automation |
Who Should Use This Template
This template is a good fit for Chief Compliance Officers, internal audit managers, SOX program owners, GRC analysts, risk officers, regional compliance managers, and consultants who already collect audit data but need a better way to present it. It is especially useful when audit data lives in Excel exports, CSV files, SharePoint lists, or a GRC system that does not produce leadership-ready dashboards.
It is not the right tool if you need automated evidence collection, workflow approvals, live control testing, SSO, audit trails, or deep system integration. In those cases, a full GRC platform such as AuditBoard, LogicGate, MetricStream, ServiceNow GRC, or OneTrust may be more appropriate.
Real-World Use Cases
Anita, Head of Internal Audit at a multinational manufacturer, uses the Overview page before audit committee meetings to summarize penalties, findings, critical issues, audit cost, and overdue work. Instead of sending five separate spreadsheets, she filters the dashboard live by risk level and region.
Marco, SOX Program Manager at a public company, uses Audit Analysis and Risk Assessment to identify where high-priority audits are accumulating. The visuals help him focus remediation meetings on departments that create the most findings and cost.
Priya, GRC Consultant, uses the Regional Compliance page for client engagements. She creates one copy per client, connects their audit data, and quickly compares penalties, findings, and control pass rates across locations.
Advantages of Compliance Audits Dashboard in Power BI
- Speed: The report structure is already built, so teams can move from raw audit data to visual reporting faster.
- Cost control: A one-time template is easier to justify than a large GRC software subscription when the immediate need is reporting.
- Power BI flexibility: Users can add measures, change visuals, update fields, and connect to Excel, CSV, SQL, SharePoint, or other supported sources.
- Leadership clarity: KPI cards and page-level visuals make the dashboard easier to use in meetings than raw pivot tables.
- Data ownership: Teams can keep audit data in their own controlled environment and publish only when ready.
Opportunities for Improvement
The dashboard depends on clean source data. If region, department, audit type, risk level, or status names are inconsistent, the visuals will split those values into separate categories. Before using the dashboard for formal reporting, standardize your source values.
The template is descriptive analytics, not workflow automation. It shows audit performance, but it does not assign tasks, collect evidence, send reminders, or enforce approvals. Teams can extend the model with additional fields such as remediation owner, due date, root cause, control ID, framework, and evidence link.
Best Practices
- Keep field names consistent so slicers and visuals remain clean month after month.
- Refresh before every review meeting to avoid presenting stale audit status.
- Use risk level and priority slicers together when preparing executive updates.
- Track overdue audits weekly instead of waiting for month-end reporting.
- Publish through Power BI Service when stakeholders need browser access or scheduled refresh. Microsoft provides official guidance in the Power BI Desktop getting started documentation.
Explore Relevant Templates
- Compliance and Audit Dashboard in Power BI – a related Power BI compliance dashboard for audit and remediation reporting.
- Corporate Governance Dashboard in Power BI – useful for governance, risk, ESG, and compliance monitoring.
- Security Company Dashboard in Power BI – includes incident and SLA views for security operations teams.
- Browse all Power BI Dashboard Templates on NextGenTemplates.
Frequently Asked Questions
What KPIs does the Compliance Audits Dashboard in Power BI track?
It tracks Total Penalties, Total Findings, Total Critical Findings, Total Audit Cost, and Overdue Audits. Supporting charts cover remediation rate, findings by risk level, audit type, department, region, priority, status, controls pass rate, and monthly audit cost.
Do I need Power BI Pro to use this dashboard?
No. You can open and edit the .pbix file in Power BI Desktop, which is free. Power BI Pro is only needed if you want to publish the dashboard to Power BI Service and share it with other users.
Can I connect this dashboard to my own audit data?
Yes. Replace the sample audit data with your own source and refresh the report. Power BI can connect to Excel, CSV, SharePoint, SQL, and many other sources, depending on how your audit data is stored.
Is this dashboard suitable for SOX, ISO, HIPAA, GDPR, or PCI audits?
Yes. The dashboard is framework-neutral. You can use it for SOX, ISO, HIPAA, GDPR, PCI, internal control, regulatory, IT, operational, and regional compliance audits.
Can I customize the dashboard pages?
Yes. You can edit page names, visual titles, DAX measures, themes, slicers, and data connections in Power BI Desktop. The template is meant to be a starting point for your own audit reporting model.
Does this replace a GRC platform?
No. It replaces the reporting layer, not the full workflow layer. If you need approvals, evidence collection, automated testing, and enterprise audit trails, use a GRC platform and connect its export data to Power BI for dashboard reporting.
About the Author
Built by PK – Microsoft Certified Professional with 15+ years of Excel, Google Sheets, and Power BI experience. Founder of NextGenTemplates, reaching 300K+ subscribers across YouTube channels. Every template is hand-built and tested before release.
Conclusion
The Compliance Audits Dashboard in Power BI gives audit and compliance teams a practical reporting layer for penalties, findings, critical issues, audit cost, overdue work, regional compliance, and trend monitoring. It is a strong fit when your team already has audit records and needs a cleaner way to explain them to leadership.
Click here to purchase the Compliance Audits Dashboard in Power BI
Instant download. One-time payment. No subscription.
For step-by-step Excel and Power BI tutorials, visit Youtube.com/@PK-AnExcelExpert.
Last updated: May 18, 2026