Cross-border trade teams manage provider fees, shipment status, duty savings, service charges, compliance results, origin countries, destination lanes, and commodity-level movement every month. When those numbers are scattered across spreadsheets, email exports, and operational reports, managers can miss cost trends until margin has already been affected. The Cross-border Trade Services Dashboard in Power BI gives import-export, freight, customs brokerage, logistics, and finance teams a visual reporting file for reviewing trade service performance in one place.
This Power BI dashboard template includes five report pages: Overview, Provider View, Lane Analysis, Compliance, and Financials. It is built for teams that want an editable .pbix reporting layer, not a locked SaaS dashboard. You can update the source data, refresh the Power BI file, use slicers, and quickly review trade value, service fee, total engagements, duty savings, net fee, compliance status, and provider cost behavior.
Click here to purchase Cross-border Trade Services Dashboard in Power BI
Key Features of Cross-border Trade Services Dashboard in Power BI
- Five Power BI report pages: Overview, Provider View, Lane Analysis, Compliance, and Financials.
- Top-level KPI cards: Total Trade Value, Total Service Fee, Total Engagements, Total Duty Savings, and Net Fee.
- Interactive slicers: Filter the report by available trade dimensions for quick review meetings.
- Provider reporting: Compare provider value, service fee, commodity contribution, and country performance.
- Lane analysis: Review destination-country trade value, quarterly net fee, and compliance status.
- Compliance analysis: Track commodity engagement, clearance rate, and monthly net fee patterns.
- Financial view: Analyze compliance cost, net fee, trade value, and provider-level contribution.
- Editable .pbix template: Customize visuals, measures, colors, fields, and data connections inside Power BI Desktop.
The dashboard is useful when managers need both a high-level executive view and focused pages for provider, lane, compliance, and financial review. For broader Power BI learning, Microsoft’s official Power BI documentation is available here: Microsoft Power BI documentation.
Dashboard Pages Explanation
1. Overview Page
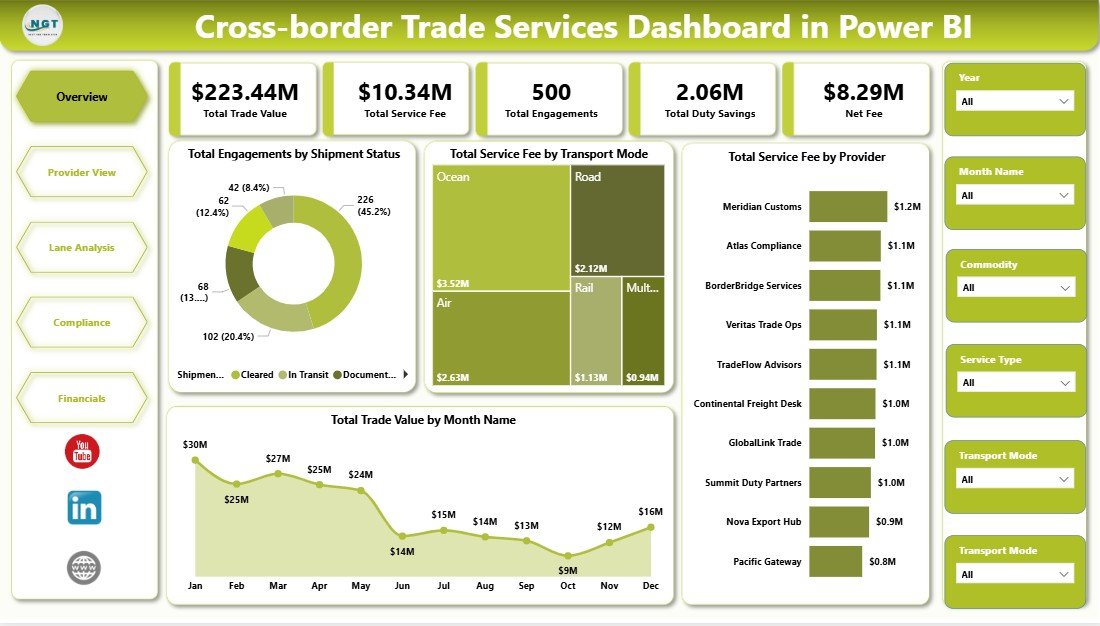
The Overview page is the main control view of the report. At the top, it shows five headline KPI cards: Total Trade Value, Total Service Fee, Total Engagements, Total Duty Savings, and Net Fee. These cards help users understand trade scale, fee exposure, activity volume, savings impact, and margin contribution before drilling into detailed visuals.
Total Engagements by Shipment Status shows how trade activities are distributed across shipment outcomes. It helps operations teams identify whether records are completed, pending, delayed, or sitting in exception categories.
Total Service Fee by Transport Mode compares service fees across movement types such as air, sea, road, rail, or other modes. This helps logistics and finance teams understand where fee pressure is strongest.
Total Service Fee by Provider ranks providers by fee contribution. It is helpful for vendor reviews, negotiations, and identifying cost concentration.
Total Trade Value by Month Name shows month-wise trade value movement. It helps leadership spot seasonality, sudden spikes, slower periods, and reporting trends over time.
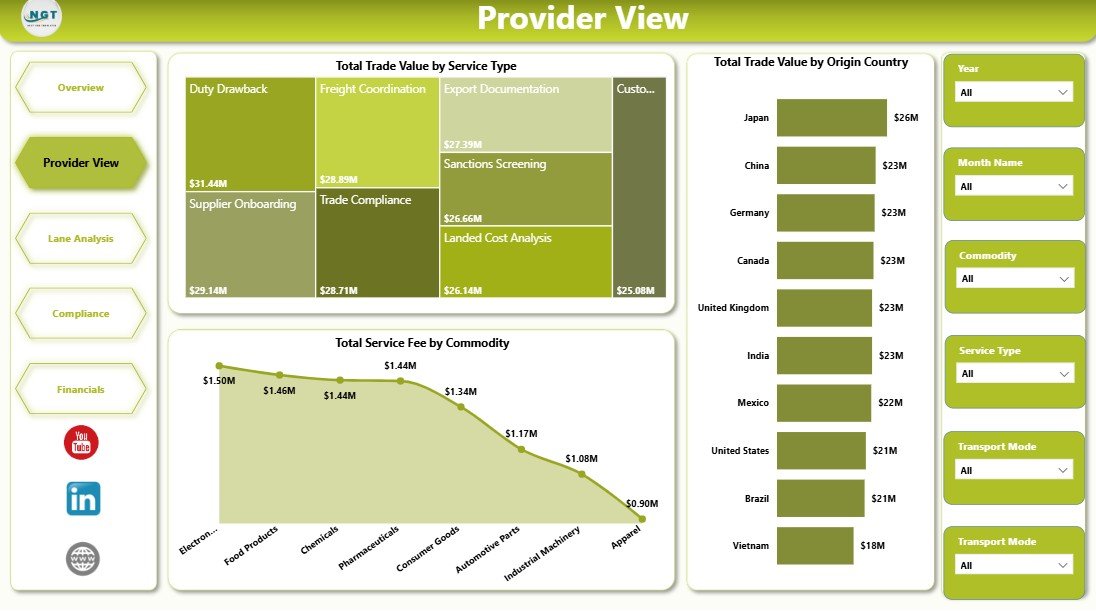
2. Provider View
The Provider View page focuses on service type, commodity, origin country, and provider behavior. This is where managers can review which service categories, commodities, and source countries are driving the highest values and fees.
Total Trade Value by Service Type shows which service categories carry the highest trade value. It helps teams understand the service mix and prioritize high-value operational areas.
Total Service Fee by Commodity compares fee amounts across commodity groups. This can reveal where documentation, handling, compliance, or service complexity may be increasing cost.
Total Trade Value by Origin Country shows which source countries contribute the most trade value. Use this for sourcing analysis, country-level risk review, and trade-lane planning.
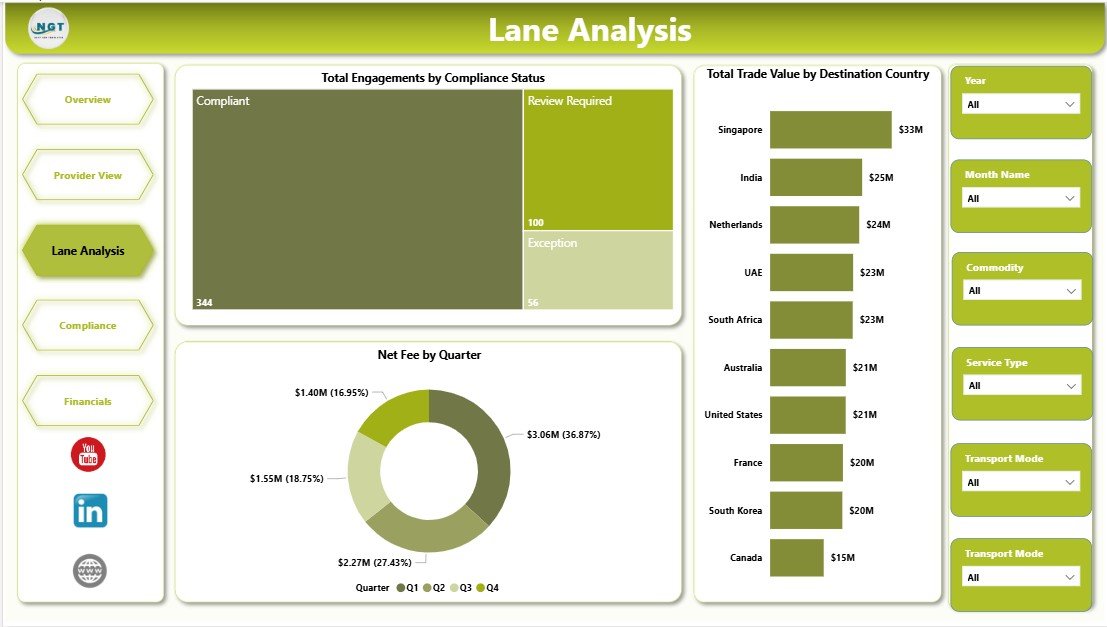
3. Lane Analysis
The Lane Analysis page helps teams understand trade movement by destination market, compliance status, and quarter. It is useful for operational reviews where the team needs to understand which lanes carry the highest value and which areas may need compliance attention.
Total Engagements by Compliance Status shows the volume of records by compliance category. This helps compliance teams quickly identify whether more engagements are compliant, pending, under review, or non-compliant.
Net Fee by Quarter compares net fee performance across quarters. This view supports seasonal analysis and helps finance teams review whether fee contribution is improving or weakening over time.
Total Trade Value by Destination Country shows where trade value is being delivered. It helps managers prioritize key destination markets and understand exposure by country.
Click here to purchase Cross-border Trade Services Dashboard in Power BI
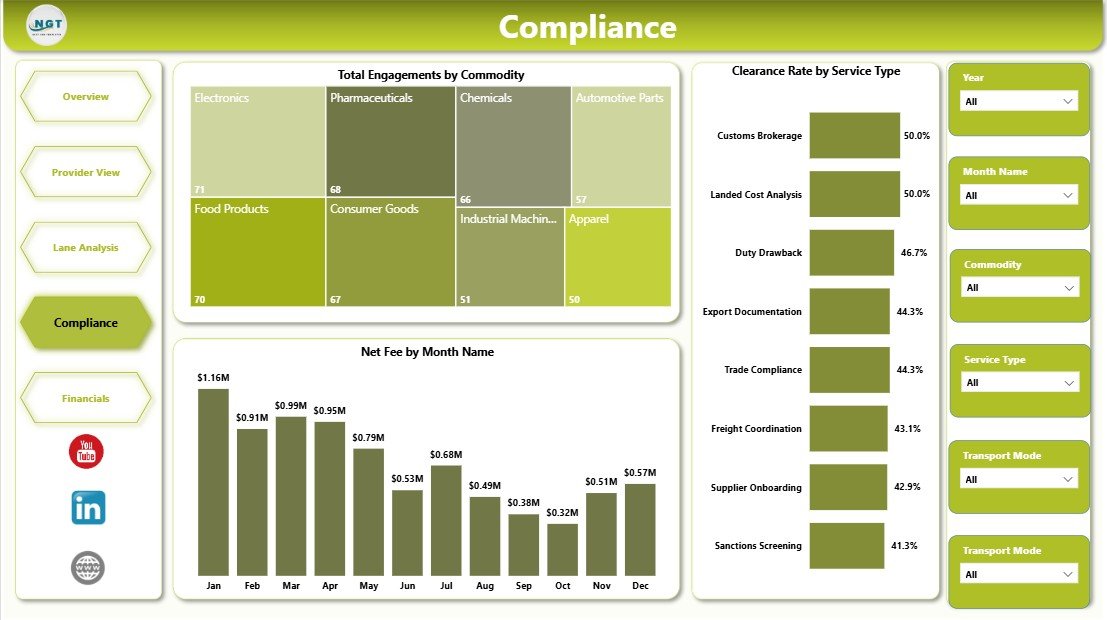
4. Compliance
The Compliance page is built for customs, documentation, and process-quality review. It helps teams connect activity volume, monthly net fee, and clearance performance so compliance conversations are based on clear numbers.
Total Engagements by Commodity shows which commodity groups create the highest activity volume. This is useful when compliance teams need to focus training, document checks, or process improvement on the busiest commodity groups.
Net Fee by Month Name tracks monthly net fee patterns. It helps users see whether monthly fee contribution is stable, improving, or affected by operational issues.
Clearance Rate by Service Type compares clearance performance across service categories. This helps teams identify where turnaround, documentation, or process discipline may need improvement.
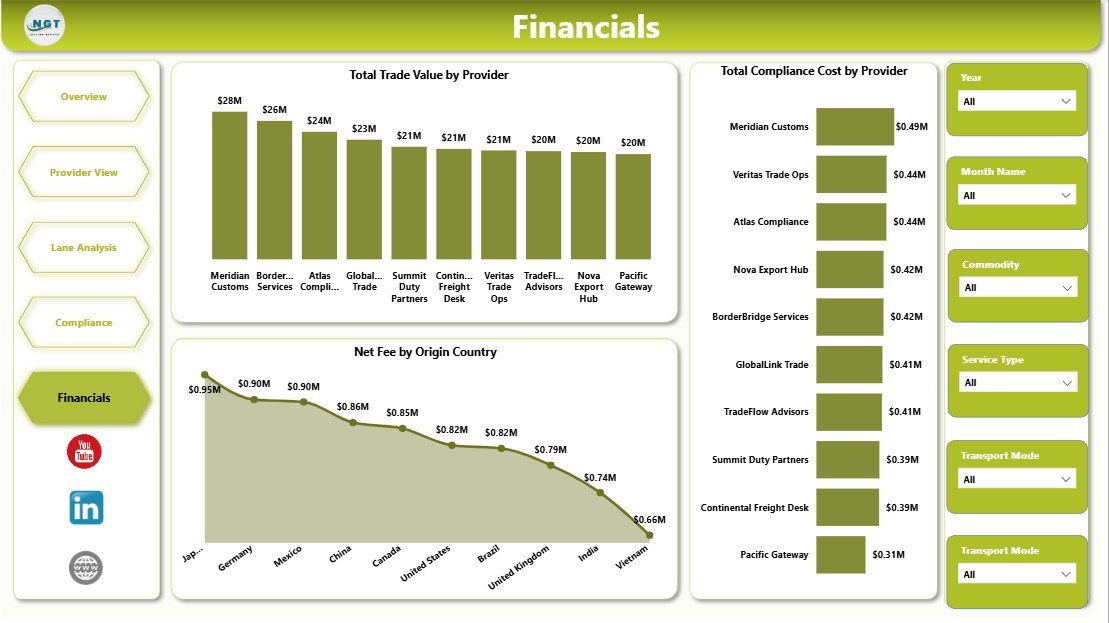
5. Financials
The Financials page supports fee, cost, and provider-value analysis. It gives finance managers and operations leaders a focused place to review trade value, net fee, origin-country contribution, and compliance cost.
Total Trade Value by Provider shows which providers are connected with the highest trade value. It helps with provider performance review and relationship management.
Net Fee by Origin Country compares net fee by source market. It can reveal where contribution is strongest and where origin-country operations may need closer review.
Total Compliance Cost by Provider highlights provider-level compliance cost. This can support cost-control discussions, vendor negotiation, and process improvement.
Cross-border Trade Services Dashboard in Power BI vs. Tableau vs. Paid Logistics SaaS – Feature Comparison
| Feature | This Power BI Dashboard | Tableau Alternative | Paid Logistics SaaS |
|---|---|---|---|
| Cost | One-time template purchase | Requires Tableau licensing or setup | Recurring monthly or annual fee |
| Platform | Power BI Desktop and Power BI Service | Tableau Desktop or Cloud | Vendor cloud platform |
| Setup time | Open .pbix, update source, refresh | Dashboard must be rebuilt or adapted | Implementation and onboarding required |
| Real-time team collaboration | Possible through Power BI Service | Possible through Tableau Cloud | Usually included with user roles |
| Mobile access | Available through Power BI mobile apps | Available through Tableau mobile access | Depends on vendor |
| Customizable fields | Editable in Power BI Desktop | Editable with Tableau skills | Plan and vendor dependent |
| Share with link | Possible after publishing with permissions | Possible in Tableau Cloud | Usually login-based |
| Year-1 cost at 5 users | Template price plus any Power BI licensing | Higher BI licensing and build cost | Often hundreds or thousands of dollars |
| Trade-service analysis | Provider, lane, compliance, and financial pages included | Must be recreated | May require higher-tier analytics module |
Who Should Use This Template
This template is designed for freight forwarders, customs brokers, import-export companies, trade service providers, logistics analysts, finance teams, operations managers, compliance leads, and consultants who prepare trade-service reporting for clients. It is especially useful when the organization already captures provider, commodity, country, fee, shipment, and compliance data but needs a cleaner Power BI reporting layer.
It is not intended to replace a transportation management system, customs filing platform, ERP, or live shipment tracking tool. Teams that need operational workflows should keep using those systems and use this dashboard for reporting, review, and management analysis.
Real-World Use Cases
Aarav, Trade Operations Manager: Aarav opens the Overview and Lane Analysis pages before weekly trade reviews to understand shipment status, destination-country value, and compliance status.
Meera, Compliance Lead: Meera uses the Compliance page to review commodity activity and clearance rate by service type, then focuses team training on categories with weaker performance.
Daniel, Finance Analyst: Daniel reviews the Financials page to compare total trade value, net fee, and compliance cost by provider and origin country before monthly reporting.
Cross-border Trade Services Dashboard in Power BI
Advantages of Cross-border Trade Services Dashboard in Power BI
- Gives a structured Power BI reporting file instead of starting from a blank report.
- Combines operational, provider, lane, compliance, and financial views in one dashboard.
- Uses slicers for quick filtering during management reviews.
- Supports recurring trade-service reporting with editable visuals and fields.
- Works well as a reporting layer beside ERP, TMS, customs, or shipment systems.
- Can be customized by Power BI users who want to adapt measures, visuals, or branding.
Opportunities for Improvement
The dashboard does not include automatic live integration with customs portals, carrier systems, ERP software, or transportation management platforms. Users who need live data refresh must connect the .pbix file to their own data source through Power Query or another supported connector.
The value of the dashboard also depends on clean source data. Provider names, shipment status labels, service types, country names, commodity names, and date fields should be standardized before refresh. This keeps slicers and visuals clean.
Best Practices
- Keep provider, commodity, service type, and country naming consistent.
- Refresh the report after every source-data update.
- Use the Overview page first, then move into Provider View, Lane Analysis, Compliance, and Financials for deeper review.
- Validate duty savings, service fee, net fee, and compliance cost fields before presenting results.
- Publish to Power BI Service only after confirming permissions and data privacy rules.
- Keep a backup copy before changing measures, relationships, or report pages.
Explore Relevant Templates
- Cross-border Trade Services Dashboard in Power BI – purchase this Power BI dashboard template.
- Cross-border Trade Services Dashboard in Excel – Excel version for teams that prefer workbook reporting.
- Cross-border Trade Services KPI Dashboard in Excel – KPI-focused tracking version.
- Port Logistics Dashboard in Power BI – related logistics reporting dashboard.
- Browse Power BI dashboard templates.
Frequently Asked Questions
What is the Cross-border Trade Services Dashboard in Power BI used for?
It is used to analyze cross-border trade services performance, including trade value, service fee, engagements, duty savings, net fee, compliance status, providers, commodities, countries, and transport modes.
Do I need Power BI Desktop?
Yes. You need Power BI Desktop to open and edit the .pbix file. Power BI Service may be used if you want online sharing and scheduled refresh.
Cross-border Trade Services Dashboard in Power BI
Can I use my own data?
Yes. Replace or connect the sample data source with your own trade-service data, then refresh the report.
Can I customize the visuals?
Yes. Since this is a Power BI file, you can edit visuals, colors, measures, page names, slicers, and data connections.
Does the dashboard include live shipment tracking?
No. It is a reporting dashboard, not a live tracking or customs filing system. You can connect it to supported data sources if your workflow requires automation.
Who benefits most from this dashboard?
Trade service providers, customs brokers, logistics managers, compliance teams, finance analysts, and import-export companies can benefit from this dashboard.
About the Author
Built by PK – Microsoft Certified Professional with 15+ years of Excel, Google Sheets, and Power BI experience. Founder of NextGenTemplates, reaching 300K+ subscribers across YouTube channels. Every template is hand-built and tested before release.
Conclusion
The Cross-border Trade Services Dashboard in Power BI gives trade service teams a practical way to review provider fees, trade value, duty savings, shipment status, compliance status, lane performance, commodity engagement, clearance rate, and compliance cost from one editable report. Instead of manually building a Power BI file from the ground up, users can start with a ready-made structure and adapt it to their own data.
For teams that already collect cross-border trade data, this dashboard can reduce reporting preparation time and make review meetings more focused. Use the Overview page for a high-level read, then move into Provider View, Lane Analysis, Compliance, and Financials for deeper insights.
Visit our YouTube channel for step-by-step Excel and Power BI dashboard tutorials.
Learn how the Cross-border Trade Services Dashboard in Power BI tracks trade value, fees, duty savings, providers, lanes, compliance, and financials.