DIY Craft Marketplaces Dashboard in Excel is a ready-to-use reporting workbook for handmade sellers, Etsy-style shops, craft marketplace operators, and ecommerce analysts who need clear visibility into revenue, net profit, units, orders, categories, regions, order status, customer type, delivery performance, and marketplace ratings. Handmade businesses often manage sales across several channels, and even a small difference in fees, costs, delivery performance, or customer ratings can change profit quickly. This Excel dashboard gives you 5 analysis pages, 4 high-level KPI cards, multiple slicers, a structured Data Sheet, and a Support Sheet with pivot tables so you can update data and refresh the full dashboard quickly.
Download the DIY Craft Marketplaces Dashboard in Excel from NextGenTemplates.
Key Features of DIY Craft Marketplaces Dashboard in Excel
- 5 dashboard pages: Overview Page, Marketplace Analysis, Category Insights, Regional Trends, and Order Insights.
- 4 KPI cards: Total Revenue, Net Profit, Total Units, and Total Orders.
- Marketplace comparison: Review net profit, units, profit margin, and average rating by marketplace.
- Product category reporting: Compare revenue, cost, units, average order value, and category sales.
- Regional performance: Track revenue, net profit, units, orders, and delivered percentage by region.
- Order behavior: Analyze order status, customer type, and monthly order movement.
- Interactive slicers: Filter the dashboard quickly and review selected marketplace, region, category, month, or status views.
- Pivot-driven refresh: Update the Data Sheet, click Data > Refresh All, and refresh the charts.
Dashboard Pages Explanation
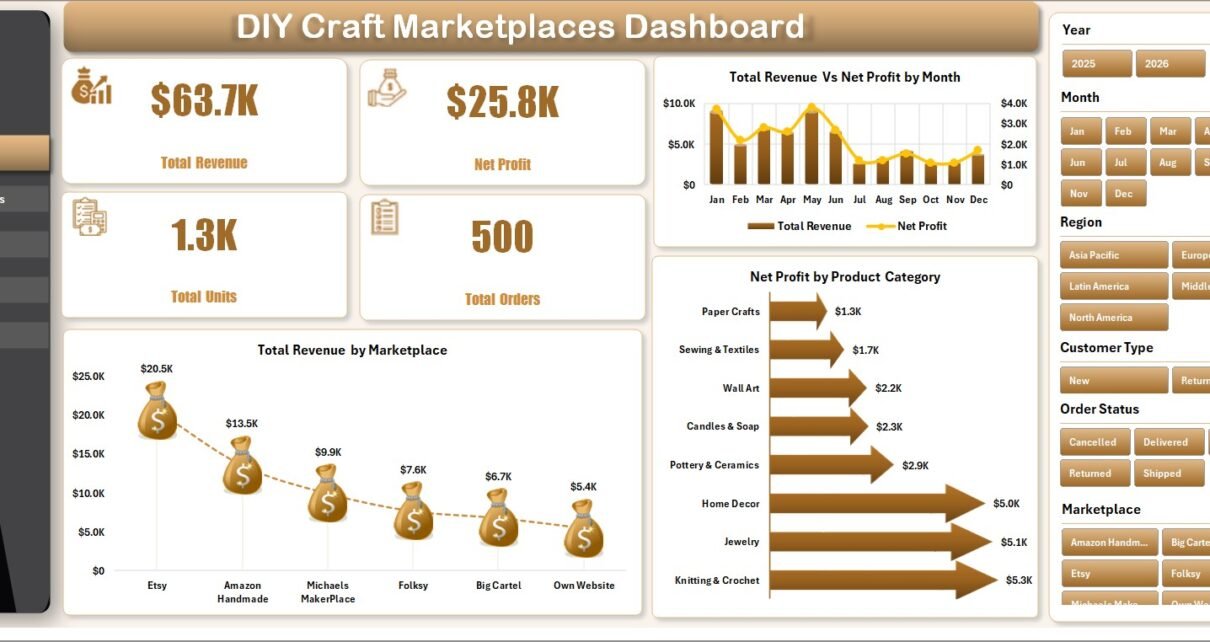
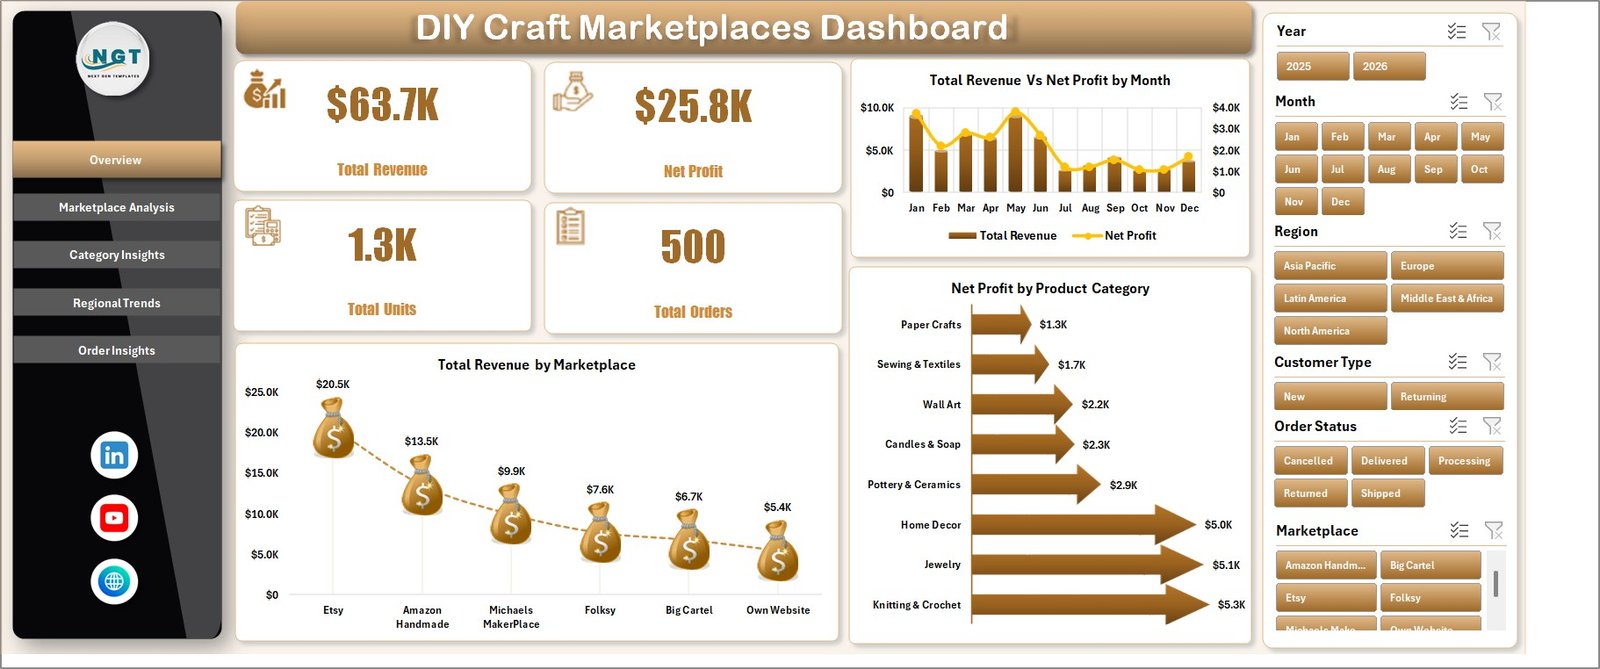
1. Overview Page
The Overview Page provides the high-level dashboard summary. At the top, KPI cards show Total Revenue, Net Profit, Total Units, and Total Orders. These cards help sellers understand sales scale, profitability, product movement, and order volume before moving into detailed analysis.
Total Revenue Vs Net Profit by Month: This chart compares revenue and profit across months. It helps you see whether monthly revenue growth is also increasing net profit after costs, marketplace fees, and fulfillment impact.
Total Revenue by Marketplace: This chart shows which selling channel contributes the most revenue. Use it to compare marketplace performance and decide where to focus marketing, listings, and seller effort.
Net Profit by Product Category: This visual identifies the product categories that deliver the strongest return. It supports pricing reviews, production planning, and product mix decisions.
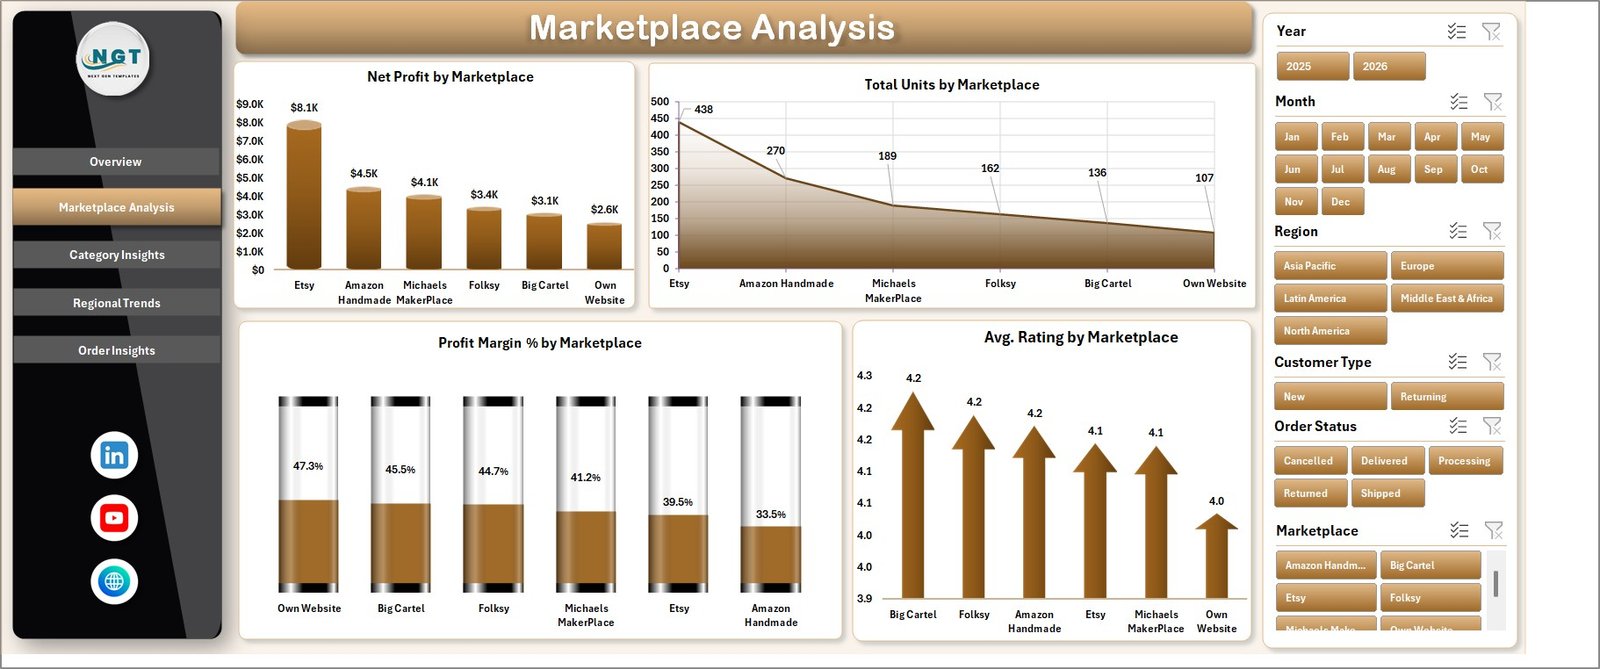
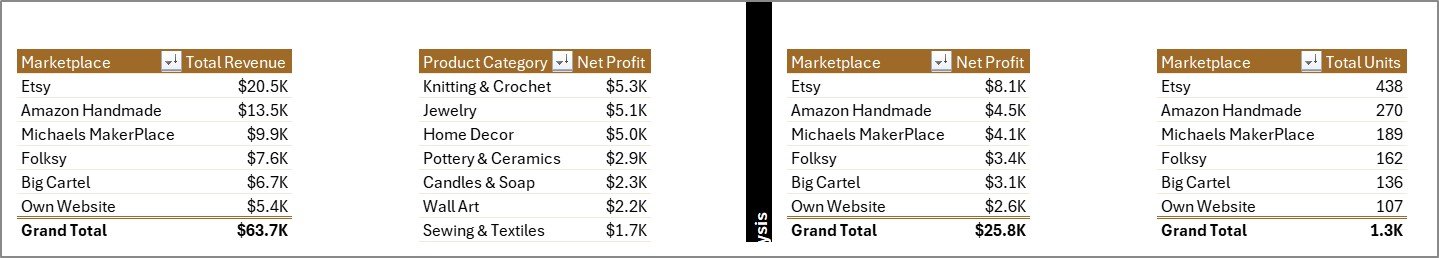
2. Marketplace Analysis
The Marketplace Analysis page compares performance across selling channels. It includes Net Profit by Marketplace, Total Units by Marketplace, Profit Margin % by Marketplace, and Avg. Rating by Marketplace.
Net profit shows which marketplace keeps the strongest return after cost impact. Total units explains where product volume is moving, while profit margin and average rating help connect channel economics with customer satisfaction.
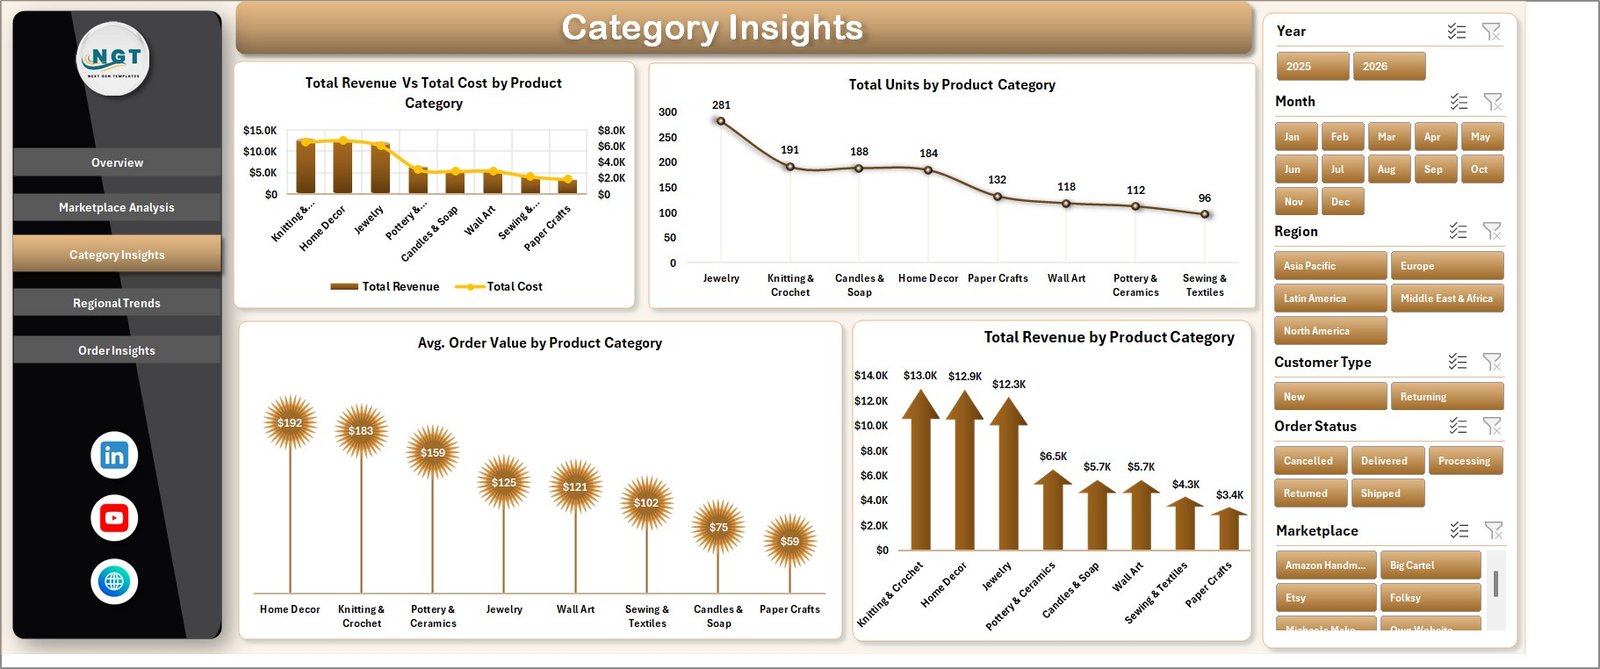
3. Category Insights
The Category Insights page helps sellers understand how handmade product groups perform. It includes Total Revenue Vs Total Cost by Product Category, Total Units by Product Category, Avg. Order Value by Product Category, and Total Revenue by Product Category.
This page is useful when deciding which categories deserve more production time, promotion budget, or inventory attention. If one category sells many units but has weak order value or high cost, you can investigate pricing and material costs.
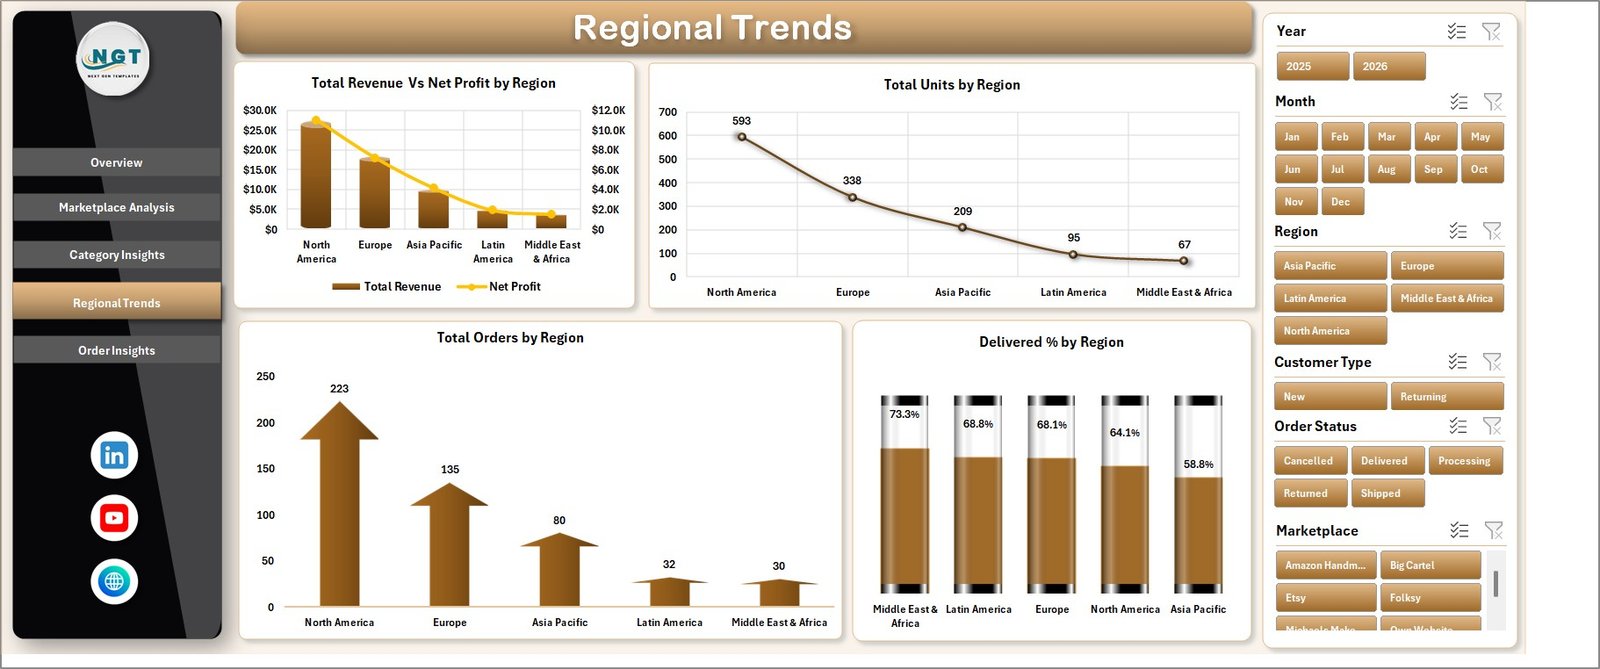
4. Regional Trends
The Regional Trends page reviews geographic performance. It includes Total Revenue Vs Net Profit by Region, Total Units by Region, Total Orders by Region, and Delivered % by Region.
This view helps craft sellers and marketplace teams understand where sales and fulfillment are strongest. It can also highlight regions where delivery performance needs attention or where demand is strong enough to justify focused promotion.
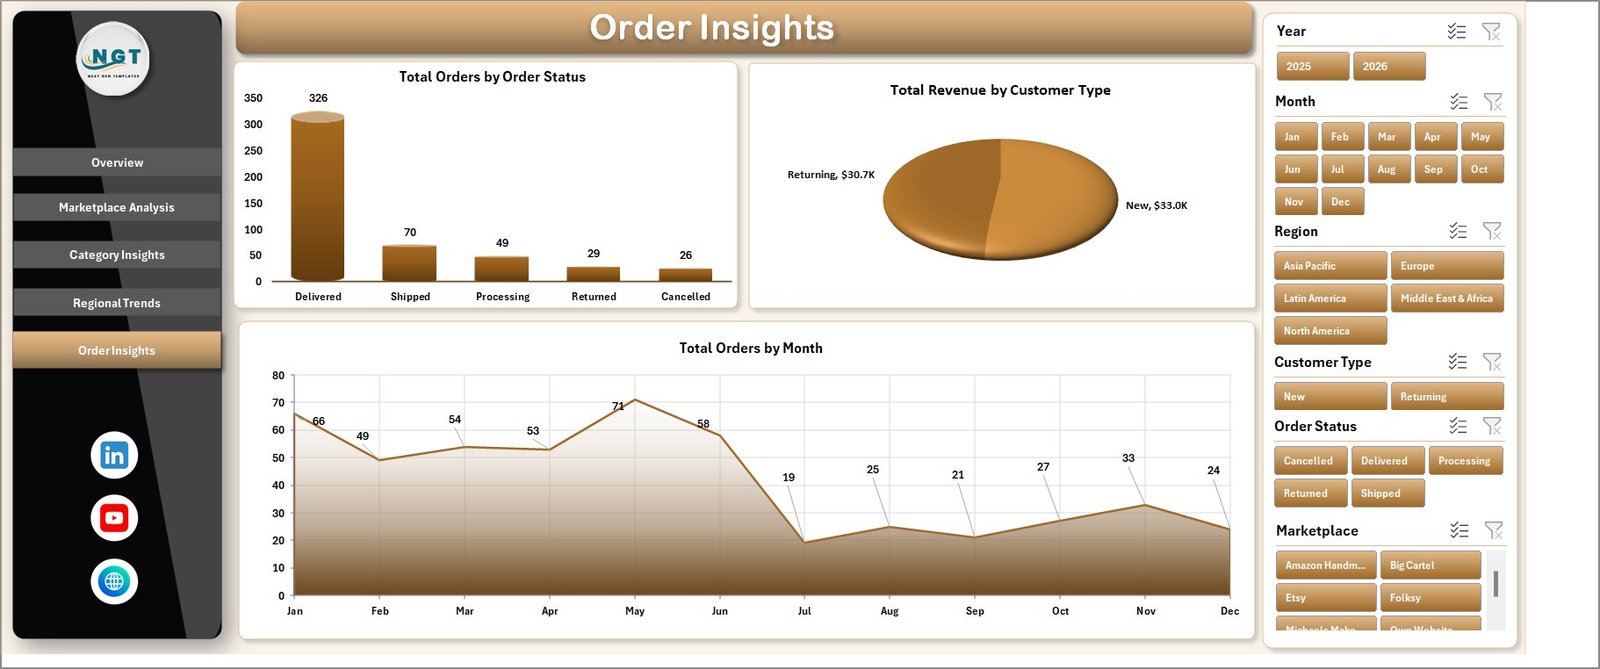
5. Order Insights
The Order Insights page focuses on order status, customer type, and monthly order volume. It includes Total Orders by Order Status, Total Revenue by Customer Type, and Total Orders by Month.
This page helps you understand whether order flow is healthy, whether customers are new or returning, and whether order volume is rising or falling over time. It is a practical view for monthly business review.
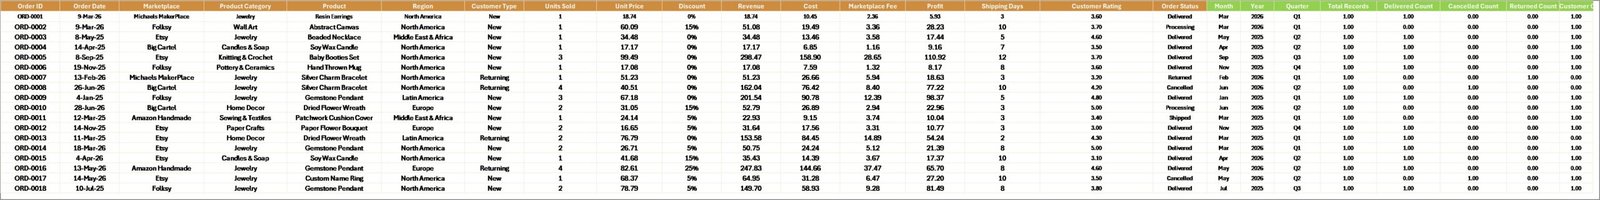
6. Data Sheet Tab
The Data Sheet is the input area. Add your own marketplace data in the same format, keeping the column headers and structure consistent. Once the data is updated, the dashboard can be refreshed through the Excel Ribbon.
7. Support Sheet
The Support Sheet contains pivot tables used to create the full dashboard dynamically. After changing data, go to the Data tab in the Excel Ribbon and click Refresh All. You can keep this sheet hidden once the dashboard is set up.
DIY Craft Marketplaces Dashboard in Excel vs. Google Sheets vs. Paid Ecommerce SaaS – Feature Comparison
| Feature | DIY Craft Marketplaces Dashboard in Excel | Google Sheets Alternative | Paid Ecommerce SaaS |
|---|---|---|---|
| Cost | $17.99 one-time | Low tool cost, but setup time needed | Monthly or annual subscription |
| Platform | Microsoft Excel | Browser-based spreadsheet | Vendor cloud platform |
| Setup time | Update data and refresh pivots | Requires manual dashboard building | Requires onboarding and configuration |
| Real-time team collaboration | Possible through OneDrive or SharePoint | Native collaboration | Usually included by plan |
| Mobile access | Excel mobile with some limits | Google Sheets mobile | Usually available |
| Customizable fields | Editable workbook | Editable but formulas can break | Limited by vendor settings |
| Share with link | Possible through Microsoft 365 sharing | Native link sharing | Usually available |
| Year-1 cost at 5 users | $17.99 plus existing Excel access | Low software cost plus build time | Often hundreds or thousands of dollars |
| Marketplace profitability | Pre-built visuals and slicers | Must be built manually | Depends on plan and integration |
Who Should Use This Template
This template is best for handmade product sellers, craft marketplace founders, small ecommerce brands, marketplace analysts, product category managers, and Excel users who want a ready reporting workbook for craft marketplace performance. It is also useful for consultants who prepare monthly reports for small sellers and need a repeatable Excel structure.
It is not meant to replace your accounting software, marketplace seller dashboard, shipping platform, or live API integration. If you need automatic real-time marketplace sync, this workbook should be used as a reporting layer after data export.
Real-World Use Cases
Maya, handmade jewelry seller: Maya updates the Data Sheet every month and uses Marketplace Analysis to decide whether Etsy, Amazon Handmade, or her own store deserves more listing effort.
Arjun, craft marketplace operator: Arjun reviews Regional Trends to compare orders and delivery percentages by region before planning seller campaigns.
Sophia, ecommerce consultant: Sophia uses Category Insights and Order Insights to prepare pricing, category, and fulfillment recommendations for small handmade businesses.
Advantages of DIY Craft Marketplaces Dashboard in Excel
- It gives sellers a clear structure for marketplace reporting without starting from a blank spreadsheet.
- It uses Excel features that many business users already know: tables, slicers, pivot tables, and charts.
- It separates source data, analysis pages, and support pivots so the workbook stays easier to maintain.
- It can be edited for custom marketplaces, product categories, regions, statuses, and customer types.
- It supports both high-level KPI review and detailed page-by-page performance analysis.
Opportunities for Improvement
The dashboard is intentionally designed as an Excel template, so users still need to export or prepare their own marketplace data. It does not include a live marketplace connector, automatic accounting reconciliation, or real-time inventory sync. For best results, keep the Data Sheet structure consistent and create a backup before changing pivot fields, source columns, or chart layouts.
Best Practices
- Refresh the dashboard after every data update using Data > Refresh All.
- Keep marketplace names consistent so slicers and charts group data correctly.
- Review profit margin together with revenue because high sales do not always mean high profit.
- Use category and regional pages together when planning product launches or shipping strategy.
- Keep the Support Sheet hidden during normal use, but do not delete it because it powers the dashboard.
- For Excel refresh and pivot table basics, review Microsoft’s guidance on refreshing PivotTable data.
Explore Relevant Templates
Explore the product page for DIY Craft Marketplaces Dashboard in Excel. You may also like Content Personalization Startups Dashboard in Excel, Print Shop Dashboard in Excel, and Excel Dashboard templates.
Frequently Asked Questions
What does this dashboard track?
It tracks revenue, net profit, units, orders, marketplaces, categories, regions, order status, customer type, ratings, delivered percentage, monthly trends, costs, and average order value.
Do I need macros to use it?
No. The workbook is designed around native Excel tables, pivot tables, slicers, and charts.
Can I use this for Etsy sales?
Yes. If your Etsy data is exported or prepared in the same structure as the Data Sheet, you can use it in the dashboard.
Can I add other marketplaces?
Yes. You can use any marketplace names in the Data Sheet as long as your data follows the workbook structure.
How do I refresh the charts?
Update the Data Sheet, then use Data > Refresh All in Excel. The Support Sheet pivots and dashboard charts refresh together.
Can I customize the dashboard?
Yes. You can edit charts, colors, fields, slicers, and sheet names. Keep a backup before changing pivot source fields.
About the Author
Built by PK – Microsoft Certified Professional with 15+ years of Excel, Google Sheets, and Power BI experience. Founder of NextGenTemplates, reaching 300K+ subscribers across YouTube channels. Every template is hand-built and tested before release.
Conclusion
The DIY Craft Marketplaces Dashboard in Excel gives handmade sellers and marketplace teams a practical way to track revenue, profit, units, orders, categories, regions, delivery, customer type, and ratings without building a dashboard from scratch. Update the Data Sheet, refresh the workbook, and use the analysis pages to make better marketplace, product, and fulfillment decisions.
For more tutorials, visit PK: An Excel Expert on YouTube.