Document Management Dashboard in Power BI is built for admin teams, IT operations, compliance coordinators, records managers, and department leaders who need a clean way to monitor document volume, pending documents, file size, storage cost, processing hours, approval rate, access levels, storage locations, downloads, and compliance. A document register with 1,000+ files can become difficult to review when data is scattered across folders, exports, drives, and manual status trackers. This Power BI dashboard turns those records into 5 analysis pages with KPI cards, slicers, charts, and page-level reporting.
For Microsoft guidance on the platform, see the official Microsoft Power BI documentation.
Key Features of Document Management Dashboard in Power BI
- 5 dedicated report pages covering Overview, Department Analysis, Document Types, Storage & Format, and Compliance & Status.
- 5 high-level KPI cards for Total Storage Cost, Pending Documents, Total File Size, Avg Processing Hours, and Total Documents.
- Interactive slicers to filter the dashboard quickly and review selected departments, document types, statuses, or access levels.
- Approval tracking through overall approval rate and approved vs. pending document views by department.
- Storage cost analysis by department and storage location to help identify where document storage is growing.
- Processing-time visibility by department and document type for workflow improvement.
- Compliance monitoring by document type, access level, and month for governance review.
- Editable PBIX file that can be opened in Power BI Desktop, customized, and published if your organization uses Power BI Service.
Dashboard Pages Explanation
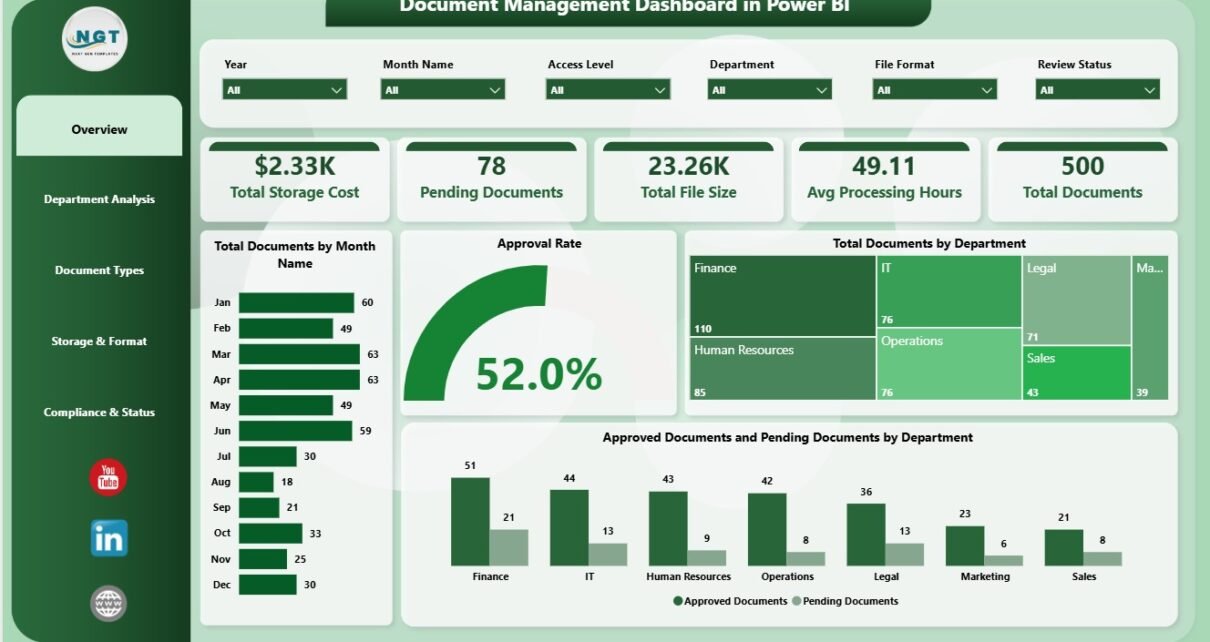
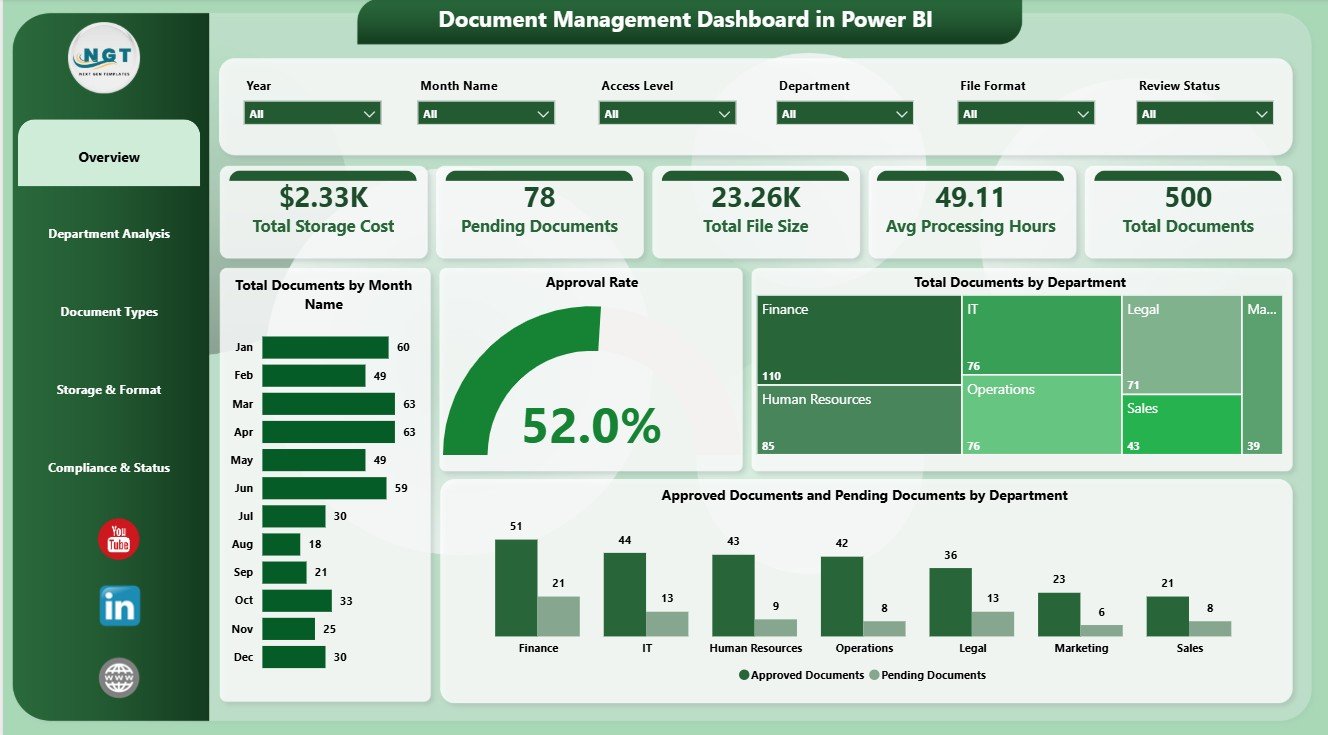
1. Overview Page
The Overview Page gives an executive summary of the full document register. At the top, the dashboard displays cards for Total Storage Cost, Pending Documents, Total File Size, Avg Processing Hours, and Total Documents. These cards help managers understand document scale, cost, backlog, and handling speed before moving into deeper analysis.
Total Documents by Month Name: This chart shows how document volume changes month by month. It helps identify upload spikes, seasonal review periods, cleanup cycles, or months where records increased sharply.
Approval Rate by Overall Documents: This visual summarizes approved records against the full document base. It gives managers a quick health check of the approval process before they drill down by department or document type.
Total Documents by Department: This chart compares document ownership across departments. It helps leaders understand which teams create, manage, or retain the largest number of files.
Approved Documents and Pending Documents by Department: This chart compares review progress across teams. It makes bottlenecks visible when one department has a higher pending-document load than others.
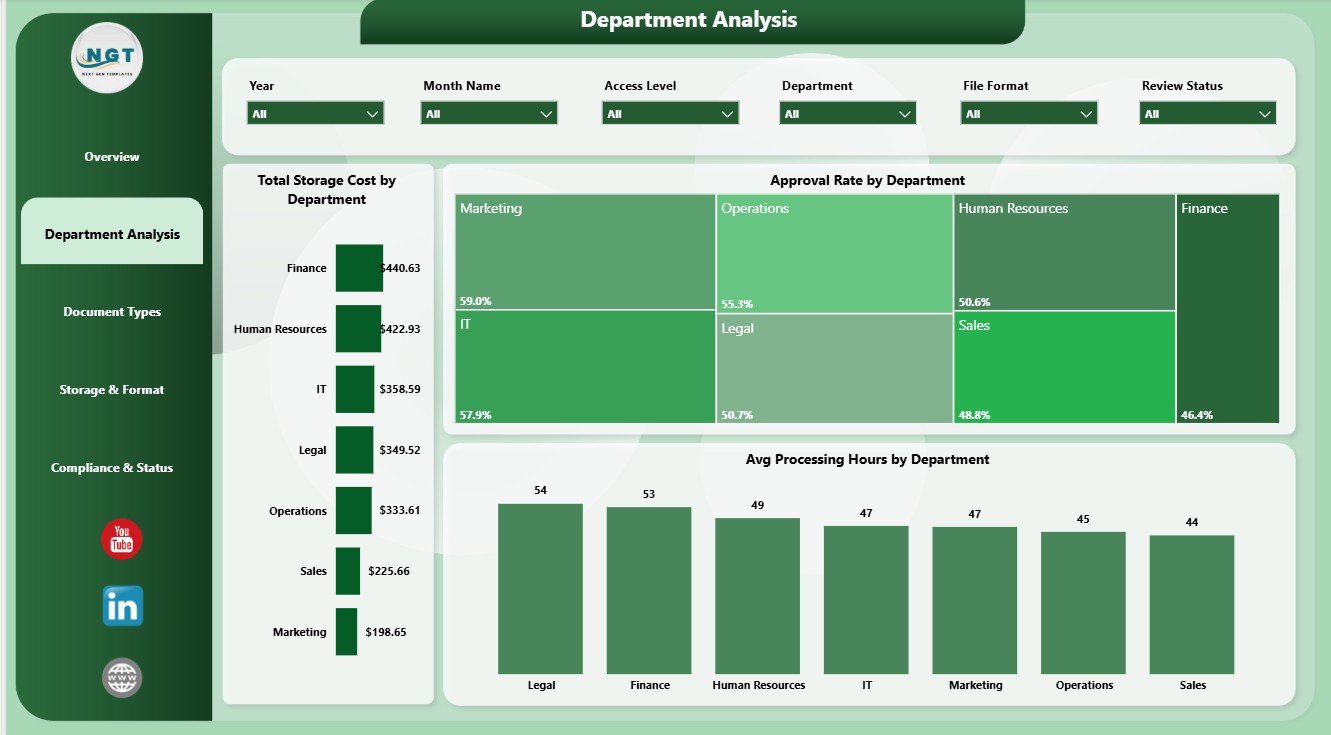
2. Department Analysis
The Department Analysis page helps teams compare document cost, approval quality, and processing time across business areas. It includes Total Storage Cost by Department, Approval Rate by Department, and Avg Processing Hours by Department.
Total Storage Cost by Department shows where storage spend is concentrated. Approval Rate by Department highlights which teams are keeping document reviews current, while Avg Processing Hours by Department points to departments where handling time may need attention.
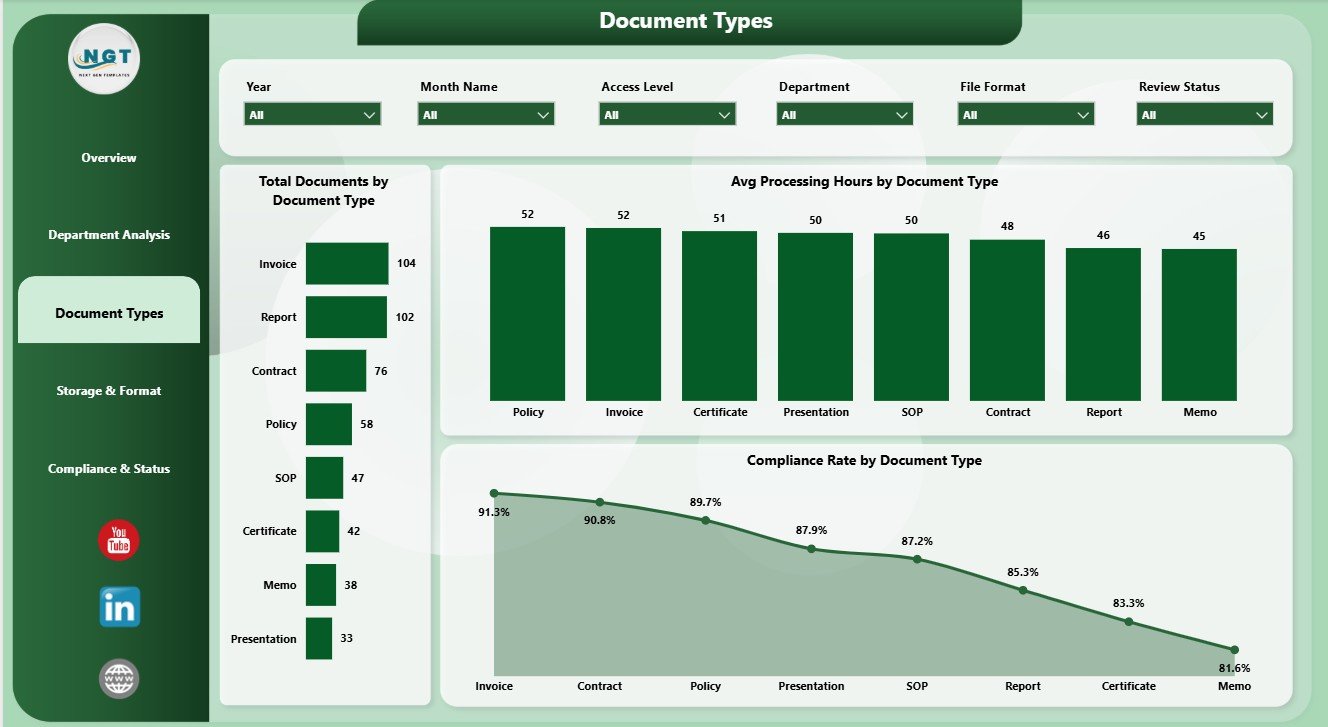
3. Document Types
The Document Types page focuses on how different document categories behave. It includes Total Documents by Document Type, Avg Processing Hours by Document Type, and Compliance Rate by Document Type. This helps records teams identify categories that dominate the register, process slowly, or need stronger governance.
Total Documents by Document Type shows the category mix. Avg Processing Hours by Document Type helps find categories that slow down workflows, while Compliance Rate by Document Type helps prioritize document groups that need review.
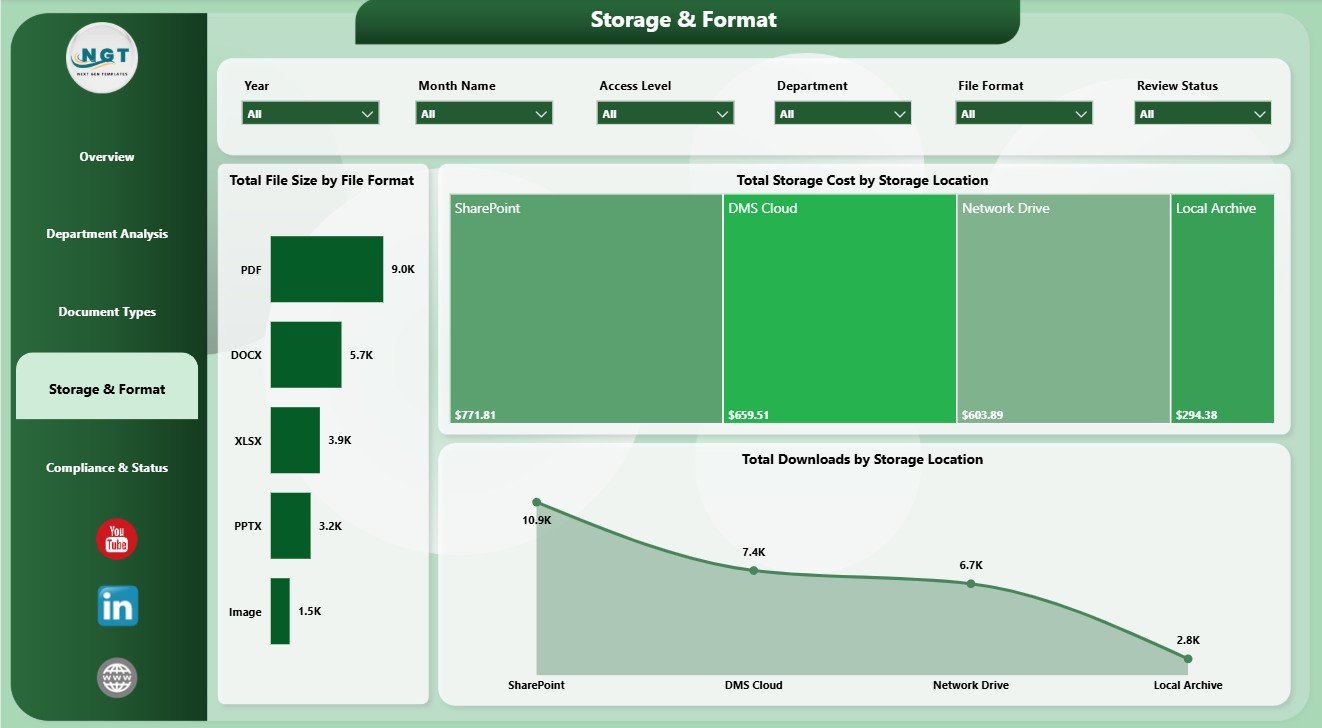
4. Storage & Format
The Storage & Format page supports storage planning and usage review. It includes Total File Size by File Format, Total Storage Cost by Storage Location, and Total Downloads by Storage Location. IT teams can use this page to understand which formats and locations are driving storage pressure.
Total File Size by File Format identifies heavy file formats. Total Storage Cost by Storage Location compares cost across repositories, while Total Downloads by Storage Location shows where users access documents most often.
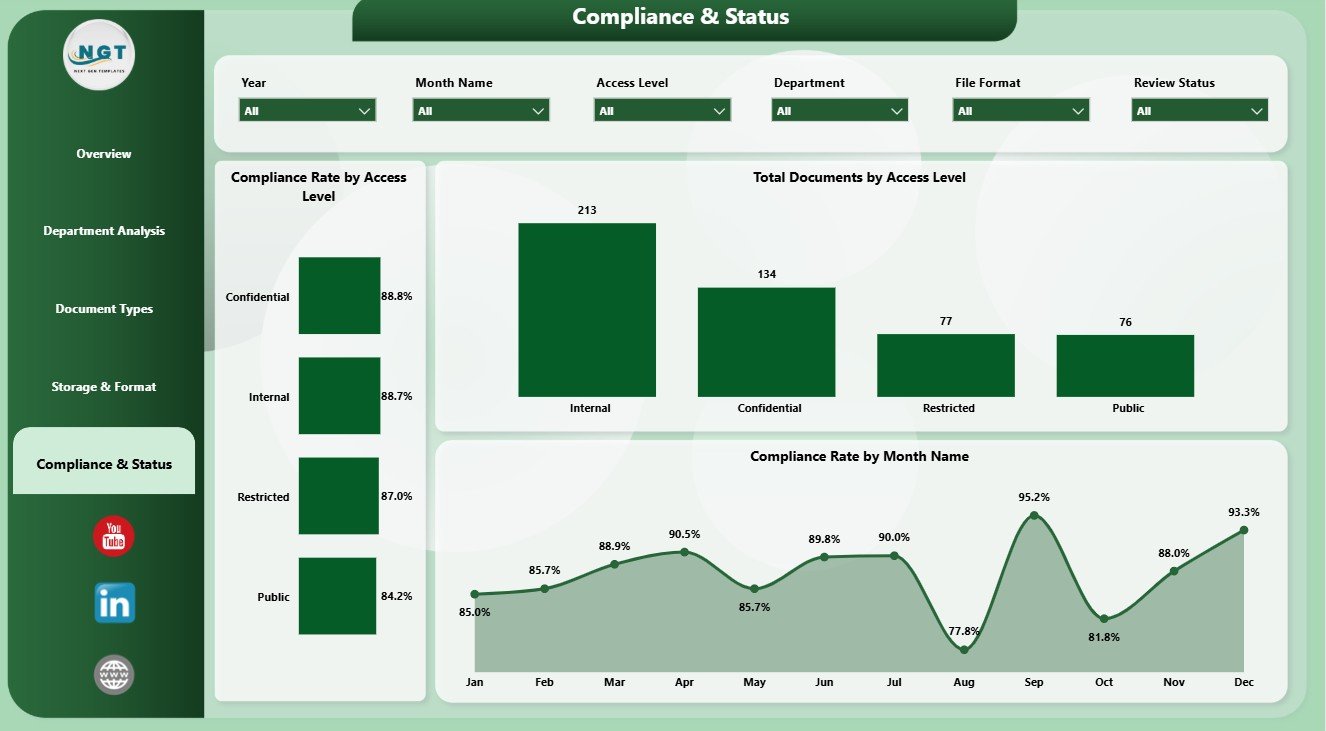
5. Compliance & Status
The Compliance & Status page is the governance view. It includes Compliance Rate by Access Level, Total Documents by Access Level, and Compliance Rate by Month Name. This page helps managers understand whether restricted, internal, public, or other access groups are being managed correctly.
Compliance Rate by Access Level shows which access groups meet governance expectations. Total Documents by Access Level explains exposure, while Compliance Rate by Month Name shows whether performance is improving or slipping over time.
Document Management Dashboard in Power BI vs. Tableau vs. Paid Document Management SaaS – Feature Comparison
| Feature | Document Management Dashboard in Power BI | Tableau alternative | Paid document management SaaS |
|---|---|---|---|
| Cost | $17.99 one-time | Requires Tableau licensing | Recurring subscription |
| Platform | Power BI Desktop and Power BI Service | Tableau Desktop or Cloud | Vendor cloud platform |
| Setup time | Open PBIX, connect data, refresh | Dashboard must be rebuilt | Requires onboarding and configuration |
| Real-time team collaboration | Possible through Power BI Service | Possible through Tableau Cloud | Usually built in |
| Mobile access | Possible through Power BI mobile and web | Possible through Tableau mobile and web | Usually built in |
| Customizable fields | Editable model, measures, and visuals | Editable if rebuilt | Limited by vendor settings |
| Share with link | Possible through Power BI Service | Possible through Tableau Cloud | Usually built in |
| Document analytics | Built in across 5 report pages | Manual dashboard build required | Usually available on higher plans |
| Year-1 cost at 5 users | $17.99 plus Microsoft licensing | Often much higher licensing cost | Often hundreds or thousands |
Who Should Use This Template
This template is useful for document controllers, admin teams, IT teams, compliance coordinators, operations managers, quality teams, file storage reviewers, and Power BI users who already maintain a structured document register. It is also useful for consultants who need to present document volume, approval backlog, storage cost, processing time, or compliance summaries to clients.
It is not meant to replace a full document management system. If you need file version control, check-in/check-out, electronic signatures, legal hold, retention automation, live SharePoint API sync, or certified records management workflows, you will need a dedicated DMS or custom system. This dashboard is best used as an analytics layer for document data.
Real-World Use Cases
Priya, compliance coordinator: Priya uses the Overview and Compliance pages before her weekly governance meeting. She checks pending documents by department and uses monthly compliance rate to explain whether governance is improving.
Daniel, IT operations manager: Daniel reviews total file size by format and storage cost by location. This helps him identify areas that need cleanup, compression, retention review, or storage-policy updates.
Meera, admin lead: Meera compares average processing hours by department and document type. She can quickly see where document handling is taking longer than expected.
Advantages of Document Management Dashboard in Power BI
The main advantage is visibility. Instead of building Power BI pages, measures, charts, slicers, and KPI cards from scratch, users get a ready PBIX dashboard where the analysis pages are already structured. The report also works in the Microsoft Power BI environment, making it suitable for teams that want to connect data, refresh dashboards, and publish reports.
The second advantage is cost control. A one-time Power BI template is not the same as enterprise document management software, but it can be the right reporting layer when teams only need visibility into document volume, pending documents, storage cost, file size, approval rate, processing hours, access level, and compliance.
Opportunities for Improvement
Users should keep the source data clean for best results. Standard document IDs, consistent department names, clean document type values, accurate access levels, reliable storage location values, and updated approval statuses will make the dashboard more useful. Teams can also customize the PBIX file by adding fields for owner, expiry date, document risk level, vendor, business process, retention category, or audit status.
Best Practices
- Keep one row per document so charts and measures summarize records correctly.
- Use consistent naming for departments, document types, access levels, file formats, and storage locations.
- Refresh after every data update so the cards, charts, and slicers show current values.
- Review pending documents weekly to catch approval bottlenecks early.
- Monitor compliance monthly by access level and document type.
- Archive or compress large files after reviewing storage cost and file size patterns.
Explore Relevant Templates
- Document Management Dashboard in Power BI – the product page for this downloadable template.
- Document Management Dashboard in Excel – related Excel version for teams that prefer workbook-based reporting.
- Office Document Management Dashboard in Power BI – related office document tracking dashboard.
- Document Management KPI Dashboard in Power BI – KPI-focused document performance dashboard.
- Browse more Power BI Dashboard Templates.
Frequently Asked Questions
What is included in the Document Management Dashboard in Power BI?
The PBIX file includes Overview, Department Analysis, Document Types, Storage & Format, and Compliance & Status report pages.
What KPI cards are available on the Overview page?
The Overview page includes Total Storage Cost, Pending Documents, Total File Size, Avg Processing Hours, and Total Documents.
Can I add my own document data?
Yes. Replace or connect the sample data with your own structured document register, then refresh the Power BI report.
Does this dashboard manage actual document files?
No. It analyzes structured document data. It does not store files, manage file permissions, or replace SharePoint, OneDrive, Google Drive, or a full document management system.
Can I customize the charts and measures?
Yes. Because it is a PBIX file, you can edit visuals, measures, fields, filters, colors, and report pages in Power BI Desktop.
Do I need a paid Power BI license?
You can open and edit the file in Power BI Desktop. A paid Power BI license may be required if you publish and share through Power BI Service.
About the Author
Built by PK – Microsoft Certified Professional with 15+ years of Excel, Google Sheets, and Power BI experience. Founder of NextGenTemplates, reaching 300K+ subscribers across YouTube channels. Every template is hand-built and tested before release.
Conclusion
The Document Management Dashboard in Power BI gives teams a practical way to review document volume, storage cost, pending work, processing hours, approval rate, file formats, access levels, storage locations, downloads, and compliance without building the dashboard from scratch. It is especially useful when you already have a document register and need a clean Power BI reporting layer for management review.
Click here to purchase the Document Management Dashboard in Power BI.
Instant download. One-time payment. Editable Power BI dashboard. No subscription.
For step-by-step Excel and Power BI tutorials, visit YouTube.com/@PK-AnExcelExpert.
Last updated: June 2026