Environmental Law Firms Dashboard in Excel is built for environmental law firms, compliance attorneys, legal operations teams, and practice managers that need a clear way to analyze matter value, legal fees, penalties avoided, regulators, status, risk, clients, and attorney workload. Environmental law matters often combine legal, regulatory, financial, and risk data, so a normal flat spreadsheet can become difficult to read quickly. This Excel dashboard turns that data into KPI cards, slicers, and focused charts for faster review.
The template is especially useful when your firm already maintains matter records in Excel or exports them from another system. Instead of building charts from scratch, you can update the Data sheet, refresh the workbook, and review the dashboard pages. For Excel refresh guidance, Microsoft explains how workbook data refresh works in its official Excel help and learning center.
Click to Purchase Environmental Law Firms Dashboard in Excel
Key Features of Environmental Law Firms Dashboard in Excel
- 5 analysis pages covering Overview, Case Trends, Client Analysis, Practice Mix, and Risk Review.
- Executive KPI cards for Total Matter Value, Total Legal Fees, Total Penalty Avoided, Total Records, and Avg. Risk Score.
- Interactive slicers to filter the dashboard quickly without rebuilding formulas or charts.
- Pivot-driven charts for matter value, closure rate, priority, status, region, industry, practice area, regulator, firm, and attorney analysis.
- Data sheet included so users can add records in the same structure as the sample file.
- Support sheet with pivot tables that powers the dashboard and can be hidden after setup.
- One-time Excel download with no recurring dashboard subscription fee.
Dashboard Pages Explanation
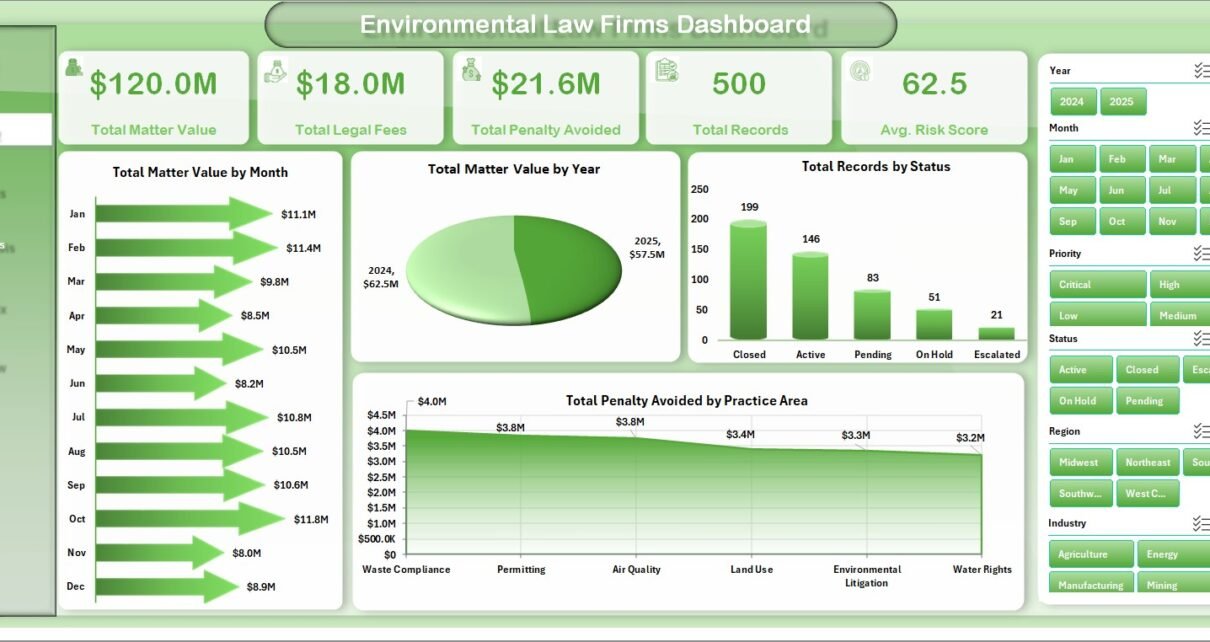
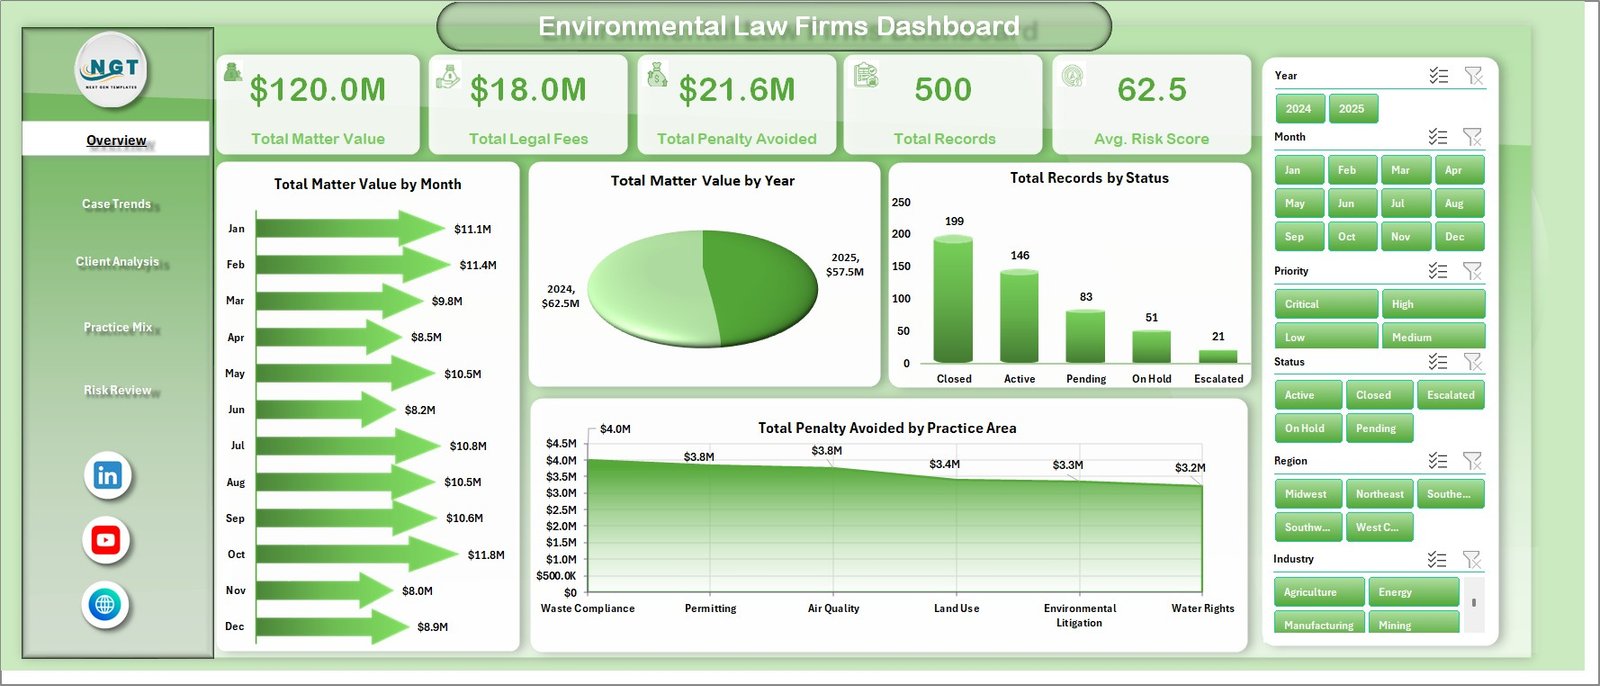
1. Overview Page
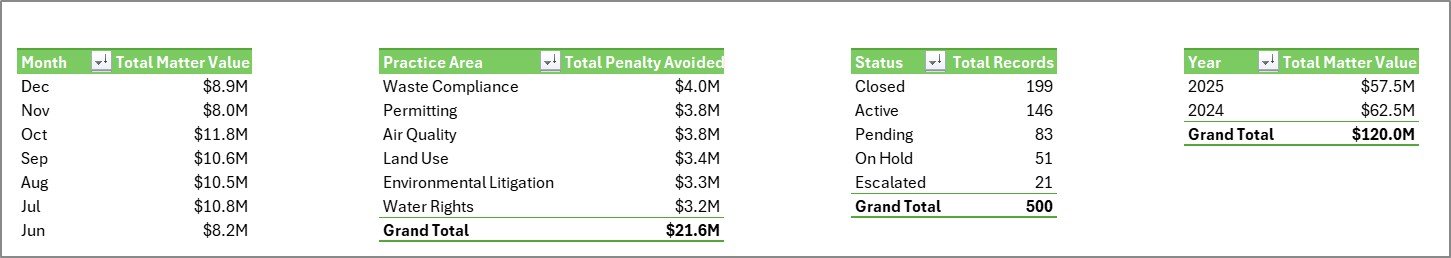
The Overview Page provides a top-level view of environmental legal matter performance. The KPI cards summarize Total Matter Value, Total Legal Fees, Total Penalty Avoided, Total Records, and Avg. Risk Score, making it easier to review portfolio value, billing impact, compliance benefit, and risk level in one place.
Total Matter Value by Month: This chart shows how matter value changes across the months. It helps partners spot high-value periods, intake spikes, and seasonal movement in environmental law work.
Total Matter Value by Year: This chart compares value by year so the firm can review long-term practice growth. It is useful for annual reviews, budgeting, and strategic planning.
Total Records by Status: This chart shows how many records sit in each matter status. It helps identify open work, closed matters, pending items, and possible backlog pressure.
Total Penalty Avoided by Practice Area: This chart shows which environmental practice areas contribute the highest avoided penalty value. It helps communicate client impact beyond legal fees alone.
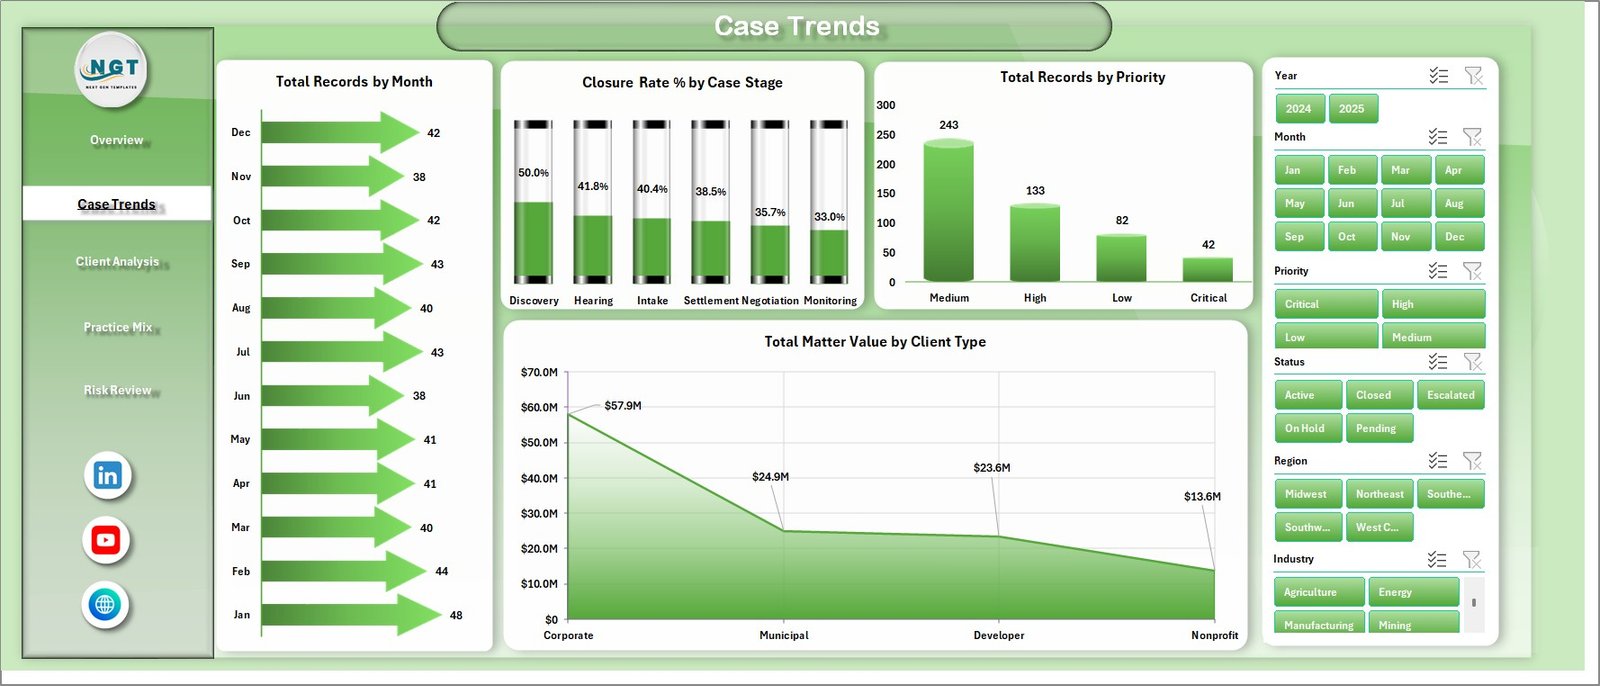
2. Case Trends
The Case Trends page is designed to show how matters move over time and through the legal process. Total Records by Month tracks the monthly flow of matters, while Closure Rate % by Case Stage shows which stages are closing efficiently and which stages may need review.
Total Records by Priority gives a quick read on urgent, high-priority, and routine matters. Total Matter Value by Client Type helps partners understand whether corporate, municipal, nonprofit, or other client types are driving value.
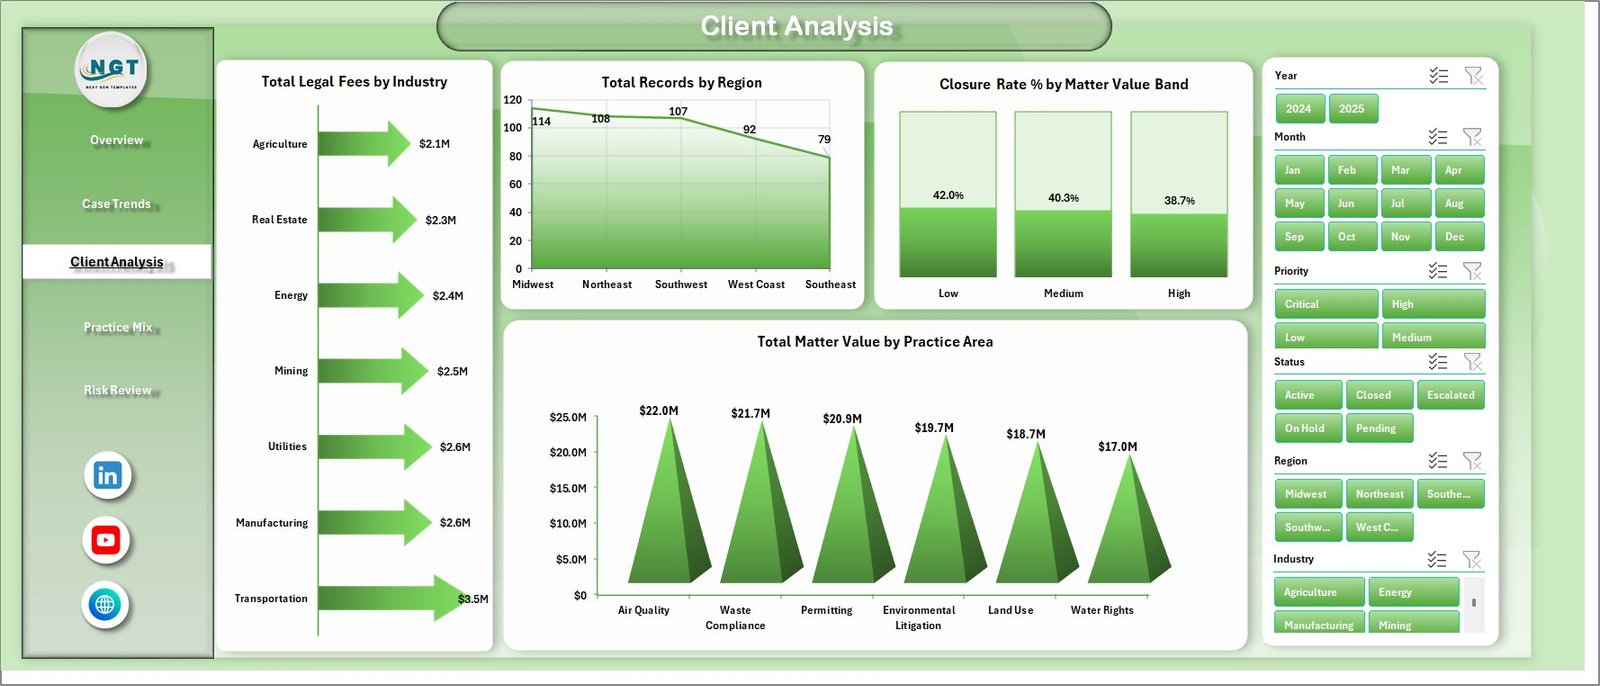
3. Client Analysis
The Client Analysis page focuses on client-side reporting. Total Legal Fees by Industry identifies the industries that generate the highest fees, and Total Records by Region shows where legal matter activity is concentrated.
Closure Rate % by Matter Value Band helps compare resolution performance across different value ranges. Total Matter Value by Practice Area shows which environmental legal services carry the most matter value.
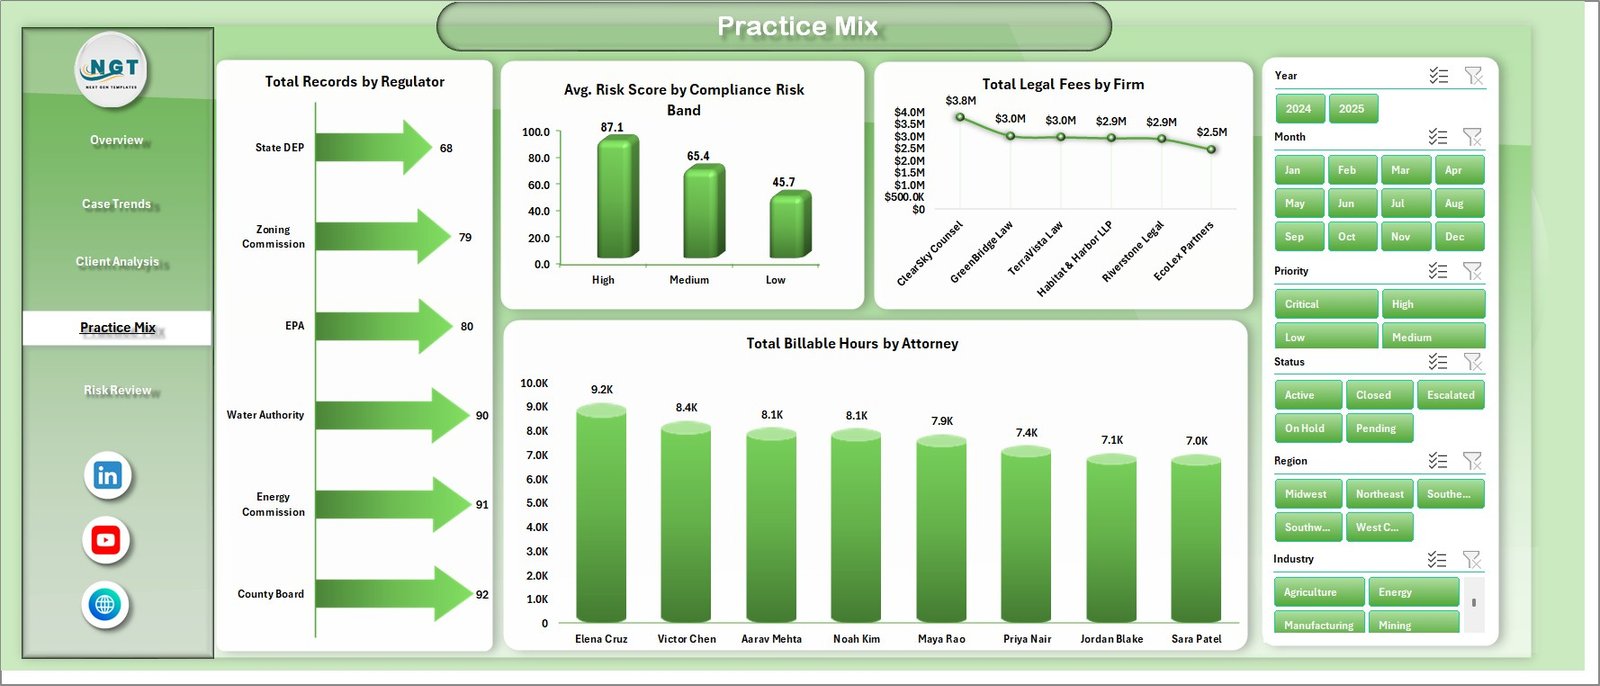
4. Practice Mix
The Practice Mix page gives a deeper view of regulator exposure, risk mix, firm contribution, and attorney workload. Total Records by Regulator shows which agencies appear most often in the data, helping attorneys prepare for regulator-specific reviews.
Avg. Risk Score by Compliance Risk Band summarizes the overall risk profile. Total Legal Fees by Firm compares fee contribution across firms or offices, and Total Billable Hours by Attorney helps review workload distribution.
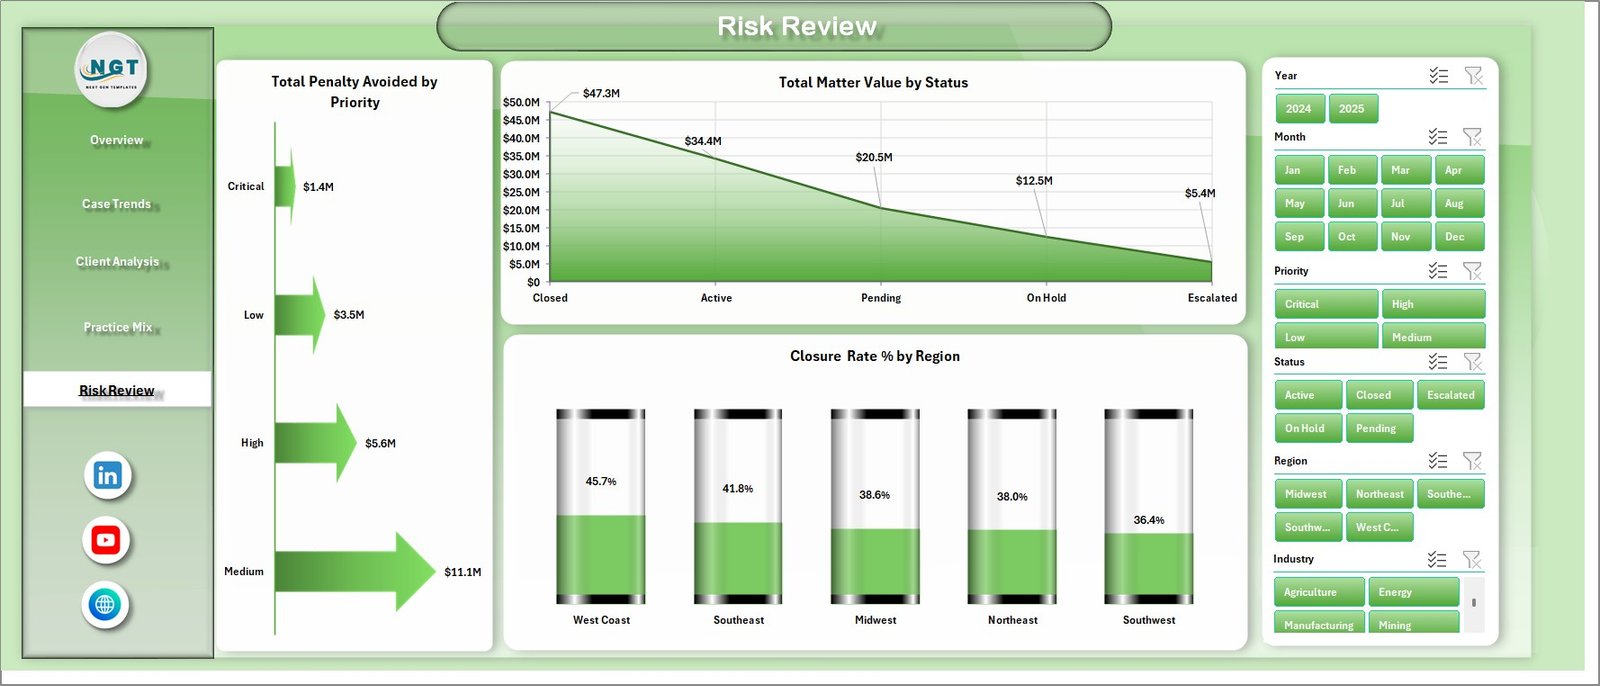
5. Risk Review
The Risk Review page is useful for legal and compliance conversations. Total Penalty Avoided by Priority helps show whether high-priority matters are generating a meaningful compliance benefit.
Total Matter Value by Status connects value with workflow status, while Closure Rate % by Region shows how resolution performance varies geographically.
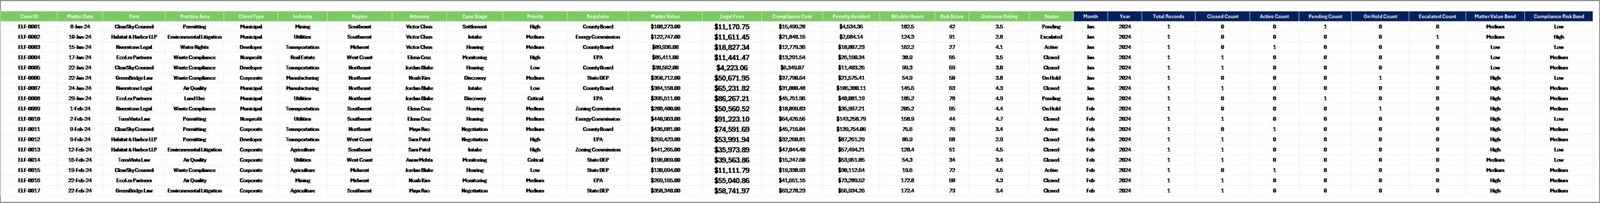
6. Data Sheet Tab
The Data sheet is where you add the matter records in the same format as the template. After updating the records, refresh the workbook so the pivot tables and dashboard charts reflect the latest information.
7. Support Sheet
The Support sheet contains the pivot tables used to create the dashboard. After you update the Data sheet, go to the Data tab in the Excel Ribbon and click Refresh All. The pivots and connected charts will refresh, and you can keep this sheet hidden during regular use.
Environmental Law Firms Dashboard in Excel vs. Google Sheets vs. Paid Legal CRM/SaaS – Feature Comparison
| Feature | This Excel Template | Google Sheets Alternative | Paid Legal CRM/SaaS |
|---|---|---|---|
| Cost | $17.99 one-time | Manual dashboard build | Monthly or annual subscription |
| Platform | Microsoft Excel | Google Sheets | Vendor cloud platform |
| Setup time | Replace data and refresh | Build formulas, pivots, and charts | Onboarding and configuration required |
| Collaboration | Share workbook through your normal file process | Good real-time collaboration | Depends on plan and user roles |
| Customization | Editable sheets, pivots, and charts | Editable, but setup needed | Limited by vendor settings |
| Environmental legal reporting | Built for matter value, fees, penalties, risk, regulators, regions, attorneys | Requires custom build | May require reporting add-ons |
| Year-1 cost at 5 users | $17.99 plus existing Excel access | Internal build time | Often hundreds or thousands |
Who Should Use This Template
This dashboard is best for environmental law firms, compliance attorneys, legal consultants, practice administrators, and legal operations teams that already collect structured matter data. It is also useful for boutique firms that want a simple reporting layer without buying a full analytics system.
It is not meant to replace secure case management software, billing systems, document repositories, e-discovery tools, court filing tools, or client portals. Use it as an Excel reporting dashboard for structured data.
Real-World Use Cases
Environmental law partner: Reviews matter value, penalty avoided, and legal fees before monthly practice meetings.
Legal operations manager: Checks status, stage, attorney hours, and regional closure rate to find bottlenecks.
Compliance counsel: Reviews regulator mix, risk bands, and priority analysis before preparing client updates.
Advantages of Environmental Law Firms Dashboard in Excel
- It gives legal teams a clear view of matter value and risk in one workbook.
- It uses familiar Excel features, making adoption easier for teams already using spreadsheets.
- It includes slicers and pivot-driven charts for fast filtering and review.
- It supports practice planning by comparing matter value, fees, industries, attorneys, regions, and regulators.
- It is a one-time download, so teams avoid a recurring template subscription.
Opportunities for Improvement
- Add data validation rules to standardize regulator, region, practice area, and attorney names.
- Connect the Data sheet to an exported matter management report for a faster refresh process.
- Add firm-specific risk scoring definitions so the Avg. Risk Score matches internal methodology.
- Protect formula and support areas before sharing the workbook with wider teams.
- Create a monthly archive copy before major data changes.
Best Practices
- Keep the Data sheet column structure consistent when adding new records.
- Refresh all pivot tables after every major data update.
- Review slicer selections before presenting dashboard screenshots.
- Use consistent matter status, priority, regulator, and region naming.
- Keep the Support sheet hidden for regular users but accessible to workbook owners.
- Back up the workbook before changing pivots, formulas, or chart layouts.
Explore Relevant Templates
- Environmental Law Firms Dashboard in Excel
- Employment Law Services Dashboard in Excel
- Employment Law Services Dashboard in Power BI
- Cyber Law Advisory Dashboard in Excel
Frequently Asked Questions
What does the Environmental Law Firms Dashboard in Excel track?
It tracks matter value, legal fees, penalties avoided, records, risk score, status, practice area, regulator, industry, region, firm, attorney, priority, and closure performance.
Can I replace the sample data?
Yes. Add your records to the Data sheet in the same structure, then refresh all pivot tables and charts.
Do I need advanced Excel skills?
Basic Excel knowledge is enough for updating data and refreshing the workbook. More advanced skills help if you want to modify pivots, formulas, or chart layouts.
Does this replace legal practice management software?
No. It is a dashboard template for analysis, not a secure legal case management, billing, document, or client portal system.
Can I hide the Support sheet?
Yes. The Support sheet contains pivot tables and can be hidden after setup, while still supporting the dashboard pages.
Is this a subscription?
No. It is a one-time Excel dashboard template download from NextGenTemplates.
About the Author
Built by PK – Microsoft Certified Professional with 15+ years of Excel, Google Sheets, and Power BI experience. Founder of NextGenTemplates, reaching 300K+ subscribers across YouTube channels. Every template is hand-built and tested before release.
Conclusion
The Environmental Law Firms Dashboard in Excel gives legal teams a practical way to turn environmental matter records into visual analysis. With pages for overview reporting, case trends, client analysis, practice mix, and risk review, the workbook helps firms review value, fees, penalties avoided, regulators, risk, regions, and attorney workload in a more structured way.
Visit our YouTube channel to learn step-by-step Excel, dashboard, and template tutorials.