The Knowledge Transfer Partnerships Dashboard in Excel gives universities, innovation teams, grant administrators, and partnership managers one workbook for tracking funding, actual spend, milestones, innovation outputs, jobs created, satisfaction, partners, regions, sectors, and project status. A typical knowledge transfer partnership involves several moving parts: academic partners, business partners, grant funding, delivery milestones, outputs, jobs, and stakeholder satisfaction. When those numbers live in different sheets or exports, even a simple quarterly review can take hours.
This dashboard turns that reporting work into a repeatable Excel process. Update the Data Sheet, click Refresh All from the Excel Data tab, and use the dashboard pages to review the latest performance. The workbook includes seven tabs: Overview, Funding, Project Flow, Innovation, Partners, Data Sheet, and Support Sheet. It is built for structured reporting, not for live project task management, so it fits teams that want a clean analysis file for management reviews.
Key Features of Knowledge Transfer Partnerships Dashboard in Excel
- Seven worksheet tabs covering Overview, Funding, Project Flow, Innovation, Partners, Data Sheet, and Support Sheet.
- Five high-level KPI cards for Total Budget, Total Grant Funding, Total Innovation Outputs, Total Jobs Created, and Avg. Satisfaction Score.
- Interactive slicers to filter the dashboard quickly by dimensions such as year, region, sector, project stage, status, partner, organization, priority, or manager.
- Funding analysis for budget vs actual spend, funding leverage ratio, grant funding by year, and planned milestones by stage.
- Project flow analysis for priority mix, knowledge areas, completed milestones, status, and month-wise milestone completion percentage.
- Innovation and partner analysis for outputs, satisfaction, jobs created, project manager budgets, university partners, regions, and organizations.
- Editable source data so your team can replace the sample records with your own knowledge transfer partnership data.
- Pivot-based support sheet that powers the charts and can stay hidden after setup.
Dashboard Pages Explanation
Overview Page
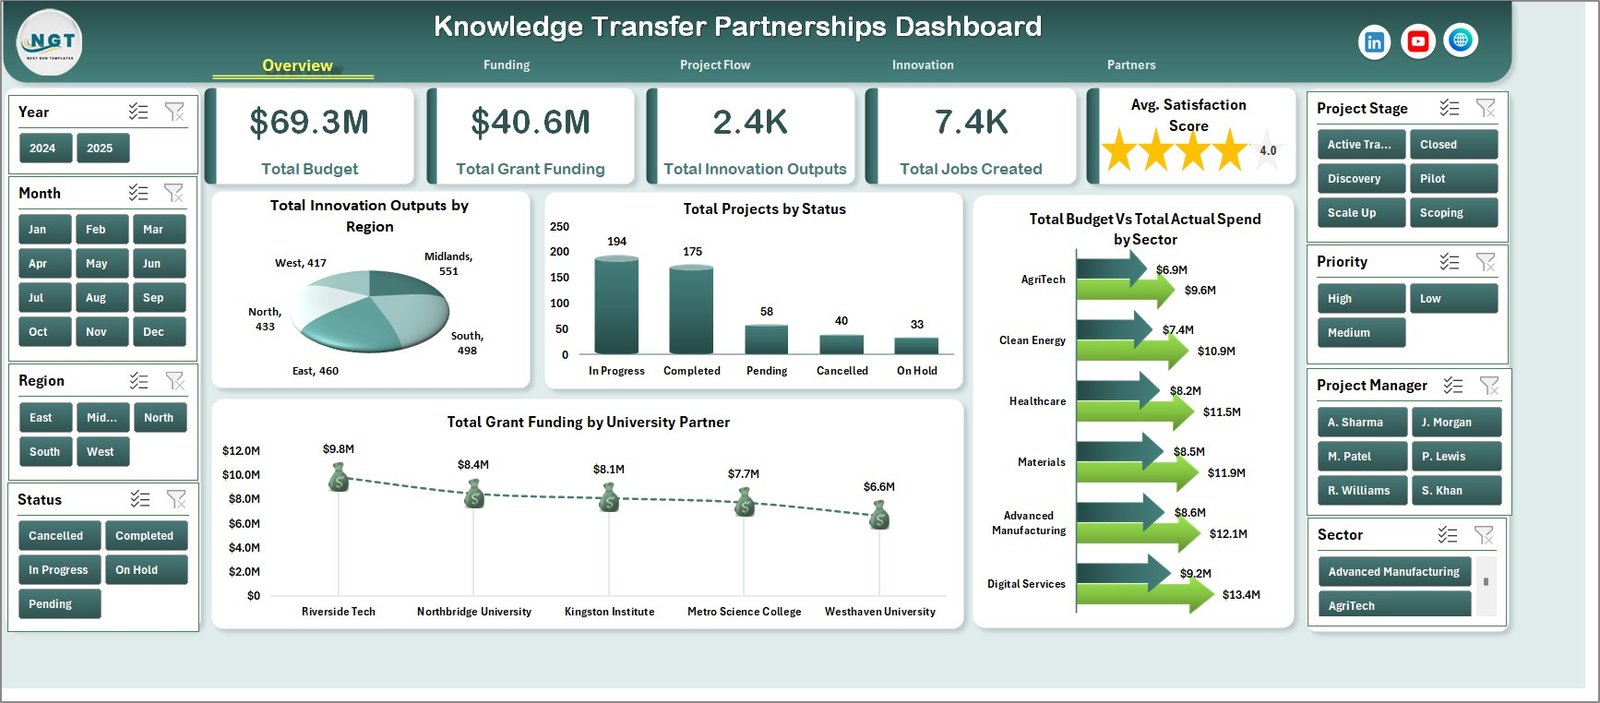
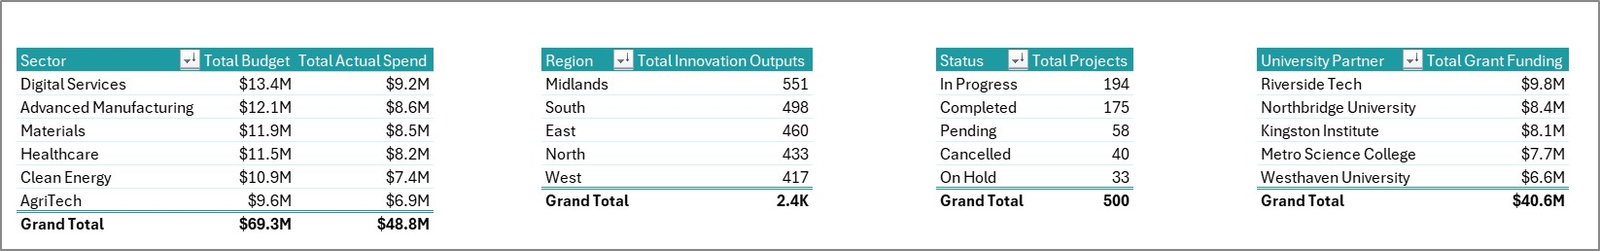
The Overview page is the executive view of the workbook. At the top, it shows Total Budget, Total Grant Funding, Total Innovation Outputs, Total Jobs Created, and Avg. Satisfaction Score. These cards help the user understand the overall scale and health of the partnership portfolio before looking at details.
The chart Total Innovation Outputs by Region shows which regions are creating the most measurable innovation activity. It helps partnership managers compare regional contribution and identify where additional support or knowledge exchange may be required.
The chart Total Projects by Status summarizes the project pipeline by current status. It is useful for spotting delivery pressure, delayed projects, or completed work before a steering committee meeting.
The chart Total Grant Funding by University Partner compares funding values across academic partners. It helps grant teams understand partner concentration and review whether funding is balanced across the university network.
The chart Total Budget Vs Total Actual Spend by Sector compares planned budget with actual spending by sector. It helps users see which sectors are over budget, under budget, or tracking close to plan.
Knowledge Transfer Partnerships Dashboard in Excel
Funding
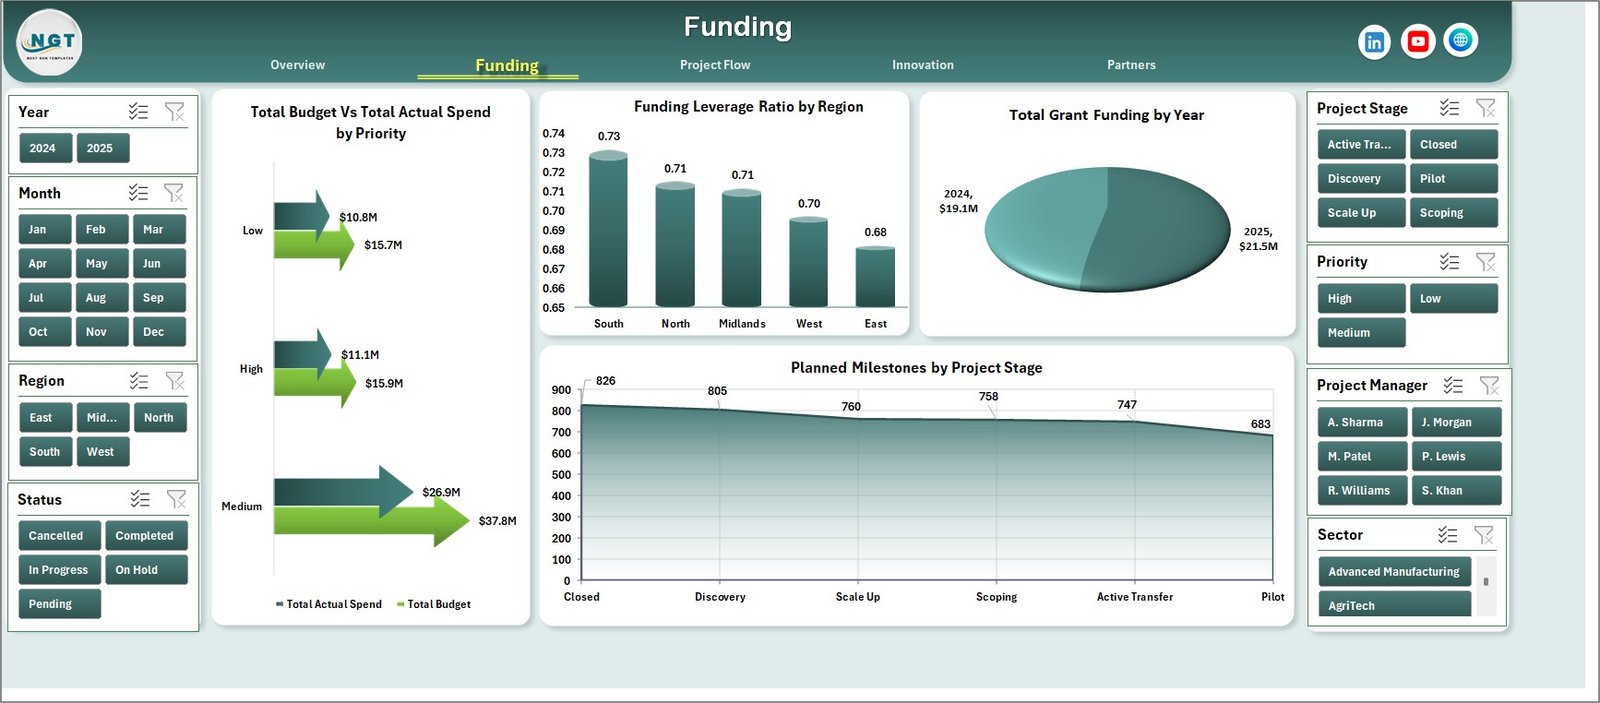
The Funding sheet focuses on how money is planned, spent, leveraged, and staged. It includes Total Budget Vs Total Actual Spend by Priority, Funding Leverage Ratio by Region, Total Grant Funding by Year, and Planned Milestones by Project Stage.
Total Budget Vs Total Actual Spend by Priority shows whether high, medium, or low priority projects are spending according to plan. This gives finance teams a quick way to review budget pressure by strategic priority.
Funding Leverage Ratio by Region helps compare how effectively grant or partner funding is being leveraged across regions. It can highlight regions where external or matched funding is performing strongly.
Total Grant Funding by Year shows funding movement over time. This is helpful for annual reviews, funding cycles, and understanding whether the partnership portfolio is growing or flattening.
Planned Milestones by Project Stage connects funding oversight with delivery planning. It helps managers see where expected work is concentrated across the partnership lifecycle.
Funding
Project Flow
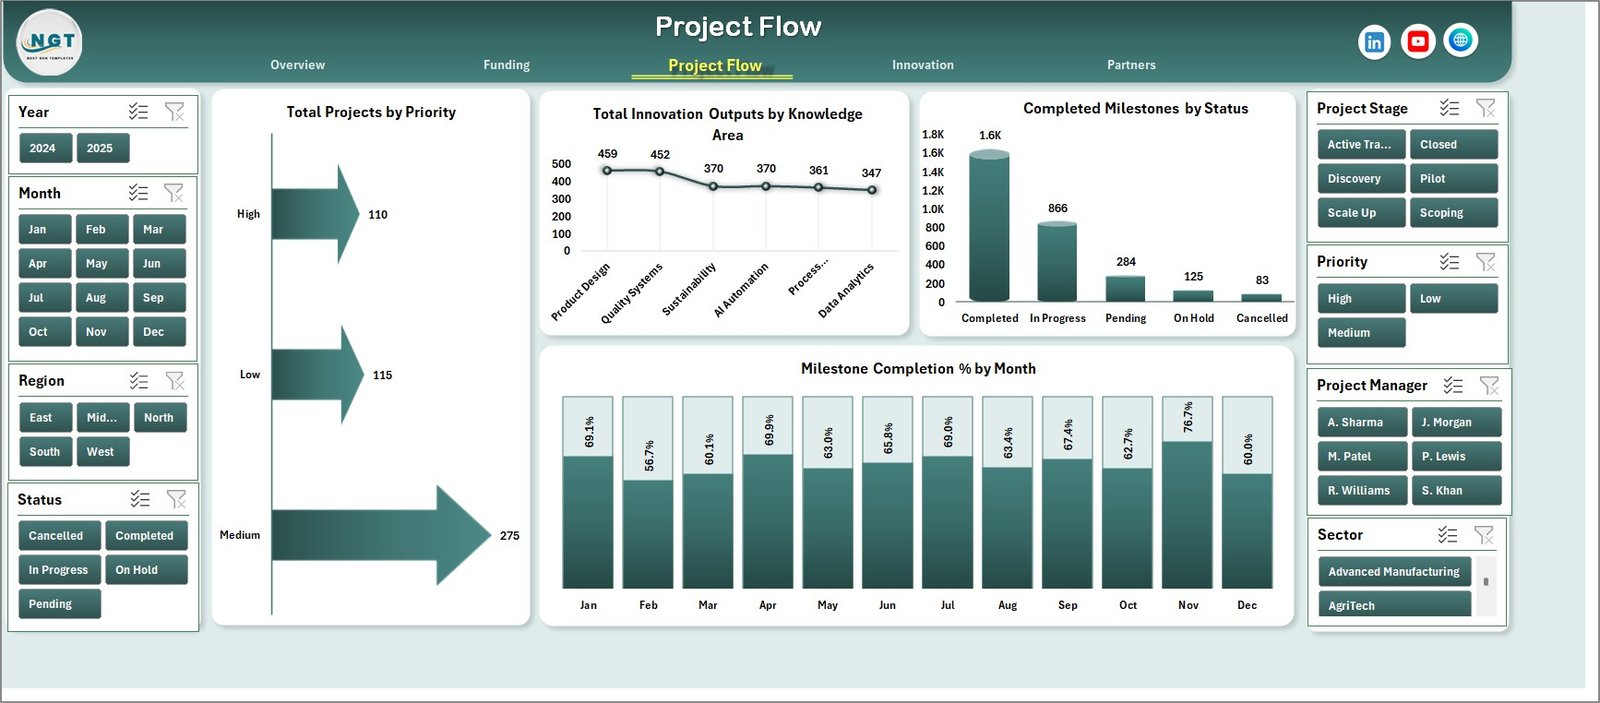
The Project Flow tab helps users understand whether work is moving through the portfolio as expected. It includes Total Projects by Priority, Total Innovation Outputs by Knowledge Area, Completed Milestones by Status, and Milestone Completion % by Month.
Total Projects by Priority shows the balance of high, medium, and low priority work. This helps program leads check whether effort is aligned with strategic importance.
Total Innovation Outputs by Knowledge Area shows where research, expertise, or knowledge exchange is generating the most visible results. It is useful for identifying strengths across technical or academic areas.
Completed Milestones by Status connects progress with project condition. It helps managers see whether completed work is concentrated in healthy projects or whether blocked projects still need attention.
Milestone Completion % by Month reveals the monthly trend in delivery performance. This makes it easier to detect dips in execution before they become larger portfolio risks.
Project Flow
Innovation
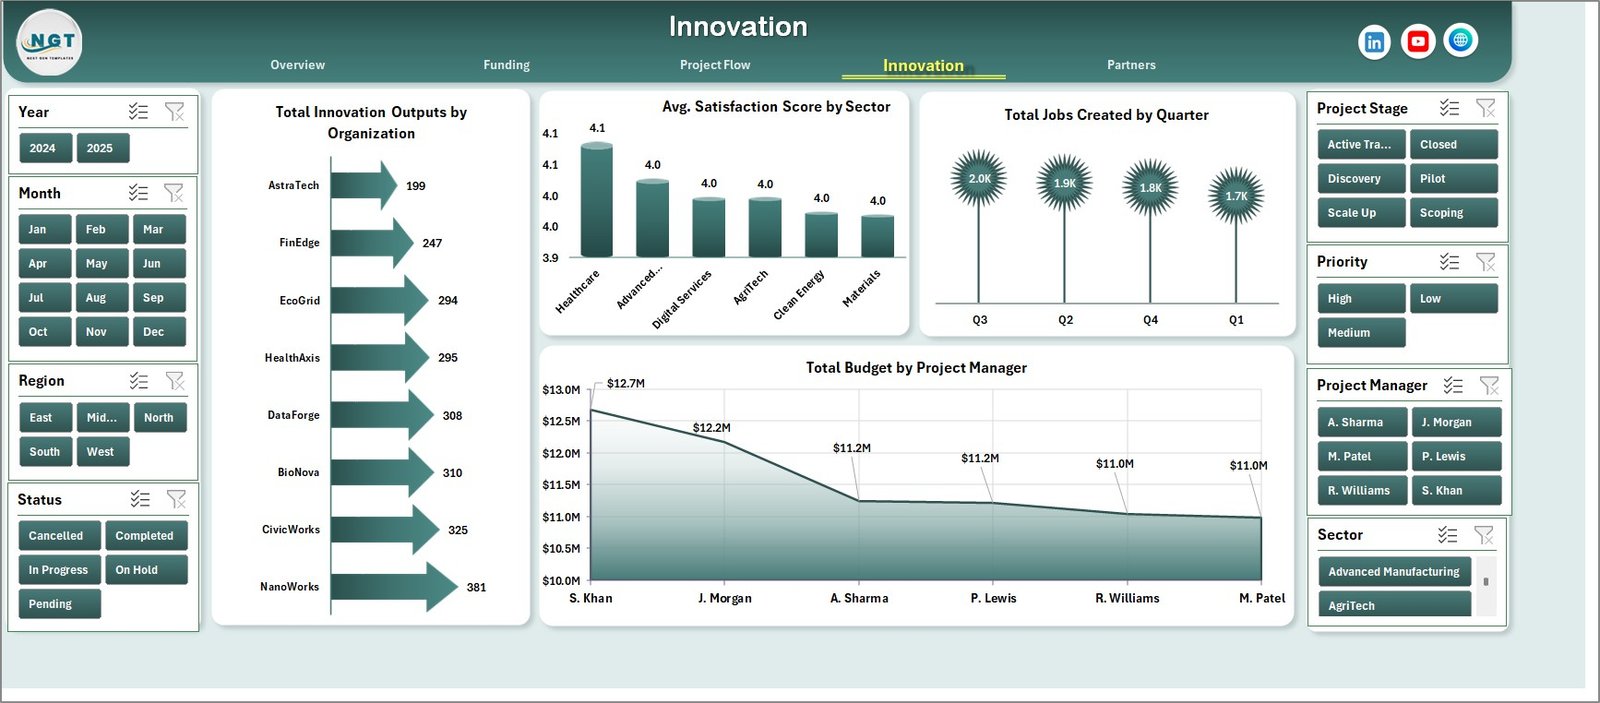
The Innovation page connects spend and delivery with outcomes. It includes Total Innovation Outputs by Organization, Avg. Satisfaction Score by Sector, Total Jobs Created by Quarter, and Total Budget by Project Manager.
Total Innovation Outputs by Organization shows which business or partner organizations are producing the most outputs. This helps identify strong performers and organizations that may need extra support.
Avg. Satisfaction Score by Sector compares stakeholder satisfaction across sectors. It helps program teams understand whether certain sectors are seeing better partner experiences than others.
Total Jobs Created by Quarter tracks economic outcome over time. It is useful for impact reporting, board updates, and funding review packs.
Total Budget by Project Manager shows budget responsibility by manager. This helps leadership review workload, financial ownership, and accountability.
Innovation
Partners
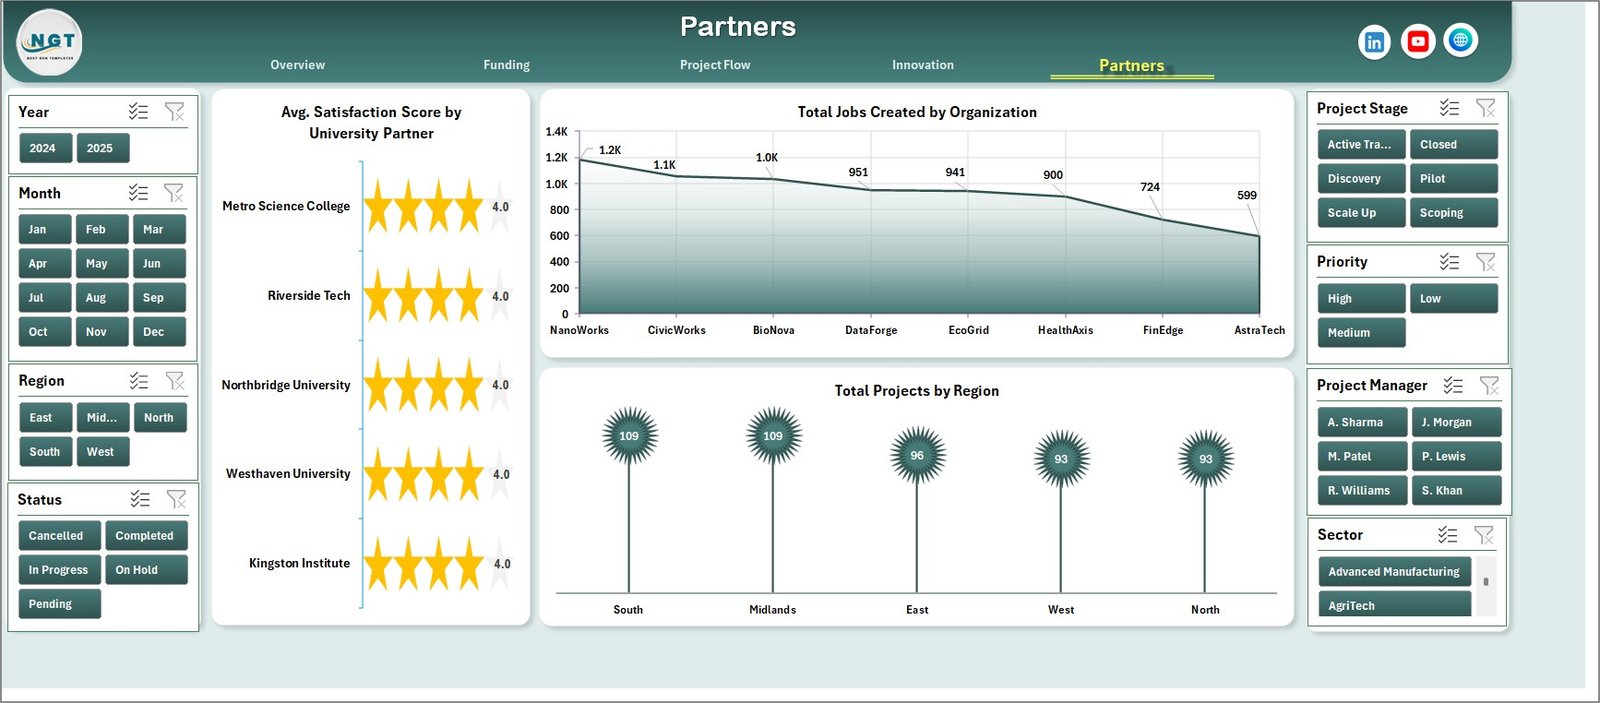
The Partners page focuses on the people and institutions behind the partnership portfolio. It includes Avg. Satisfaction Score by University Partner, Total Jobs Created by Organization, and Total Projects by Region.
Avg. Satisfaction Score by University Partner compares partner experience across academic institutions. It can support relationship reviews and help identify where engagement quality is strongest.
Total Jobs Created by Organization connects partnership activity with economic impact. It helps highlight organizations where the program is creating visible employment outcomes.
Total Projects by Region shows geographic coverage. It helps regional teams review balance, gaps, and concentration across the project portfolio.
Partners
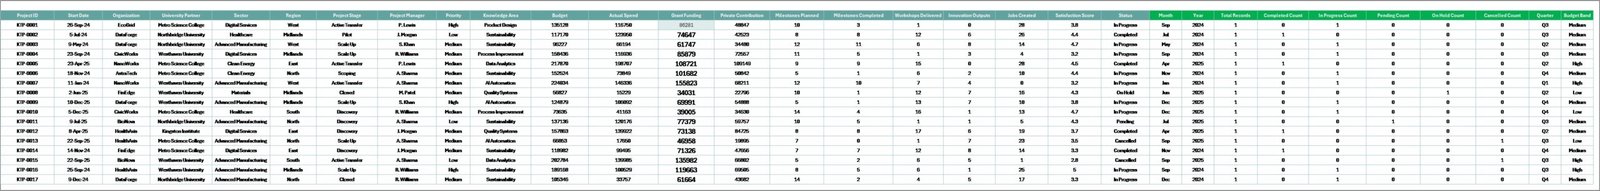
Data Sheet Tab
The Data Sheet is where you add or replace the source records. Keep the same format and column structure, then paste your own project, partner, funding, milestone, organization, sector, status, and outcome records.
Data Sheet tab
Support Sheet Tab
The Support Sheet contains the pivot tables used to create the dashboard dynamically. After updating the Data Sheet, go to the Excel Ribbon, open the Data tab, and click Refresh All. The pivot tables and dashboard charts will refresh from the latest data. You can keep this sheet hidden during normal use.
Support sheet tab
Knowledge Transfer Partnerships Dashboard in Excel vs. Google Sheets vs. Paid Project Management SaaS – Feature Comparison
| Feature | This Excel Dashboard | Google Sheets Alternative | Paid SaaS Alternative |
|---|---|---|---|
| Cost | $17.99 sale price, one-time | Free to low cost, but manual setup | Monthly or annual subscription |
| Platform | Microsoft Excel | Google Sheets | Asana, Monday.com, Smartsheet, grant systems, or BI SaaS |
| Setup time | Replace sample data and refresh | Build formulas, charts, and pivots manually | Requires onboarding and configuration |
| Real-time team collaboration | Best through shared files or OneDrive | Strong browser collaboration | Strong workflow collaboration |
| Mobile access | Limited through Excel mobile | Good | Usually good |
| Customizable fields | Editable worksheet structure | Editable but manually maintained | Depends on plan and admin rights |
| Share with link | Possible through OneDrive or SharePoint | Built in | Built in |
| Year-1 cost at 5 users | $17.99 total | $0 plus build time | Often hundreds to thousands of dollars |
| KTP funding review | Built in | Manual build | Possible with configuration |
| Milestone and innovation reporting | Built in | Manual build | Possible with configuration |
Who Should Use This Template
This template is a good fit for KTP managers, university enterprise teams, grant administrators, innovation project managers, regional development organizations, consultants, and PMO teams that report on multiple partnership projects. It works especially well when your team already uses Excel for monthly or quarterly reporting and wants a reusable structure instead of rebuilding charts from scratch.
It is not the best fit if you need live task assignments, approval workflows, contract management, automated reminders, or direct integration with a grant management system. For those needs, a SaaS platform may be better. This workbook is built for analysis and reporting after the source data has been prepared.
Real-World Use Cases
University KTP manager: Sarah prepares a quarterly review pack for senior leadership. She uses the Overview page to show grant funding, innovation outputs, jobs created, and satisfaction, then moves into the Partners page to discuss university partner performance.
Innovation program lead: James reviews sector performance and project manager budget ownership. He uses the Innovation sheet to connect outputs, satisfaction, jobs created, and budget accountability.
Grant finance analyst: Anita compares planned budget with actual spend by priority and sector. She uses the Funding sheet before submitting internal updates and flags any project groups that need budget review.
Advantages of Knowledge Transfer Partnerships Dashboard in Excel
The main advantage is speed. Once your data follows the workbook structure, you can refresh the pivot tables and update all dashboard pages without rebuilding charts. Excel is also familiar to many university and project teams, which reduces training time.
The workbook also keeps finance, delivery, innovation, and partner reporting in one place. Instead of separate files for funding, milestones, satisfaction, and outputs, you can review the connected story across five dashboard pages. Microsoft also documents the standard Excel features used in this type of workflow, including PivotTables for analyzing worksheet data.
Opportunities for Improvement
This is an Excel dashboard, so it has honest limits. It does not connect automatically to live project systems, it does not send workflow reminders, and it does not replace a grant application or approval platform. Teams that need multi-user live editing, automated data pipelines, or permission-based task management may want a cloud platform or Power BI model in addition to this Excel file.
Best Practices
- Keep the Data Sheet column structure unchanged so the pivot tables continue to refresh correctly.
- Use consistent names for regions, sectors, university partners, organizations, priorities, and statuses.
- Refresh the workbook after every data update before sharing screenshots or reports.
- Hide the Support Sheet after setup so users focus on the dashboard pages and Data Sheet.
- Review budget vs actual spend and milestone completion together, because money and delivery timing should be interpreted side by side.
Explore Relevant Templates
You can purchase the template on the Knowledge Transfer Partnerships Dashboard in Excel product page. You may also like the Knowledge Hubs Dashboard in Excel, IVF Centers Dashboard in Excel, and FP&A Financial Planning & Analysis Pack.
Frequently Asked Questions
What does the Knowledge Transfer Partnerships Dashboard in Excel track?
It tracks budget, actual spend, grant funding, innovation outputs, jobs created, satisfaction score, projects, priorities, milestones, project stages, sectors, regions, organizations, university partners, and project managers.
How many worksheet tabs are included?
The workbook includes seven worksheet tabs: Overview, Funding, Project Flow, Innovation, Partners, Data Sheet, and Support Sheet.
Can I replace the sample data with my own data?
Yes. Replace the sample records in the Data Sheet with your own data while keeping the same column format.
How do I refresh the dashboard?
After updating the Data Sheet, open the Data tab in the Excel Ribbon and click Refresh All. The pivot tables and charts will update from the latest data.
Can the Support Sheet be hidden?
Yes. The Support Sheet contains pivot tables used to power the dashboard. You can keep it hidden after setup.
Is this template a live project management system?
No. It is an Excel reporting dashboard, not a task assignment, approval, workflow, or grant management platform.
About the Author
Built by PK – Microsoft Certified Professional with 15+ years of Excel, Google Sheets, and Power BI experience. Founder of NextGenTemplates, reaching 300K+ subscribers across YouTube channels. Every template is hand-built and tested before release. Visit YouTube.com/@PK-AnExcelExpert for step-by-step video tutorials.
Conclusion
The Knowledge Transfer Partnerships Dashboard in Excel gives KTP and innovation teams a clean way to review funding, project flow, innovation outputs, partner performance, jobs created, and satisfaction in one workbook. If your current reporting process depends on scattered spreadsheets and repeated chart rebuilding, this template gives you a faster Excel structure for recurring reviews.
Click here to purchase the Knowledge Transfer Partnerships Dashboard in Excel.
Instant download. One-time payment. No subscription.
Last updated: June 28, 2026