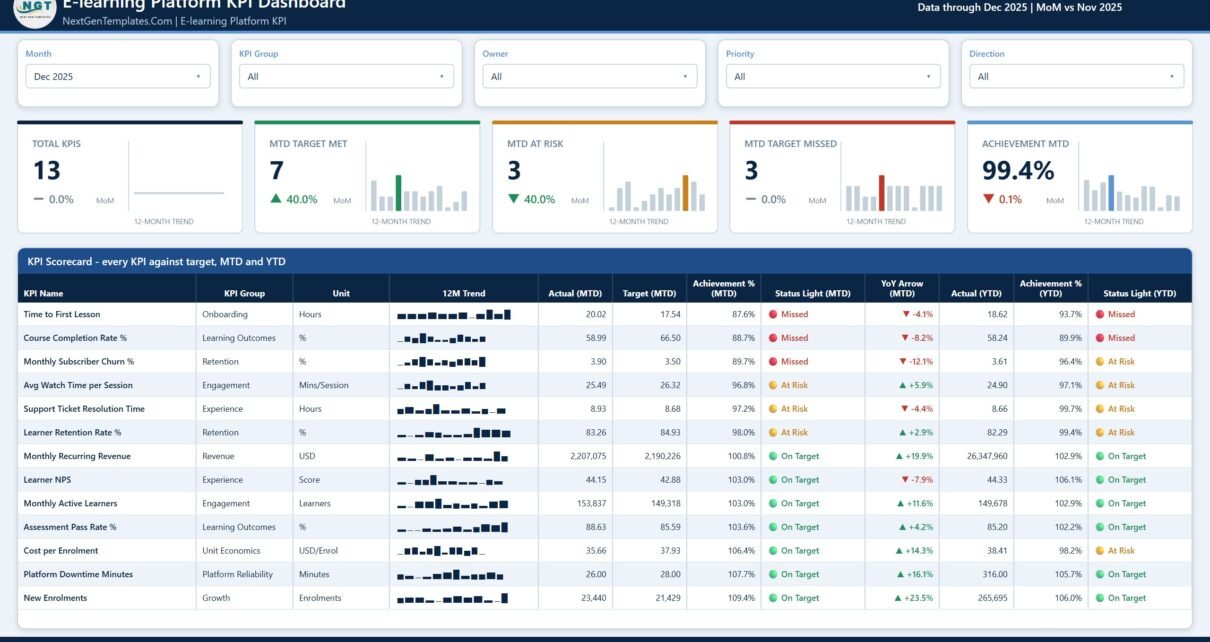
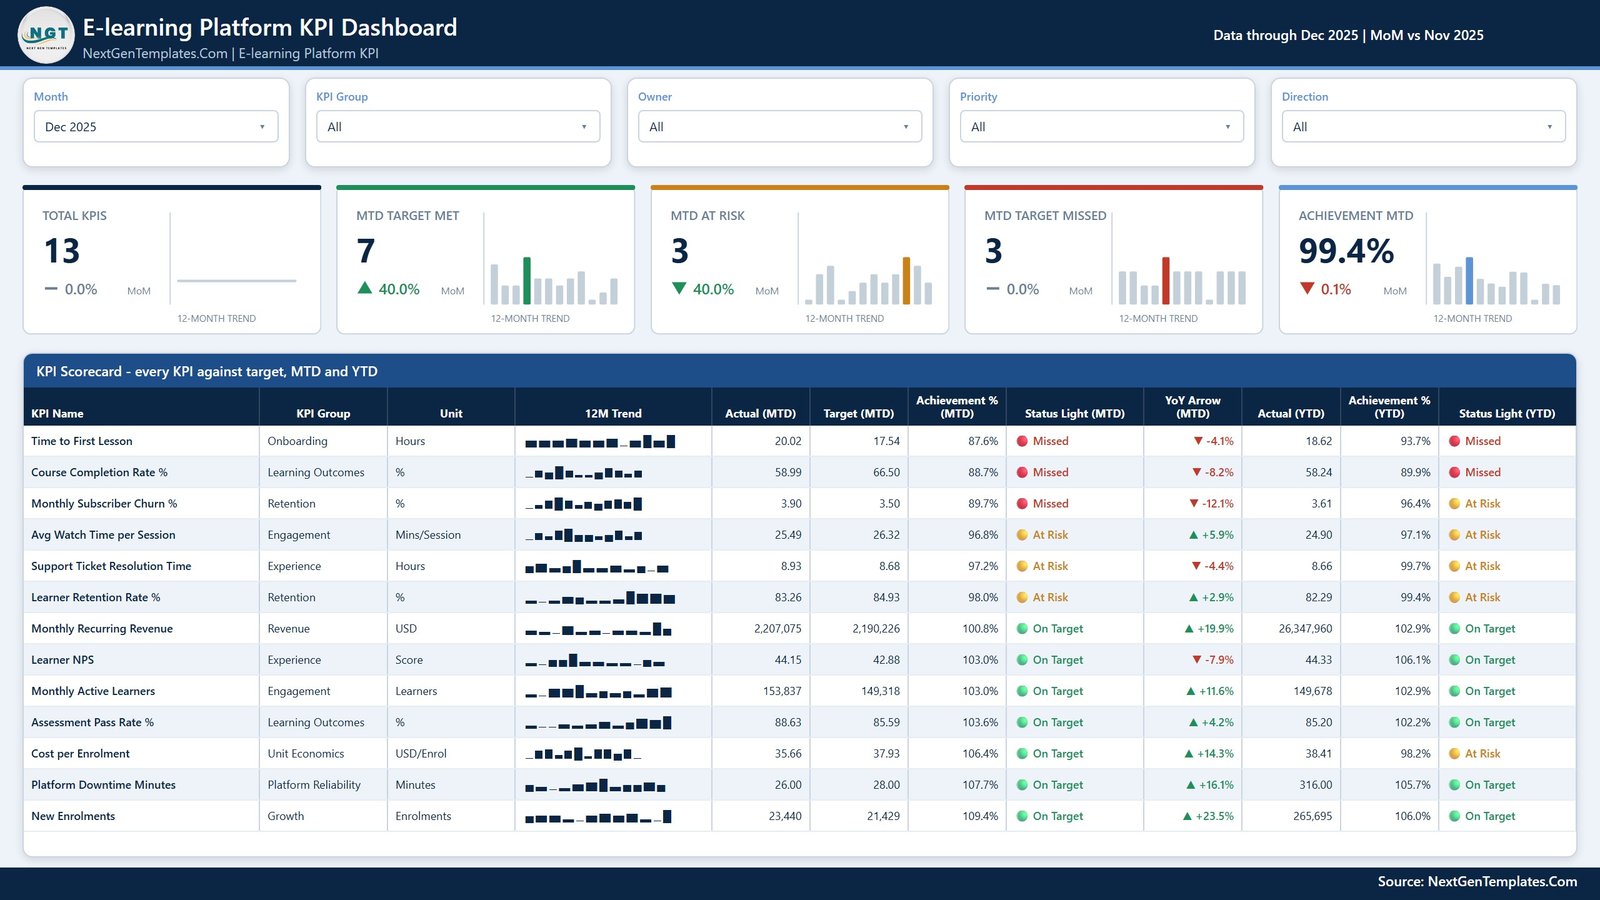
E-learning Platform KPI Dashboard in Power BI gives education and subscription-learning teams a focused way to review 13 KPIs across engagement, learning outcomes, retention, onboarding, learner experience, growth, revenue, unit economics, and platform reliability. In the supplied Dec 2025 sample, 7 KPIs are on target, 3 are at risk, 3 are missed, and overall MTD achievement is 99.4%. These are demonstration values, not benchmarks. Replace the source workbook values and targets with your own before using the report for decisions.
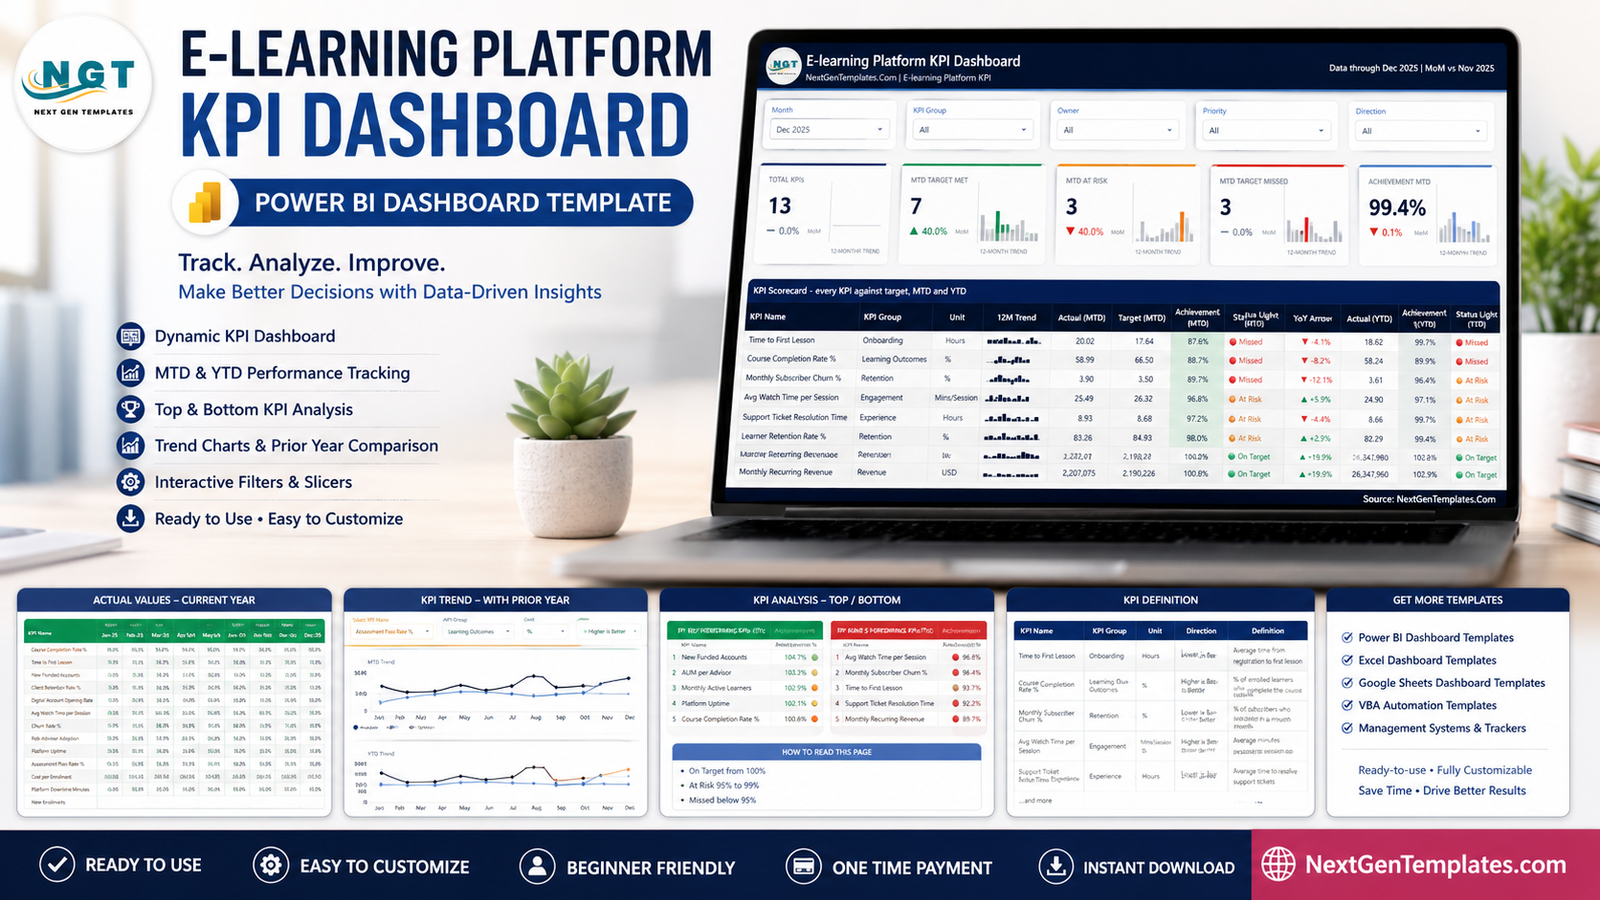
This template sits between manual monthly reporting and a full learning-management analytics implementation. It does not host courses, authenticate learners, issue certificates, or connect automatically to an LMS. It is a ready-to-edit Power BI scorecard for teams that already export or maintain structured KPI data and want actual-versus-target, prior-year, MTD, YTD, and traffic-light reporting in one file.
Key Features of E-learning Platform KPI Dashboard in Power BI
- 13 defined KPIs: Monthly Active Learners, Avg Watch Time per Session, Course Completion Rate %, Assessment Pass Rate %, Learner Retention Rate %, Monthly Subscriber Churn %, Time to First Lesson, Learner NPS, Support Ticket Resolution Time, New Enrolments, Monthly Recurring Revenue, Cost per Enrolment, and Platform Downtime Minutes.
- MTD and YTD perspectives: Compare monthly performance and cumulative performance without rebuilding a presentation.
- Actual, target, and prior-year context: Review achievement and year-over-year direction together.
- UTB/LTB status logic: The dashboard accounts for KPIs where higher is better and metrics such as churn, cost, response time, and downtime where lower is better.
- Interactive slicers: Filter by month, KPI group, owner, priority, and direction.
- Selected-KPI analysis: Trend and definition pages update around the KPI chosen by the user.
- Editable source: The ZIP includes Data.xlsx with separate actual, target, and KPI-definition structures.
- Native Power BI workflow: Keep the source and PBIX together, update the source, and use Home > Refresh.
Dashboard Pages Explanation
1 – KPI Scorecard
The KPI Scorecard is the main monthly review page. Five cards summarize Total KPIs, MTD Target Met, MTD At Risk, MTD Target Missed, and overall Achievement MTD. Each card includes a compact 12-month trend, which helps the viewer distinguish a one-month result from an ongoing pattern.
The scorecard table shows every KPI’s group and unit, a 12-month sparkline, Actual MTD, Target MTD, Achievement % MTD, MTD status light, MTD year-over-year movement, Actual YTD, Achievement % YTD, and YTD status. This structure is useful when an executive needs a broad view while each KPI owner needs enough detail to explain the result.
2 – KPI Trend
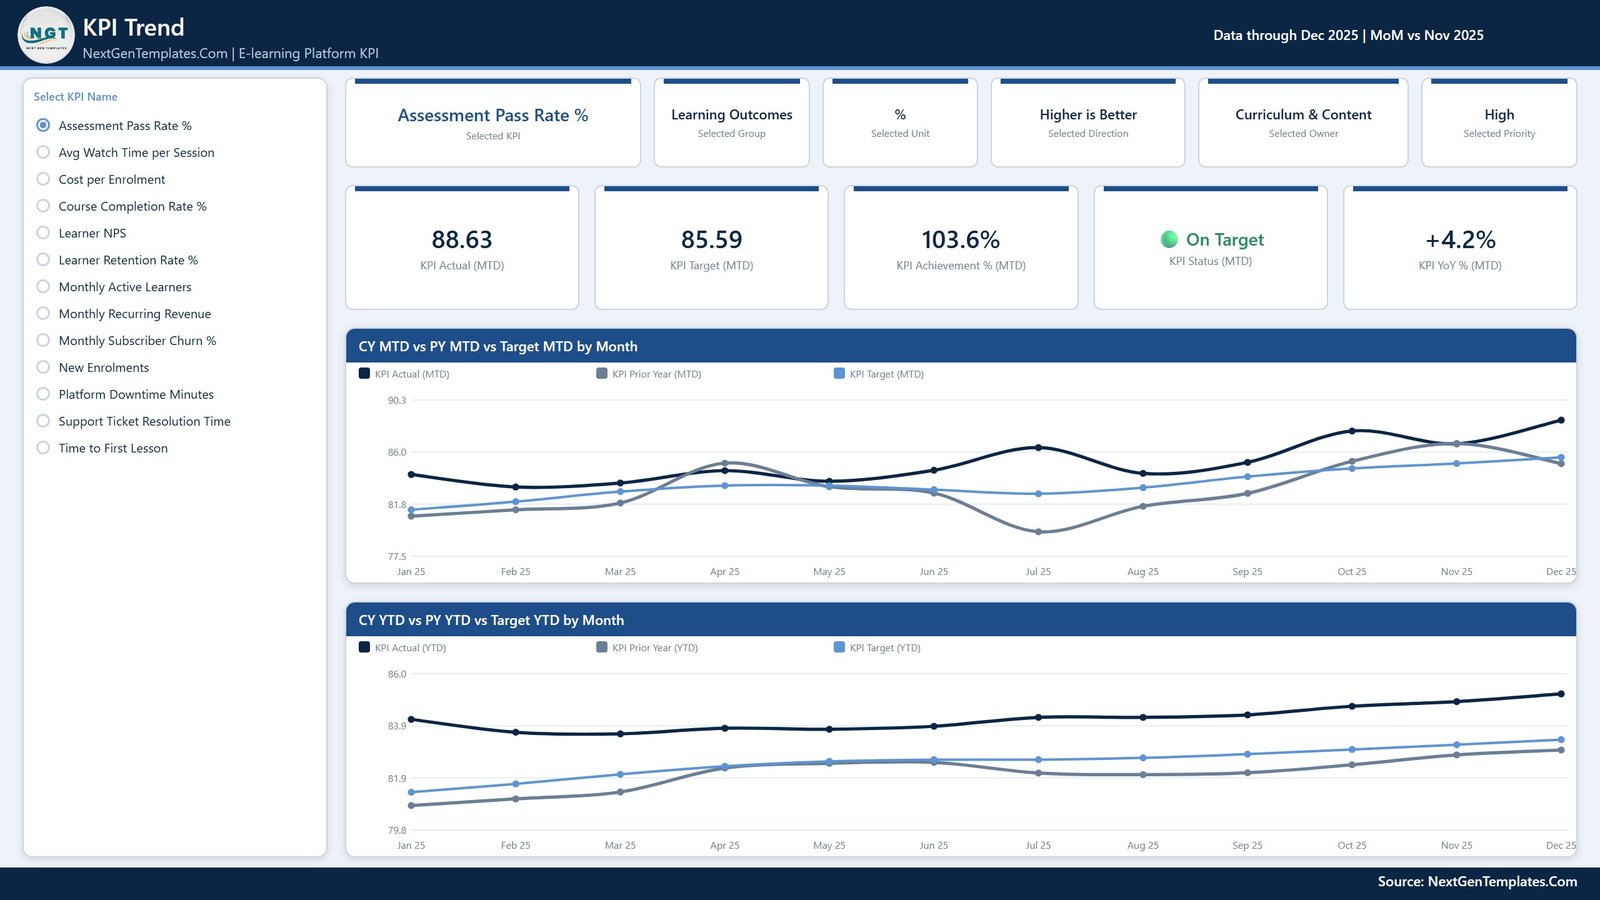
The KPI Trend page focuses the report on one selected measure. The example selects Assessment Pass Rate %, then displays its group, unit, direction, owner, priority, MTD actual, target, achievement, status, and year-over-year change.
The first trend compares current-year MTD, prior-year MTD, and target MTD by month. The second repeats the comparison for YTD values. This separates monthly volatility from cumulative direction and helps a KPI owner prepare a clearer explanation for a review meeting.
3 – KPI Definition
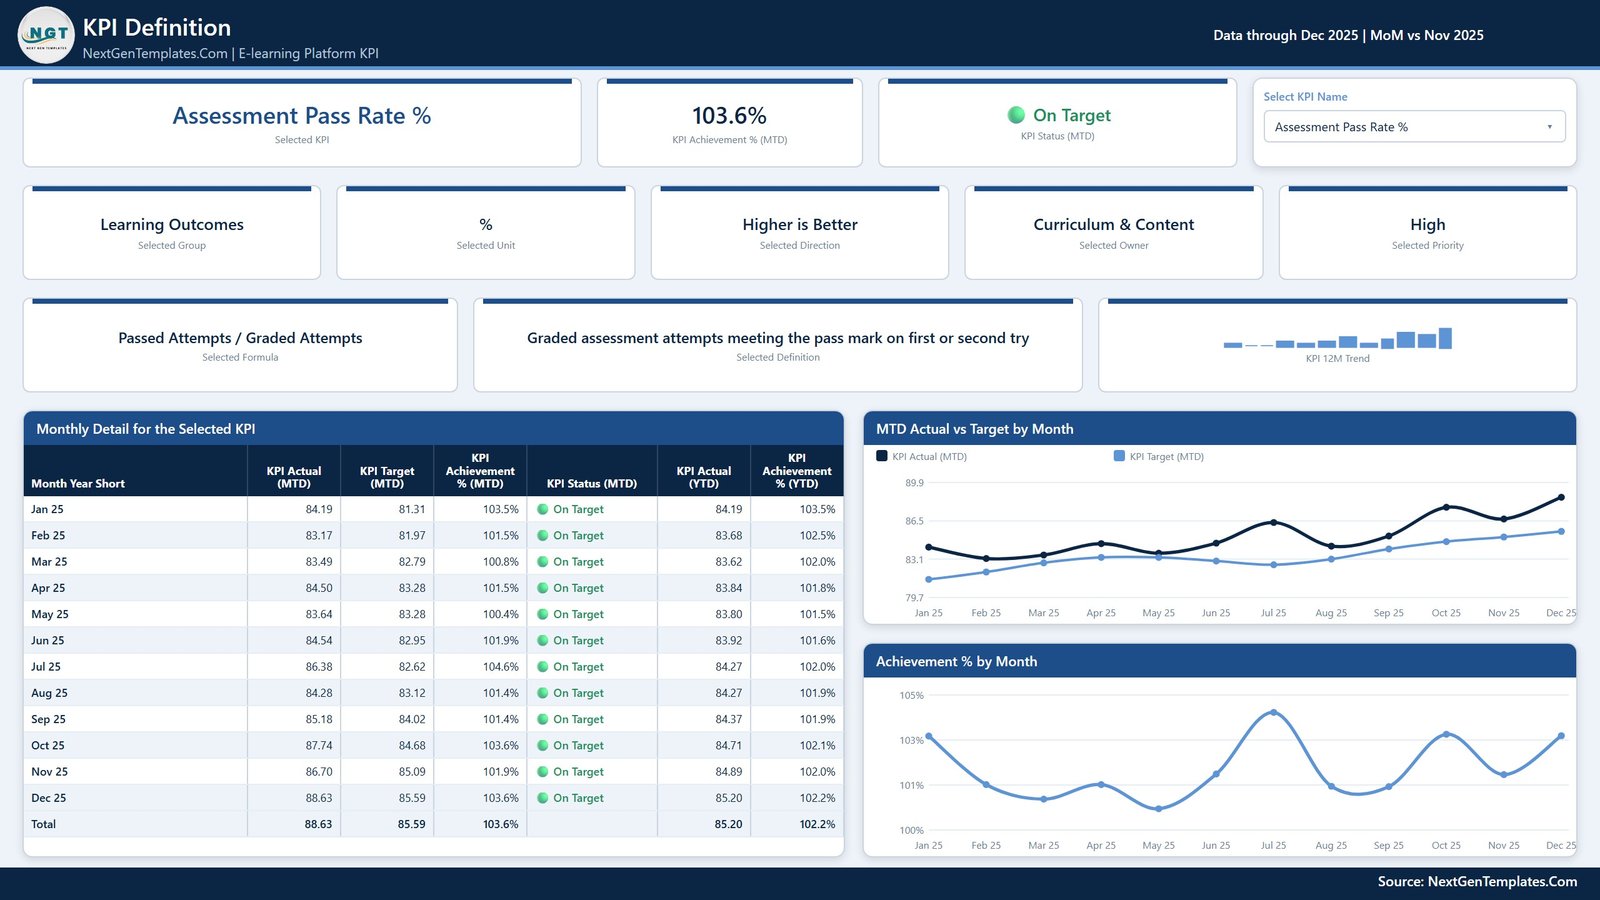
The KPI Definition page keeps business meaning next to performance. For the selected KPI, it shows the group, unit, direction, owner, priority, formula, and plain-language definition. This reduces the risk of two teams using the same KPI name with different calculation rules.
A monthly detail table lists actual, target, achievement, status, YTD actual, and YTD achievement. Separate charts show MTD Actual vs Target by Month and Achievement % by Month. The PBIX also includes two hidden tooltip pages for additional context during interaction.
4 – Get More Templates
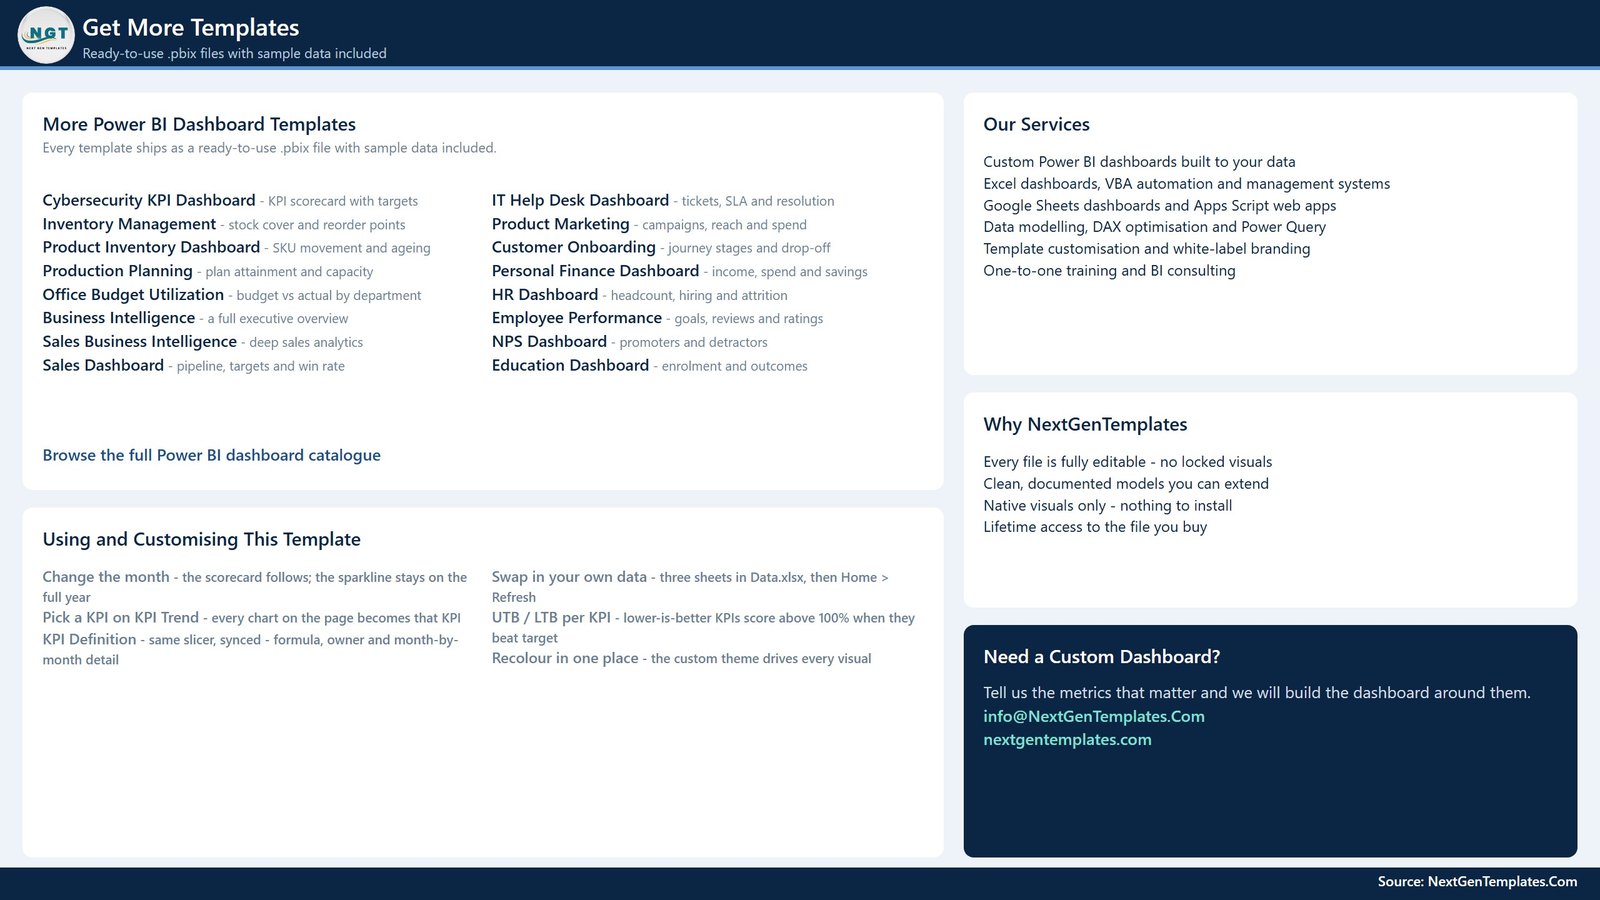
This visible guidance page explains the template’s practical workflow: change the month, replace the data, pick a KPI on the Trend page, apply higher-is-better or lower-is-better direction, and recolor the report through the custom theme. It also points users to related dashboard templates and customization support.
E-learning Platform KPI Dashboard in Power BI vs. Excel vs. Paid LMS/SaaS – Feature Comparison
| Feature | This Power BI template | Excel alternative | Paid LMS/SaaS |
|---|---|---|---|
| Cost | One-time $12.99 sale price | One-time workbook purchase | Recurring subscription |
| Platform | Power BI Desktop | Microsoft Excel | Vendor cloud platform |
| Setup time | Map structured values and refresh | Replace cells and refresh workbook logic | Implementation, configuration, and integration |
| Interactive filtering | Native slicers, tooltips, and cross-filtering | Filters, slicers, and charts | Plan-dependent reporting |
| Custom KPI definitions | Editable source and model | Editable workbook structure | Depends on vendor controls |
| Real-time collaboration | Requires Power BI Service setup | Requires shared-file workflow | Usually included per user |
| Course hosting and learner accounts | No | No | Usually included |
| Best use | Recurring KPI review from maintained or exported data | Spreadsheet-first scorecard review | Live operational course delivery |
Microsoft’s introduction to Power BI Desktop explains the authoring environment used to connect data, shape models, and build interactive reports. This template provides the report and source structure; your team supplies governed data, definitions, targets, refresh processes, and publishing permissions.
Who Should Use This Template
E-learning platform founders can use it for monthly operating reviews. Curriculum and content leaders can focus on completion, pass rate, watch time, and learner retention. Growth and lifecycle teams can review new enrolments, acquisition cost, churn, and active learners. Learner-success and support leaders can follow time to first lesson, NPS, and ticket resolution time. Revenue and engineering owners can monitor recurring revenue and downtime in the same governance rhythm.
It is less suitable when you need learner-level operational workflows, direct LMS synchronization, real-time event streaming, role-based student portals, billing, certificate issuance, or a governed enterprise semantic model managed across many systems.
Real-World Use Cases
Monthly business review: An e-learning founder opens the Scorecard page, filters to the reporting month, and asks each KPI owner to explain missed and at-risk results with the 12-month history visible.
Curriculum quality review: A curriculum lead selects Course Completion Rate % and Assessment Pass Rate % on the Trend page, comparing actuals with targets and prior-year performance before prioritizing course redesign.
Learner onboarding review: A learner-success manager connects Time to First Lesson, retention, NPS, and ticket resolution into one discussion rather than reviewing separate exports.
Advantages of E-learning Platform KPI Dashboard in Power BI
- Combines commercial, learning, service, and platform KPIs in one consistent scorecard.
- Separates MTD and YTD interpretation.
- Keeps the KPI formula and definition visible beside its performance.
- Handles higher-is-better and lower-is-better metrics.
- Offers a one-time editable template without a reporting subscription.
- Provides sample data so the visual behavior is understandable before customization.
Opportunities for Improvement
The template does not include a direct connector to Moodle, Canvas, Blackboard, Thinkific, Teachable, or another LMS. It also does not define organizational benchmarks; targets and traffic-light thresholds must be governed by the buyer. Large learner and revenue figures in the supplied Data.xlsx display with Indian digit grouping, while the Power BI report itself displays standard three-digit grouping. Teams that prefer another locale should adjust the Excel number format during setup.
The report includes four visible pages rather than a full suite of learner, course, cohort, funnel, and instructor analysis pages. If you need that broader exploration, consider a separate analytical dashboard such as the E-learning Content Services Dashboard in Power BI or the Online Certification Providers Dashboard in Power BI.
Best Practices
- Agree KPI names, formulas, owners, units, direction, priority, targets, and thresholds before loading production data.
- Keep the source workbook’s sheet and column structure stable.
- Store the PBIX and Data.xlsx together when using the packaged local connection.
- Refresh and reconcile a few known totals before each reporting cycle.
- Document whether monthly figures are snapshots, sums, averages, or distinct counts.
- Apply row-level security and Power BI Service governance separately if sharing sensitive learner or financial data.
- Back up the original package before modifying measures or visuals.
Explore Relevant Templates
- E-learning Platform KPI Dashboard in Power BI
- Online Learning Platforms KPI Dashboard in Excel
- Education Services KPI Dashboard in Excel
- Education and Learning Customer Feedback KPI Dashboard in Excel
Frequently Asked Questions
Does the dashboard connect directly to an LMS?
No. No live LMS connector is included. Export or maintain data in the provided structure and refresh the PBIX.
What files are included?
The ZIP includes the Power BI PBIX, Data.xlsx source workbook, and a Power BI dashboard user manual.
Are the displayed targets recommendations?
No. The sample actuals, targets, prior-year figures, thresholds, and statuses demonstrate the template. Replace them with approved organizational values.
Can I add more KPIs?
Yes, but structural changes may require edits to source data, measures, relationships, slicers, and visual layouts. Basic Power BI modeling knowledge is recommended.
Can I publish it to Power BI Service?
Yes, subject to your Microsoft licensing, gateway, refresh, workspace, and security setup. Those services and configurations are not included in the template.
Is this a full learning management system?
No. It is an analytics scorecard, not a course player, student portal, authentication system, payment gateway, or certificate tool.
About the Author
Built by PK – Microsoft Certified Professional with 15+ years of Excel, Google Sheets, and Power BI experience. Founder of NextGenTemplates, reaching 300K+ subscribers across YouTube channels. Every template is hand-built and tested before release.
Conclusion
The E-learning Platform KPI Dashboard in Power BI is a practical choice when your team needs a repeatable scorecard rather than another operational platform. Its 13-KPI structure brings learning outcomes, engagement, retention, onboarding, support, revenue, unit economics, and reliability into one MTD/YTD review. Use the sample data to understand the logic, replace it with governed figures, set your own targets, refresh, and review exceptions with the KPI definitions close at hand.
View the E-learning Platform KPI Dashboard in Power BI.
For more Excel and Power BI tutorials, visit PK-AnExcelExpert on YouTube.