Consciousness research is one of the hardest portfolios in science to report on. A single centre can be running an EEG sleep study, an fMRI meditation protocol and a coma-recovery observational arm at the same time, each with its own enrolment curve, its own recording burden and its own grant line. The Consciousness Research Labs Dashboard in Excel pulls all of that into five report pages. The sample build tracks 500 studies, 15,860 enrolled participants, 24,981 recording sessions and $141.8M in grant funding across seven labs, six research programmes and seven recording modalities – and the whole thing runs on plain Excel formulas, pivot tables and slicers. Consciousness Research Labs Dashboard in Excel
One clarification before we start, because NextGenTemplates ships two different research templates. This is the analytical dashboard: five wide pages you explore with slicers. It is not the KPI scorecard format with a month picker, target-versus-actual columns and traffic lights. Different template, different job. Consciousness Research Labs Dashboard in Excel
Key Features of the Consciousness Research Labs Dashboard in Excel
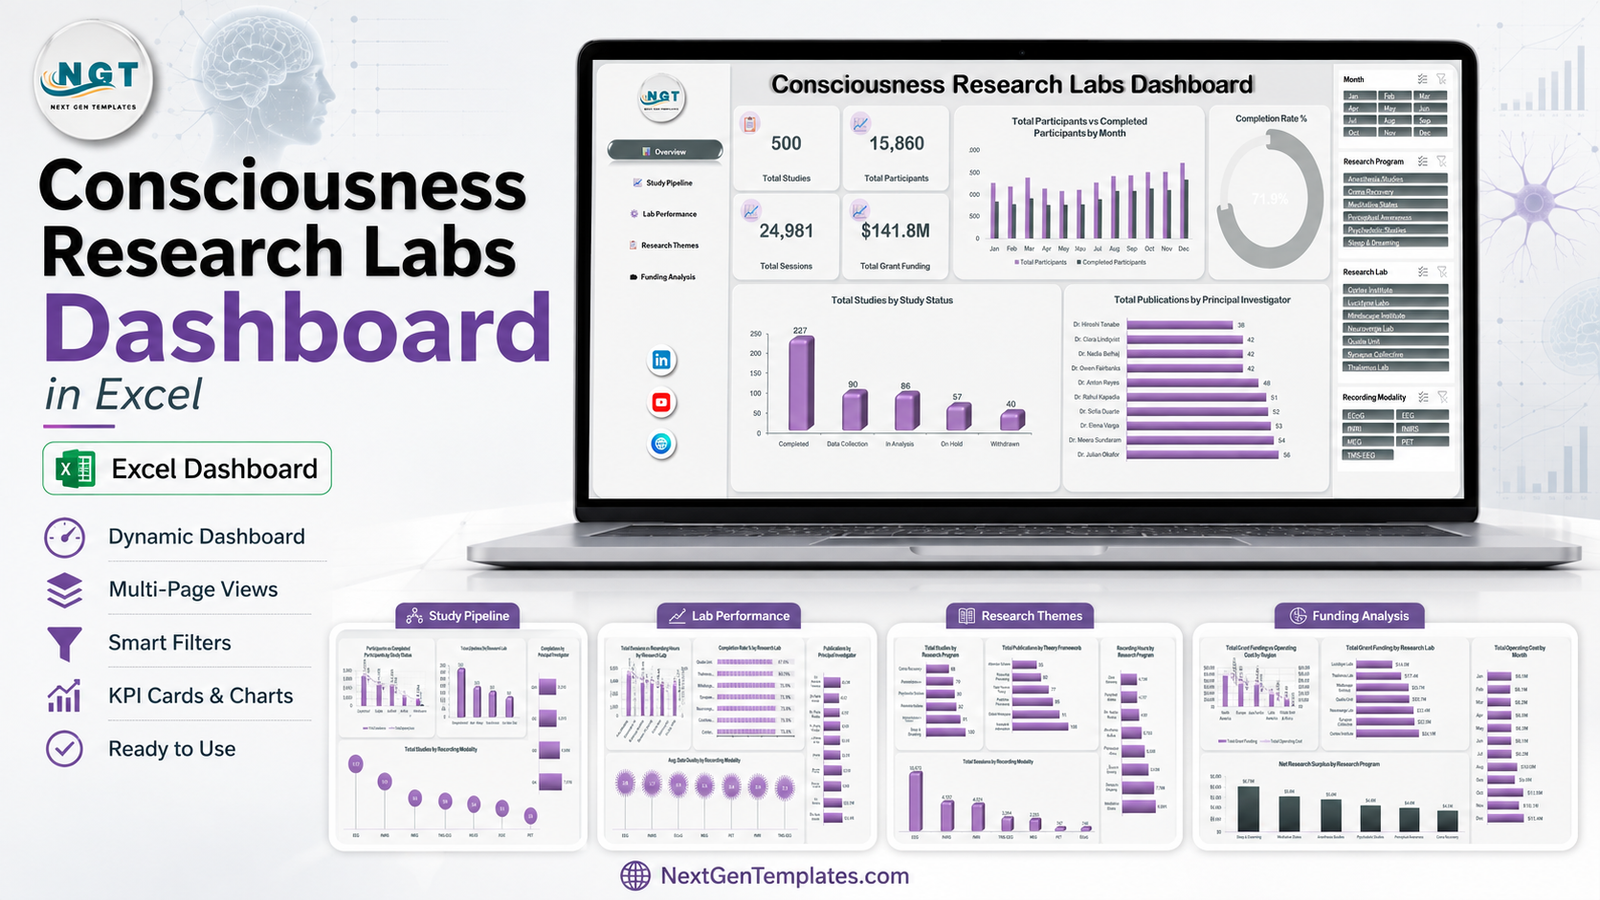
- Five report pages – Overview, Study Pipeline, Lab Performance, Research Themes and Funding Analysis, each with a left-hand navigation rail.
- Four slicers synced across every page – Month, Research Program, Research Lab and Recording Modality. One click re-scopes the entire report.
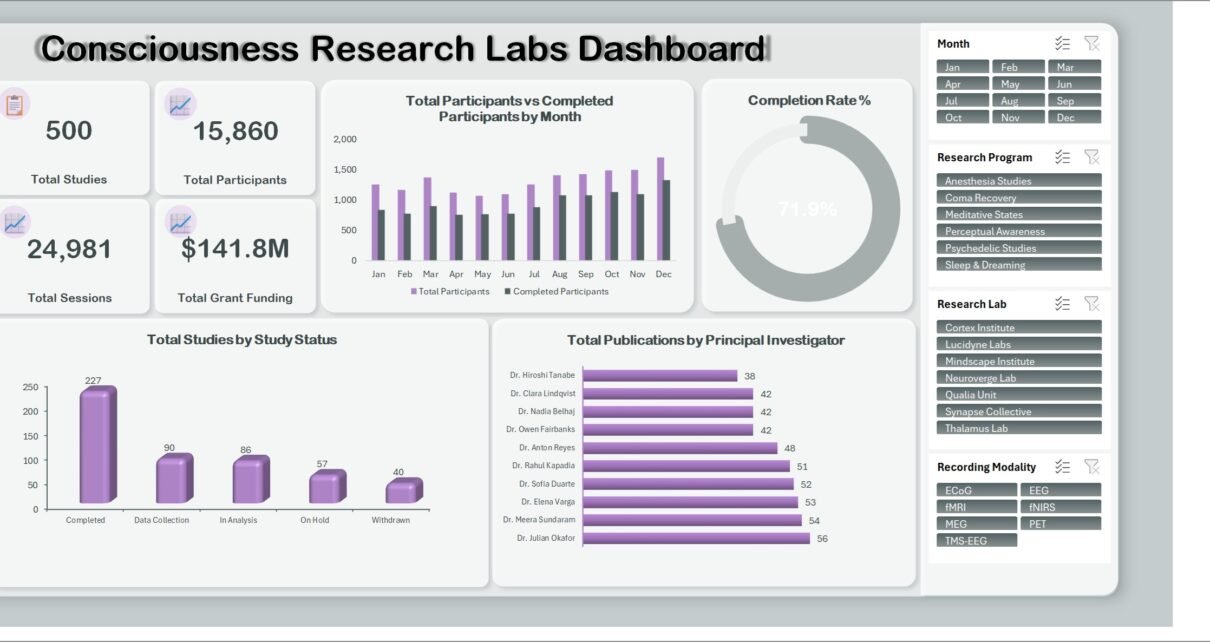
- Four headline cards – Total Studies (500), Total Participants (15,860), Total Sessions (24,981) and Total Grant Funding ($141.8M).
- A completion-rate donut showing 71.9% enrolment-to-completion for the current filter.
- Seven-lab comparison covering sessions, recording hours, completion rate and grant income.
- Modality-level analysis for EEG, fMRI, MEG, fNIRS, TMS-EEG, ECoG and PET.
- A theory-framework view – publications split across Integrated Information, Global Workspace, Predictive Processing, Higher-Order Theory, Recurrent Processing and Attention Schema.
- Funding against operating cost by region and by month, plus net research surplus by programme.
- No macros and no add-ins – a plain .xlsx that opens in Excel 2016 and later on Windows and Mac. Consciousness Research Labs Dashboard in Excel
Dashboard Pages Explanation
Page 1 – Overview
The landing page. Four cards across the top – Total Studies 500, Total Participants 15,860, Total Sessions 24,981, Total Grant Funding $141.8M – then four visuals. Total Participants vs Completed Participants by Month is a clustered column chart that puts enrolment next to completion for all twelve months, so a widening gap in the second half of the year is visible without any arithmetic. Completion Rate % is a donut reading 71.9%. Total Studies by Study Status breaks the portfolio into Completed 227, Data Collection 90, In Analysis 86, On Hold 57 and Withdrawn 40. Total Publications by Principal Investigator ranks all ten PIs, from Dr. Julian Okafor on 56 down to Dr. Hiroshi Tanabe on 38. Consciousness Research Labs Dashboard in Excel
Page 2 – Study Pipeline
Where the portfolio actually stands. Participants vs Completed Participants by Study Status shows that Completed studies account for 7,373 enrolled and 6,067 finished, while On Hold studies sit at 1,631 enrolled against only 936 finished. Total Studies by Study Type splits the 500 into Experimental 182, Observational 100, Clinical Trial 93, Computational 67 and Replication 58. Total Sessions by Quarter climbs steadily – Q1 5,310, Q2 5,013, Q3 6,680, Q4 7,978. Total Studies by Recording Modality uses a lollipop layout: EEG 137, fMRI 107, MEG 64, fNIRS 59, TMS-EEG 54, ECoG 51 and PET 28. Consciousness Research Labs Dashboard in Excel
Page 3 – Lab Performance
The league table. Total Sessions vs Recording Hours by Research Lab is a combination chart – Cortex Institute logs 4,453 sessions and 7,166 recording hours, Lucidyne Labs 2,767 and 4,199 – so you can see which labs run long sessions and which run many short ones. Completion Rate % by Research Lab is the page’s most useful visual: Cortex Institute 75.6%, Lucidyne Labs 75.5%, Neuroverge Lab 73.8%, Synapse Collective 71.1%, Mindscape Institute 70.6%, Thalamus Lab 69.1% and Qualia Unit 67.6%. An eight-point spread across seven labs is a recruitment conversation, not a rounding error. Publications by Principal Investigator repeats the PI ranking in context, and Avg. Data Quality by Recording Modality scores EEG 3.8, fNIRS 3.7, ECoG 3.6, MEG 3.5, PET 3.4, fMRI 3.4 and TMS-EEG 3.3.
Page 4 – Research Themes
The science view. Total Studies by Research Program ranks Sleep & Dreaming 100, Meditative States 91, Anesthesia Studies 82, Psychedelic Studies 80, Perceptual Awareness 79 and Coma Recovery 68. Total Publications by Theory Framework puts Integrated Information on 108, Global Workspace 91, Predictive Processing 85, Higher-Order Theory 77, Recurrent Processing 62 and Attention Schema 55. Recording Hours by Research Program shows where the instrument time actually goes – Meditative States 8,091 hours and Sleep & Dreaming 7,768, against Coma Recovery’s 4,736. Total Sessions by Recording Modality makes the EEG dominance obvious: 10,673 sessions against fNIRS 4,182, fMRI 4,024, TMS-EEG 2,354, MEG 2,255, PET 747 and ECoG 746. Consciousness Research Labs Dashboard in Excel
Page 5 – Funding Analysis
The money. Total Grant Funding vs Operating Cost by Region runs North America $47.8M against $37.4M, Europe $33.9M against $26.5M, Asia Pacific $32.5M against $25.2M, Latin America $18.6M against $14.4M and Middle East & Africa $8.9M against $6.9M. Total Grant Funding by Research Lab ranks Cortex Institute $24.1M at the top and Lucidyne Labs $14.0M at the bottom. Total Operating Cost by Month traces the burn from $9.1M in January to $11.4M in December. Net Research Surplus by Research Program closes the report: Sleep & Dreaming $6.7M, Meditative States $5.8M, Anesthesia Studies $5.6M, Psychedelic Studies $4.6M, Perceptual Awareness $4.6M and Coma Recovery $4.1M. Consciousness Research Labs Dashboard in Excel
Consciousness Research Labs Dashboard in Excel vs. Google Sheets vs. Paid Research SaaS – Feature Comparison
| What matters | This Excel dashboard | Google Sheets build | REDCap Cloud / LabArchives |
|---|---|---|---|
| Cost | $17.99 once | Free tool, days of build time | $3,000-$25,000 per year |
| Platform | Excel 2016+, Mac, 365 | Browser only | Vendor cloud |
| Setup time | Under 20 minutes | 2-5 days to build | 6-12 weeks with onboarding |
| Real-time team collaboration | Via OneDrive or SharePoint | Native | Native |
| Mobile access | Excel mobile, limited slicers | Full | Full |
| Customisable fields | Add columns, pivots follow | Yes, you build them | Vendor change request |
| Share with a link | Yes, from OneDrive | Yes | Yes |
| Year-1 cost at 5 users | $17.99 | $0 plus build time | $15,000+ |
| Grant vs operating cost view | Built in by region and programme | Build it yourself | Usually a paid finance module |
| Modality data-quality scoring | Built in for 7 modalities | Build it yourself | Rarely included |
Who Should Use This Template
Lab managers running several programmes at once get the most out of it, because the four slicers let them isolate one programme, one lab or one modality without rebuilding anything. Research directors preparing a funding board pack can export the Lab Performance and Funding Analysis pages straight to PDF. Grants and finance officers live on page five. Study coordinators use the Study Pipeline page to spot on-hold studies before they turn into withdrawals. PhD programme administrators use the PI publication ranking for annual reviews. Consciousness Research Labs Dashboard in Excel
It is less useful if you run a single small study, or if you need live instrument feeds – this reads a data sheet, it does not connect to an EEG rig. It is not an eCRF and should not be a system of record for a regulated trial. Consciousness Research Labs Dashboard in Excel
Real-World Use Cases
A university consciousness centre reporting quarterly. The director filters to Q4, exports Lab Performance, and shows the board that Cortex Institute converts 75.6% of enrolled participants while Qualia Unit sits at 67.6%. That single chart is what triggers a recruitment review rather than a general budget cut.
A multi-site grant renewal. The finance officer needs income against cost by region. North America’s $47.8M of grant funding against $37.4M of operating cost is a healthy margin; Middle East & Africa’s $8.9M against $6.9M is thinner and needs a narrative in the renewal document.
Scanner-time planning. When On Hold studies climbed to 57, the coordinator used the Recording Modality slicer and found most of them were fMRI-dependent. Sessions by modality confirmed it – fMRI runs 4,024 sessions against EEG’s 10,673, and the bottleneck was scanner availability, not recruitment.
Advantages of the Consciousness Research Labs Dashboard in Excel
It is fast to adopt. There is no vendor onboarding, no data-processing agreement and no IT ticket – you download an .xlsx, paste your rows in and press Ctrl + Alt + F5. Because it uses native pivot tables and slicers rather than macros, it survives corporate macro blocks and opens on locked-down research machines. The slicer rail is genuinely cross-connected, which is what makes five pages feel like one report instead of five separate files. And the funding page is unusual for a template at this price: most research dashboards stop at activity metrics and never put grant income next to operating cost.
Opportunities for Improvement
Honest limitations. There is no live connection to lab instruments or to a LIMS, so someone has to export and paste. Slicers only work properly in desktop Excel; Excel Online renders the charts but the slicer buttons are limited. The workbook has no user-level permissions, so if you share it on OneDrive everyone with the link sees every lab’s numbers. And the sample data covers one calendar year – if you want multi-year trending you will need to extend the date table and widen the month axis yourself.
Best Practices
Keep the column headers exactly as shipped; the pivots reference them by name. Paste values, not formatted cells, so the data sheet stays clean. Refresh with Ctrl + Alt + F5 rather than refreshing one pivot at a time. Clear all slicers before exporting a page to PDF, or the board will read a filtered number as a total. If you add a research programme or a lab, add it in the data sheet rather than editing chart series – the slicer buttons rebuild automatically. Microsoft’s own guide to using slicers to filter data is worth ten minutes if you have not connected slicers to multiple pivots before.
Explore Relevant Templates
- Quantum Computing Labs Dashboard in Excel – the same five-page structure for a physics lab portfolio.
- Machine Learning Labs Dashboard in Excel – experiment tracking, compute cost and model output.
- Clinical Trials Management Dashboard in Excel – site enrolment, screening and protocol deviations.
- Clinical Data Management Dashboard in Excel – query ageing and data-cleaning throughput.
Frequently Asked Questions
Does the dashboard need macros?
No. It is a plain .xlsx built on formulas, pivot tables and slicers. Nothing to enable and nothing to install.
Which versions of Excel does it support?
Excel 2016, 2019, 2021 and Microsoft 365 on Windows and Mac. Slicers need a desktop version to behave properly.
Can I replace the seven sample labs with my own?
Yes. Type your lab names into the data sheet and refresh. Slicer buttons and chart axes rebuild from your values.
How is this different from the KPI scorecard templates?
This is the analytical dashboard – five wide pages driven by slicers, built for exploring a portfolio. The KPI scorecard line uses a month picker, target-versus-actual traffic lights and a dedicated trend page.
How much data can it hold?
The sample carries 500 studies and roughly 25,000 sessions. Pivot tables handle far more; tens of thousands of rows refresh in seconds.
Can I add my institution’s branding?
Yes. The workbook is unlocked – swap the logo, change the palette and edit the page titles.
About the Author
Built by PK – Microsoft Certified Professional with 15+ years of Excel, Google Sheets, and Power BI experience. Founder of NextGenTemplates, reaching 300K+ subscribers across YouTube channels. Every template is hand-built and tested before release.
Conclusion
Research portfolios fail to get funded not because the science is weak but because the reporting is scattered across a dozen spreadsheets. The Consciousness Research Labs Dashboard in Excel puts enrolment, completion, recording burden, publication output and grant economics on five pages that share one filter set. At $17.99 instead of $29.99 it costs less than an hour of a research assistant’s time, and it opens on any machine in the building.
Get the Consciousness Research Labs Dashboard in Excel on NextGenTemplates – instant download, unlocked file, lifetime updates.
For more Excel dashboard walkthroughs, subscribe to youtube.com/@PKAnExcelExpert.