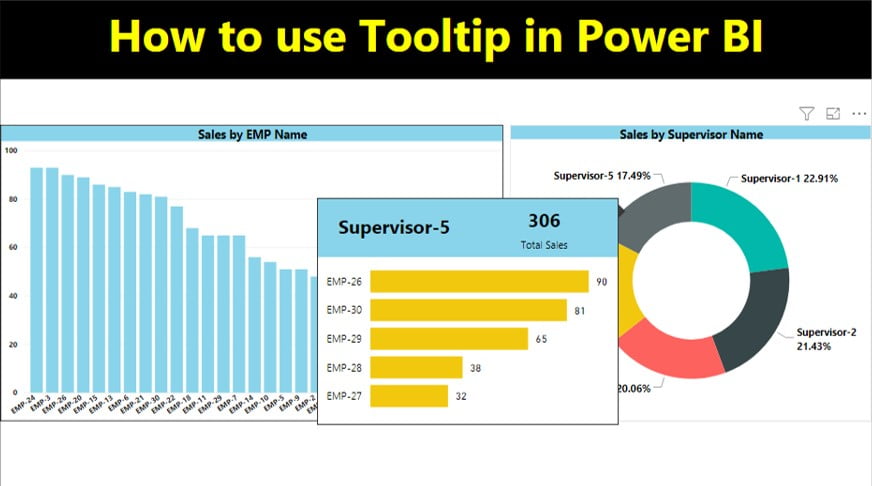
Power BI tooltips are the small boxes that pop up when you hover over a data point. By default they show the field names and values in a dark box, but you can restyle them, and you can even replace them with a whole report page. In this tutorial you do both with PK’s supervisor sales example: first you format the default tooltip of an employee sales chart, then you build a report page tooltip that shows each supervisor’s total sales and employee breakdown when you hover over a doughnut chart. Every step uses the current Power BI Desktop names.
⬇️ Download the Practice Files
ZIP (39 KB) · Tool tip data.xlsx (sales data) + Tool tip in Power BI.pbix (finished report)
Watch the Video Tutorial
PK loads the sales data into a new file, gives the employee chart a yellow tooltip with black text, then designs a small tooltip page and assigns it to the supervisor doughnut chart. The video was recorded in 2019, so some pane names differ from today’s Desktop; the steps below use the current names.
What You Will Build
- A clustered column chart of sales by employee with a restyled default tooltip: black label and value text on a yellow background.
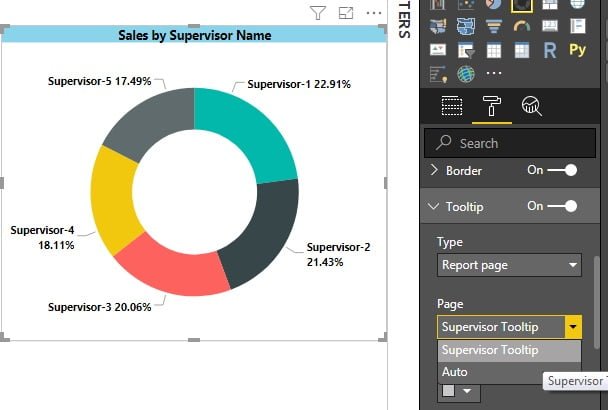
- A doughnut chart of sales by supervisor with category and percent of total labels.
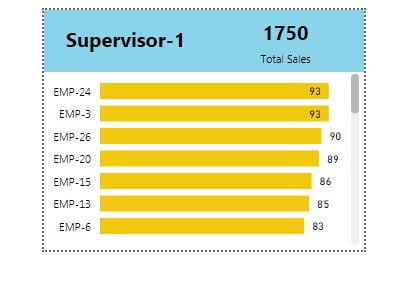
- A tooltip page with two cards (supervisor name and total sales) and a bar chart of sales by employee.
- A report page tooltip on the doughnut, so the page appears, filtered to the supervisor you hover over.
The Practice Data
The Excel file has one table, Sales, with three columns: EMP Name, Supervisor Name and Sales. There are 30 employees (EMP-1 to EMP-30) under five supervisors. Supervisor-1 has seven employees and total sales of 401; Supervisor-2 has 375, Supervisor-3 351, Supervisor-4 317 and Supervisor-5 306.
Step 1: Load the data
In a new Power BI Desktop file select Home > Get data > Excel workbook, open Tool tip data.xlsx, tick the Sales table and click Load. The three fields appear in the Data pane.
Part 1: Format the Default Power BI Tooltip
Step 2: Create the employee sales chart
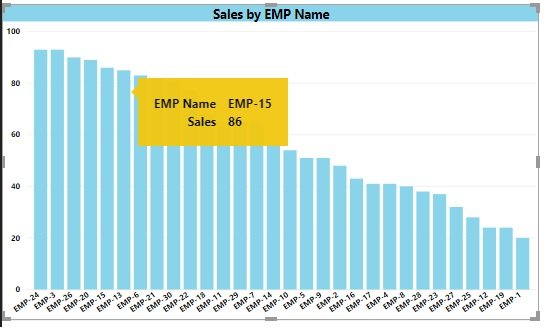
Add a Clustered column chart with EMP Name on the X-axis and Sales on the Y-axis. Hover over a column: the default tooltip shows EMP Name and Sales in a dark box with light grey text.
Step 3: Restyle the tooltip
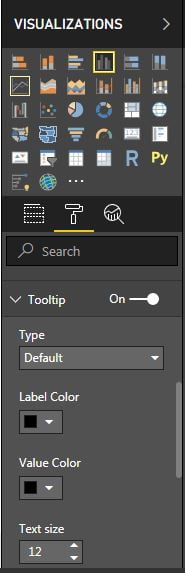
- Select the chart and, in the Visualizations pane, click the Format visual icon (the paintbrush).
- Open the General tab and expand the Tooltips card.
- Under Text, set the Label color and Value color to black, and choose the font, size and style. PK uses Segoe (Bold).
- Under Background, set the Color to yellow and adjust Transparency if you like.
Hover over a column again and the tooltip uses your colours and font. A bigger text size makes the tooltip larger and easier to read on a projector.
Part 2: Create a Report Page Tooltip in Power BI
A report page tooltip is a normal report page, sized small and marked as a tooltip. When you hover over a visual, Power BI shows that page filtered to the data point under your mouse.
Step 4: Add the supervisor doughnut chart
On Page 1 add a Doughnut chart with Supervisor Name in Legend and Sales in Values. To show the share of each supervisor, open Format visual > Visual > Detail labels and set Label contents to Category, percent of total.
Step 5: Add a new page and make it a tooltip
- Click the + button next to the page tabs to add a page.
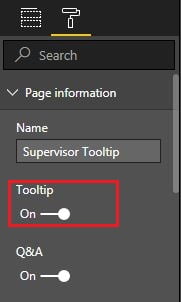
- With nothing selected on the new page, the Visualizations pane shows Format page. Expand Page information and turn on Allow use as tooltip (called Tooltip in older versions).
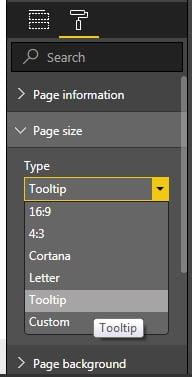
- Expand Canvas settings and set Type to Tooltip. The canvas shrinks to the tooltip size, 320 x 240 pixels in the practice file.
- In Page information, type a clear Name. PK uses Supervisor Tooltip in the video; the page is called Tooltip in the download file.
Tip from Microsoft: select View > Page view > Actual size while you design, so you see the page at the size it will appear.
Step 6: Design the tooltip page
Keep it small and focused. PK’s page has three visuals:
- Card 1, supervisor name: drag Supervisor Name to the page and switch the visual to a Card. Turn off the Category label so only the name shows, increase the font size, pick a bold font and turn on a Background colour. Because a card needs a single value, Power BI summarises the text field as First Supervisor Name; once the page is filtered by the hover, that is the hovered supervisor.
- Card 2, total sales: copy the first card, paste it next to it and replace the field with Sales. Keep the category label on so the card reads Sales under the number.
- Employee bar chart: add EMP Name and Sales, switch to a Clustered bar chart, turn off the Title (under General), turn off the X-axis, set the Y-axis text to black and slightly smaller, colour the bars yellow under Bars, and turn on Data labels in black.
Step 7: Assign the page to the doughnut chart
- Go back to Page 1 and select the doughnut chart.
- Open Format visual > General > Tooltips and expand Options.
- Set Type to Report page.
- In Page, pick your tooltip page (Supervisor Tooltip). Only pages marked as tooltips appear in this list.
Step 8: Test it
Hover over Supervisor-1 and the tooltip shows Supervisor-1, total sales of 401 and a bar for each of the seven employees. Move to Supervisor-3 and the cards and chart update straight away to 351 and that team’s six employees. Save the file and publish it; the tooltip works the same way in the Power BI service.
How it works
When you hover over a slice, Power BI passes that data point, here the supervisor name, to the tooltip page as a filter. Every visual on the page is filtered to that supervisor, so the card with the supervisor name shows the hovered name, the sales card shows that supervisor’s total and the bar chart lists only that team. You never write a measure for this; the filter context does the work.
More Tooltip Settings (Addition)
These settings are additions to the video, based on Microsoft’s current documentation.
- Automatic tooltips with Tooltip fields: on the tooltip page, drag a field such as Supervisor Name into the Tooltip fields well of the Visualizations pane. Any visual that uses that field, with its tooltip Page left on Auto, then shows your page without being assigned manually.
- Back to default: set the visual’s tooltip Page back to Auto, or Type back to Default.
- Hide the tooltip page: right-click its page tab and choose Hide page so report readers do not open it by accident. The tooltip keeps working.
- Turn tooltips off: switch off the Tooltips card in Format visual > General for visuals where a pop-up would only get in the way.
Common Errors and Fixes
The tooltip page is not in the Page list
The page is not marked as a tooltip. Select the page, open Format page > Page information and turn on Allow use as tooltip.
The report page tooltip never appears
Check that the visual’s tooltip Type is Report page, and that the Tooltips card is switched on. If the Page is Auto, make sure the tooltip page has a field in Tooltip fields that the visual also uses.
The tooltip shows totals for everyone
The visuals on the tooltip page use a field that is not related to the hovered data point, or a page filter overrides it. Build the tooltip visuals from the same table, as in this example where all three use the Sales table.
The tooltip is cut off or tiny
Set Canvas settings > Type to Tooltip, or a small custom size, and design at actual size. A full 16:9 page is shrunk to fit and becomes unreadable.
Tips
- Keep tooltip pages small: two or three visuals with large numbers are easier to read than a mini dashboard.
- Match the tooltip colours to your report theme. PK uses yellow bars and backgrounds to tie the tooltip to the main report.
- Use drillthrough when the user needs a full page of detail, and a tooltip when a quick look is enough.
- Microsoft’s guide to creating report page tooltips covers Tooltip fields, manual tooltips and line chart behaviour.
Want It Ready-Made?
If you would rather start from a finished, interactive report, the Sales Dashboard in Power BI and the Employee Performance Review Dashboard in Power BI on NextGenTemplates.com are ready to load with your own data. Browse all Power BI dashboard templates for more.
Related Tutorials
- Power BI Drillthrough: Filtered Detail Pages, Step by Step
- Power BI Drillthrough with Right Click, Buttons and Tooltips
- Dynamic Conditional Formatting in Power BI
- Power BI Dashboard Design: Make Your Report Look Like an App
Frequently Asked Questions
What is a report page tooltip in Power BI?
It is a small report page that appears instead of the default tooltip when you hover over a visual. Power BI filters the page to the data point under the mouse, so it can show cards and charts for that item only.
How do I change the tooltip background color in Power BI?
Select the visual, open Format visual, General, Tooltips and change the Color under Background. In the same card you can set the label color, value color and font.
Why is my tooltip page not showing in the Page dropdown?
Only pages marked as tooltips are listed. Select the page, open Format page, Page information and turn on Allow use as tooltip, then go back to the visual.
What size should a tooltip page be?
Use Canvas settings, Type, Tooltip for the standard small size, which is 320 by 240 pixels in the practice file. You can use a custom size, but keep it small because the tooltip floats over the report.
What is the difference between a tooltip and drillthrough?
A tooltip appears on hover and disappears when you move away, so it suits a quick look. Drillthrough opens a full detail page filtered to the item you right-click, so it suits deeper analysis.
About the Author
PK is a Microsoft Excel and Power BI expert and trainer and the founder of PK: An Excel Expert and NextGenTemplates.com. He has been teaching Excel, VBA, Power Query and Power BI since 2016 on his YouTube channel.
Conclusion
Power BI tooltips are a quick way to add detail without adding clutter. Restyle the default tooltip under Format visual, General, Tooltips, and when one number is not enough, build a small page with Allow use as tooltip turned on and Canvas settings set to Tooltip, then assign it to your visual with Type set to Report page. Download the practice files, rebuild the supervisor tooltip, and then pair it with drillthrough for the full detail view.