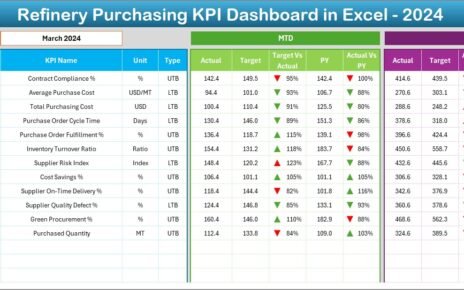
Managing purchasing operations in a refinery always demands precision, transparency, and fast decision-making. Because refinery purchasing involves high-value materials, long-term
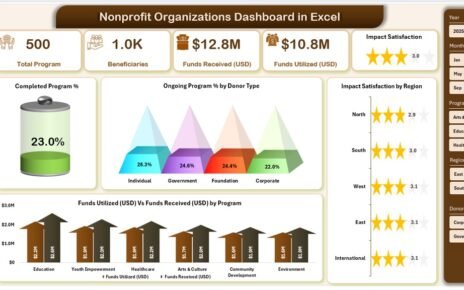
Nonprofit organizations play a critical role in society by addressing social, cultural, educational, and humanitarian needs. However, they often struggle
Cybersecurity remains one of the top priorities for businesses today. With increasing threats and evolving risks, organizations need a clear