Home>Blogs>Power BI>Design, Publish and Share a Sales Dashboard in Power BI
Sales Dashboard in Power BI
Power BI

Design, Publish and Share a Sales Dashboard in Power BI

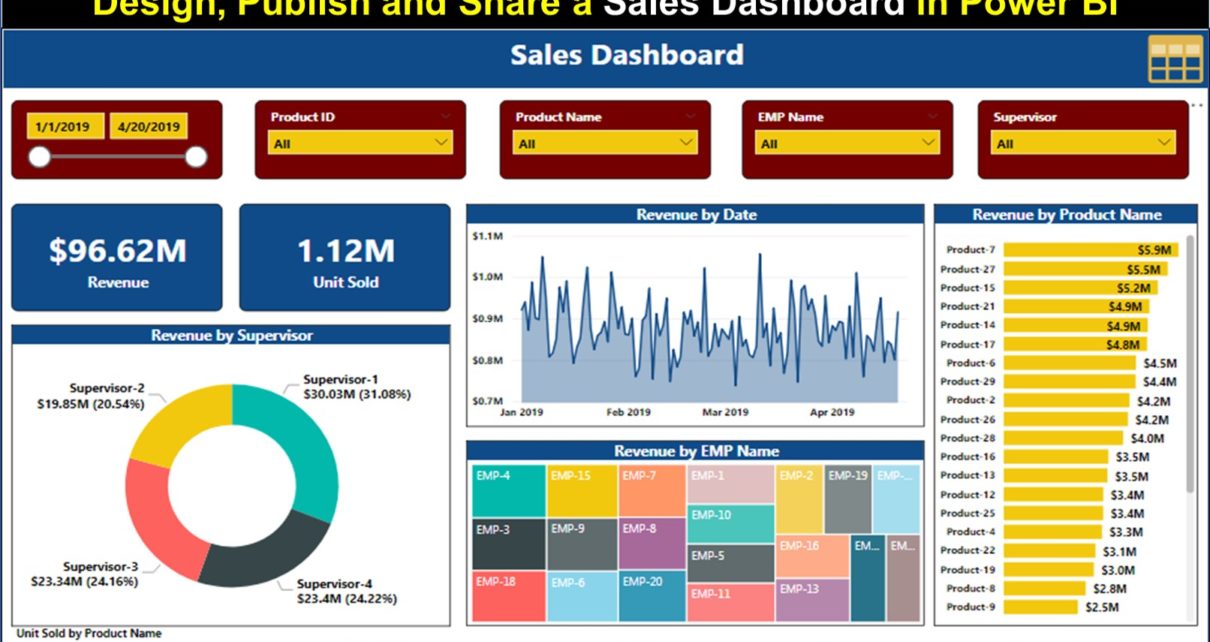
Microsoft Power BI is very powerful tool to analyze and visualize data. It is very easy to access. We have developed the Sales Dashboard in Power BI with some dummy data points.

Below is the power Bi live dashboard which we have developed. To see table view page click on table icon available on Top right corner.

About the data structure and data model-

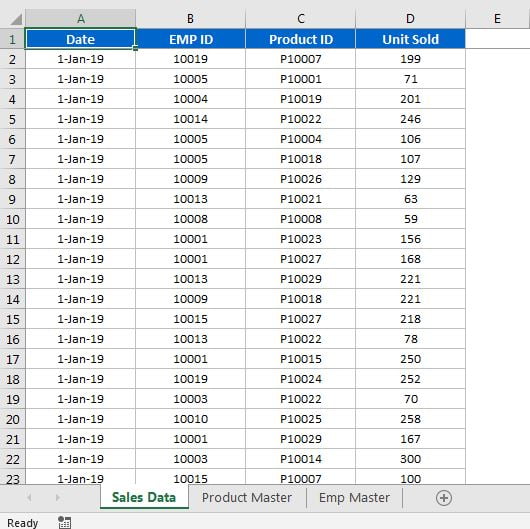
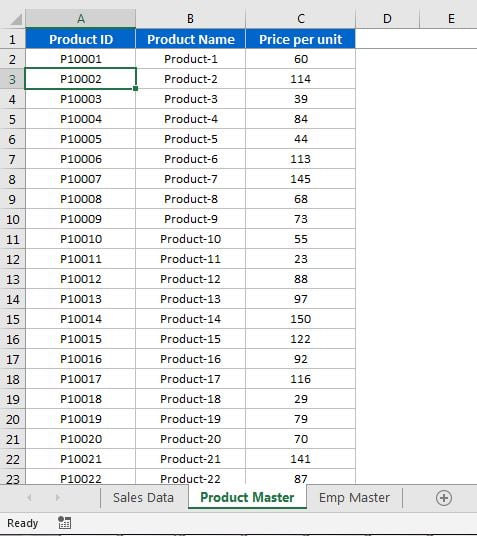
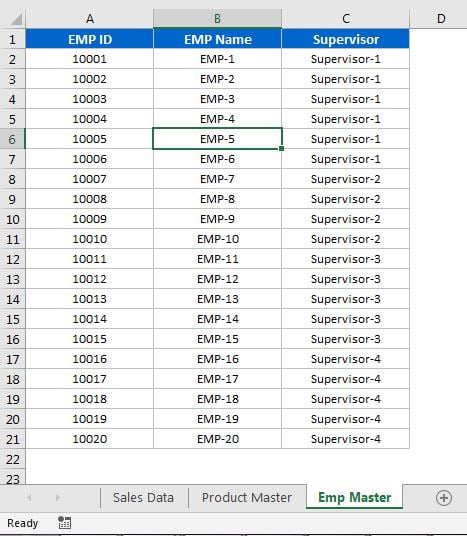
We have 3 tables in our excel data – Sales Data, Product Master and Emp Master. Below is the snapshot for all three images.

Sales Data
Sales Data


Product Master
Product Master


Emp Master
Emp Master

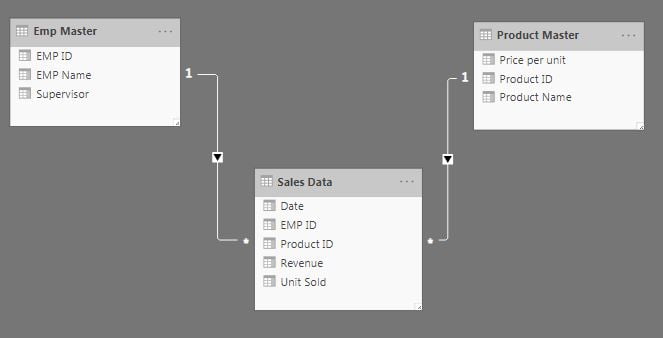
We have created a simple data model as given in below image-

Data Model
Data Model


Click here to download this practice files.

Learn the step by step video tutorials:

PK
Meet PK, the founder of PK-AnExcelExpert.com! With over 15 years of experience in Data Visualization, Excel Automation, and dashboard creation. PK is a Microsoft Certified Professional who has a passion for all things in Excel. PK loves to explore new and innovative ways to use Excel and is always eager to share his knowledge with others. With an eye for detail and a commitment to excellence, PK has become a go-to expert in the world of Excel. Whether you're looking to create stunning visualizations or streamline your workflow with automation, PK has the skills and expertise to help you succeed. Join the many satisfied clients who have benefited from PK's services and see how he can take your Excel skills to the next level!
https://www.pk-anexcelexpert.com