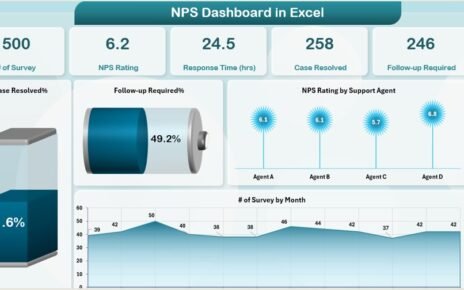
In today's highly competitive market, tracking customer satisfaction is essential for improving products, services, and overall business performance. One of
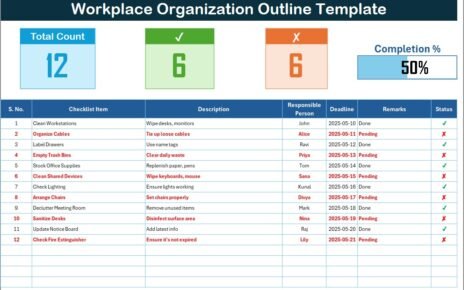
In any professional setting, maintaining an organized workplace is critical. Whether you're managing a manufacturing floor, an office space, or
A Video Marketing KPI Dashboard is a comprehensive tool that provides real-time data on the performance of your video marketing