In the fast-moving world of logistics and supply chain management, efficiency is everything. Whether it’s on-time deliveries, fuel cost management,
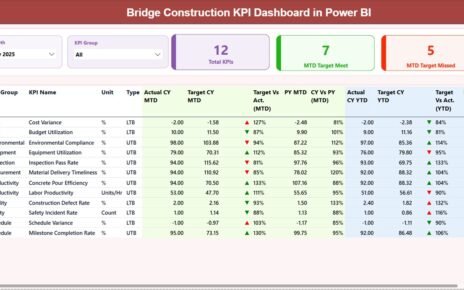
Bridge construction projects require precise planning, strict monitoring, and continuous performance tracking. However, many construction companies still rely on scattered
If you're an Excel user looking to improve the way you organize your data, the WRAPROWS Function in Excel is