Home>Blogs>Charts and Visualization>Sales funnel infographic chart in Excel>Sales Funnel infographic Chart -8
Sales Funnel infographic Chart -8
17
Feb 2024
0Comments Off on Sales Funnel infographic Chart -8
PK
Meet PK, the founder of PK-AnExcelExpert.com! With over 15 years of experience in Data Visualization, Excel Automation, and dashboard creation. PK is a Microsoft Certified Professional who has a passion for all things in Excel. PK loves to explore new and innovative ways to use Excel and is always eager to share his knowledge with others. With an eye for detail and a commitment to excellence, PK has become a go-to expert in the world of Excel. Whether you're looking to create stunning visualizations or streamline your workflow with automation, PK has the skills and expertise to help you succeed. Join the many satisfied clients who have benefited from PK's services and see how he can take your Excel skills to the next level!
https://www.pk-anexcelexpert.com
Related Articles
Podcast Performance KPI Dashboard in Excel
In today’s digital landscape, podcasts have become a powerful medium for engaging audiences, building brand awareness, and delivering insightful content.
Product Reviews and Ratings KPI Dashboard in Power BI
In today’s highly competitive digital marketplace, product reviews and customer ratings influence buying decisions more than ever before. Customers trust
Time Series Forecast and Anomaly Detection in Power BI
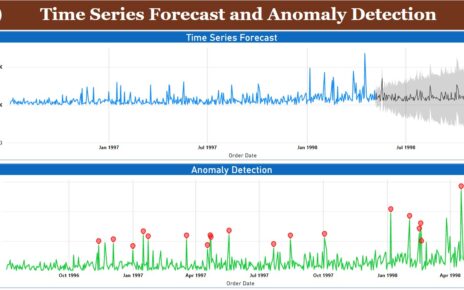
In this article, we have created the Time Series Forecast and Anomaly Detection in Microsoft Power BI. You can use


