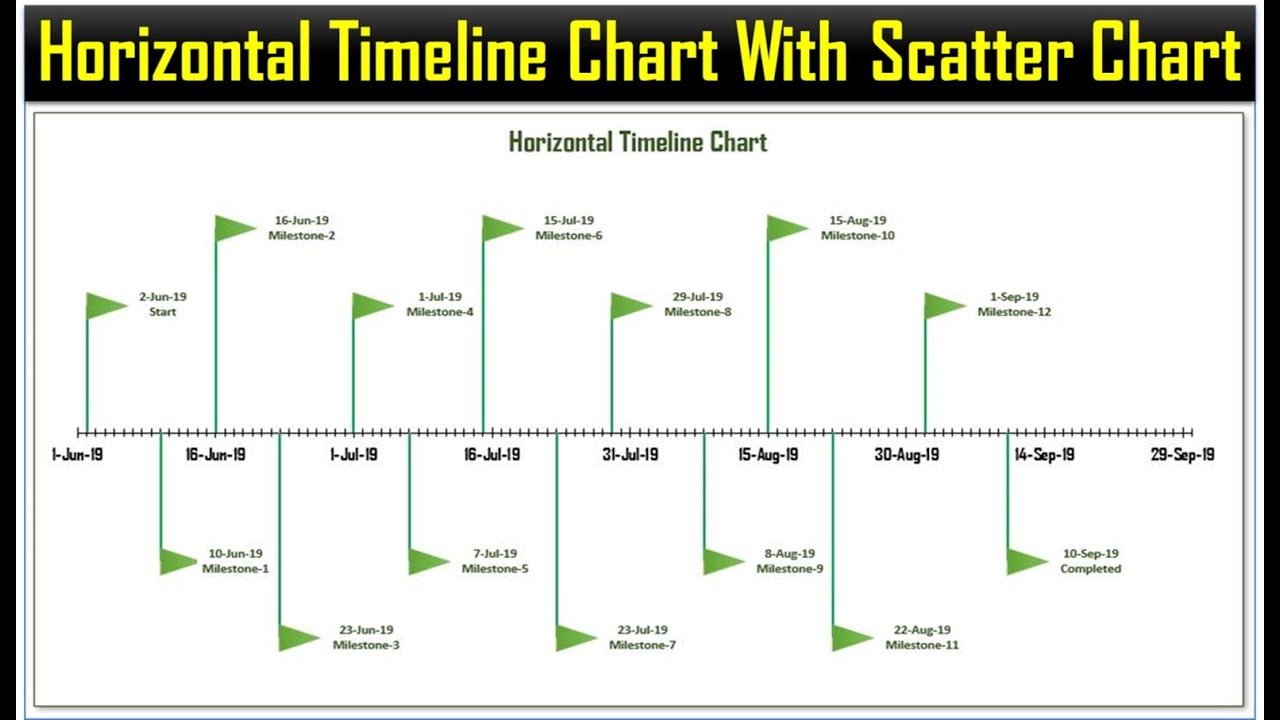
Home>Blogs>Charts and Visualization>Horizontal Timeline Chart using Scatter chart in Excel>Video Thumbnail: Horizontal Timeline Chart using Scatter chart in Excel
Video Thumbnail: Horizontal Timeline Chart using Scatter chart in Excel
24
Jun 2024
0Comments Off on Video Thumbnail: Horizontal Timeline Chart using Scatter chart in Excel
PK
Meet PK, the founder of PK-AnExcelExpert.com! With over 15 years of experience in Data Visualization, Excel Automation, and dashboard creation. PK is a Microsoft Certified Professional who has a passion for all things in Excel. PK loves to explore new and innovative ways to use Excel and is always eager to share his knowledge with others. With an eye for detail and a commitment to excellence, PK has become a go-to expert in the world of Excel. Whether you're looking to create stunning visualizations or streamline your workflow with automation, PK has the skills and expertise to help you succeed. Join the many satisfied clients who have benefited from PK's services and see how he can take your Excel skills to the next level!
https://www.pk-anexcelexpert.com
Related Articles
Loan Recovery Services Dashboard in Excel
Managing loan recovery without proper visibility often creates delays, higher costs, and lower recovery rates. However, when financial institutions rely
Fashion & Apparel KPI Dashboard in Power BI
The fashion and apparel industry changes fast. Trends shift, customer preferences evolve, and sales numbers fluctuate every single month. Because
Convenience Store KPI Scorecard in Excel
Convenience Store KPI Scorecard in Excel tracks 20+ store performance KPIs across 4 structured worksheets, with MTD and YTD comparisons,


