In today’s digital-first world, retaining skilled IT professionals is more crucial than ever. Tech talent is the driving force behind innovation, and if they’re not satisfied, they won’t stay for long. So, how can organizations consistently monitor and improve employee satisfaction?
That’s where the IT and Tech Employee Satisfaction KPI Dashboard in Excel plays a powerful role.
This article will walk you through every essential aspect of this tool—its functionality, advantages, best practices, and real-life application—so you can boost productivity and retain your best tech talent.
Click to Purchases IT and Tech Employee Satisfaction KPI Dashboard in Excel
What Is an IT and Tech Employee Satisfaction KPI Dashboard?
An Employee Satisfaction KPI Dashboard is an Excel-based tool that helps track, measure, and visualize key performance indicators (KPIs) related to employee engagement, happiness, and retention. For tech companies, where performance and mental wellness go hand in hand, this dashboard becomes a decision-making powerhouse.
It comes with interactive worksheets, automated calculations, and visual elements like conditional formatting and trendlines—all crafted to simplify how you measure satisfaction.
What’s Inside This Dashboard?
This ready-to-use Excel dashboard includes 7 powerful worksheet tabs designed for full-circle tracking and management.
Home Sheet – Your Control Center
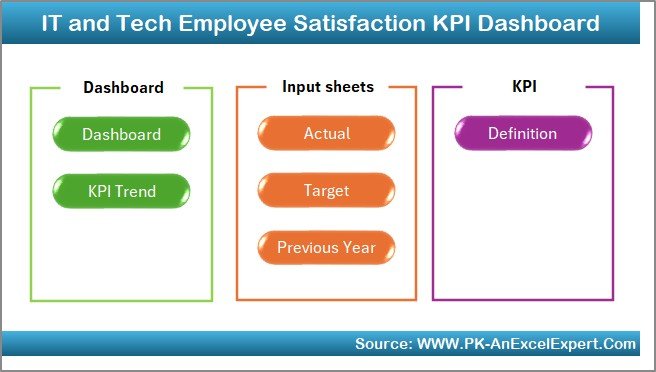
The Home sheet is your main navigation panel. It features buttons linked to each functional area of the dashboard, making it easy to explore different parts of the tool quickly.
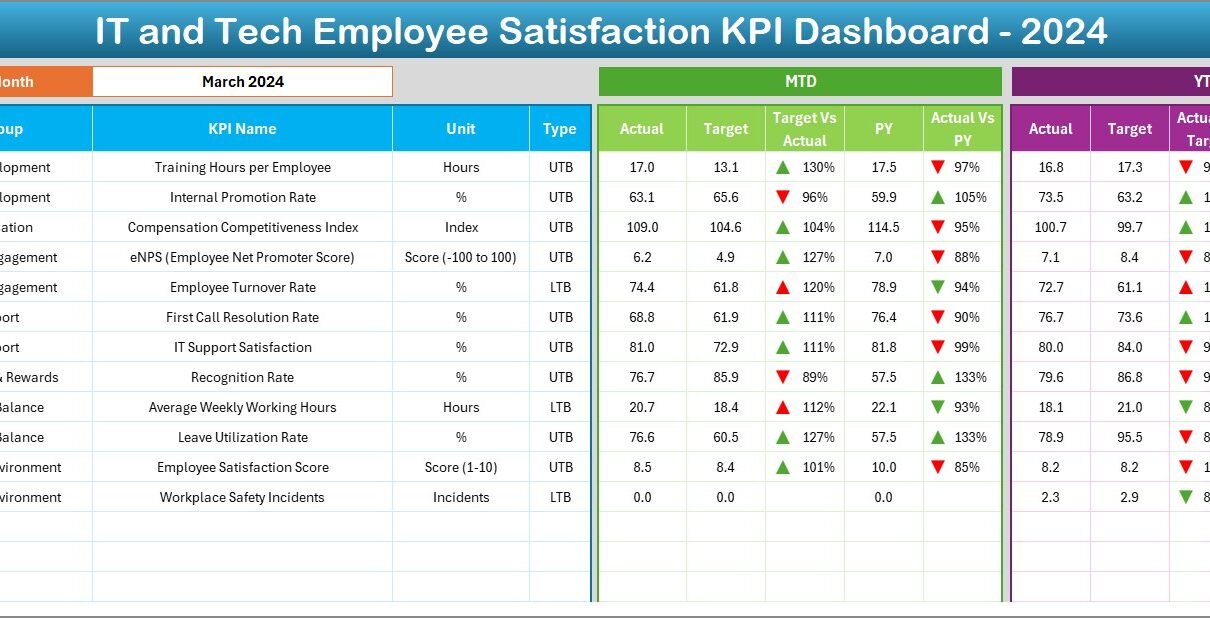
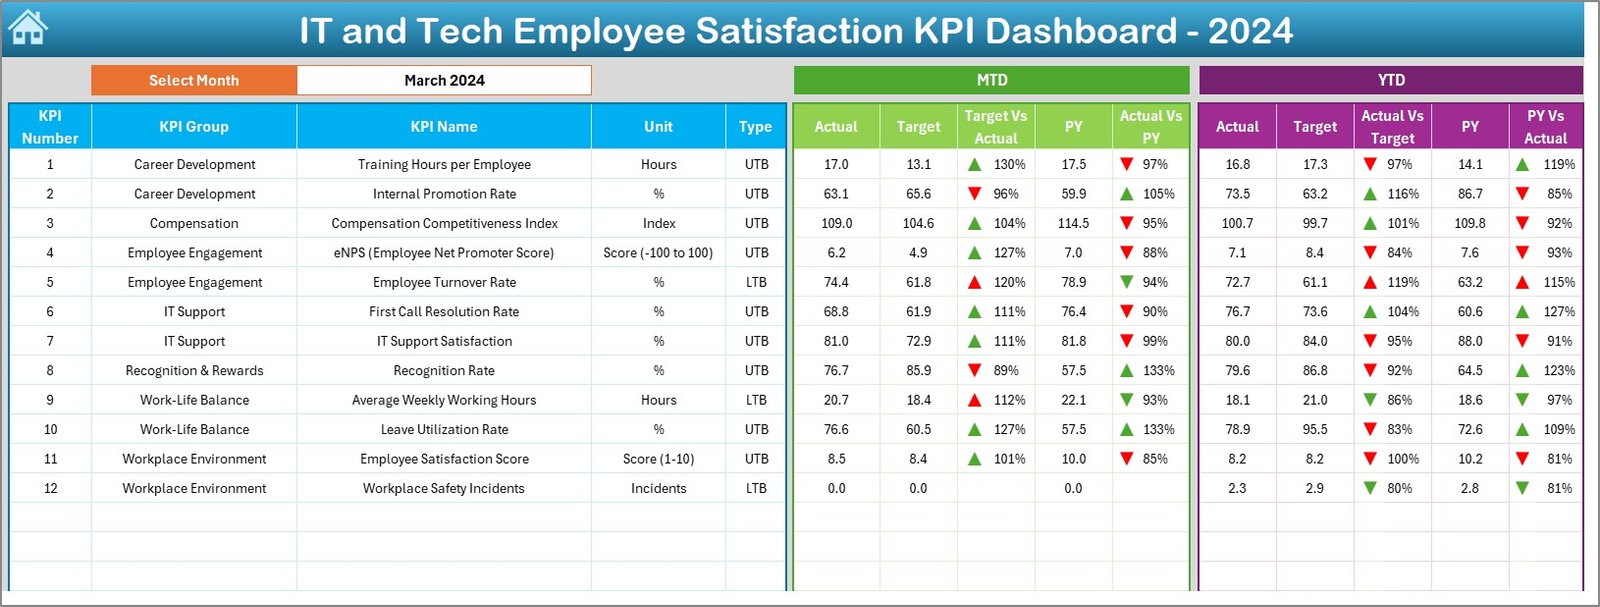
Dashboard Sheet Tab – Real-Time KPI Visualization
-
Choose a month using a dropdown in cell
D3. -
View metrics like MTD Actual, Target, Previous Year values.
-
Visual comparisons with up/down arrows using conditional formatting.
-
YTD (Year-To-Date) performance is also included, ensuring holistic views.
All of this happens automatically—just pick the month, and the dashboard updates instantly.
KPI Trend Sheet – Visualize the Journey
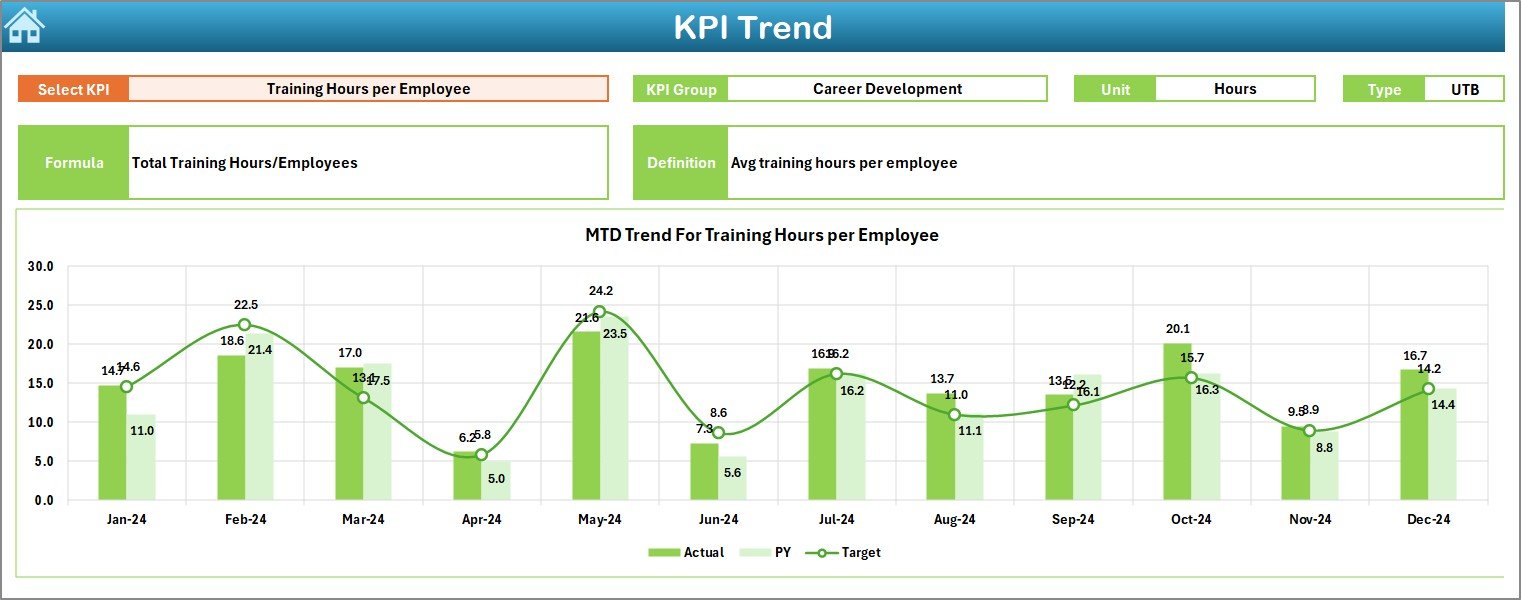
Select any KPI from the dropdown (cell C3) to view:
-
KPI details: Group, Unit, Formula, Definition, and Type (UTB or LTB).
-
Interactive MTD and YTD trend charts for the selected KPI.
This makes it easier to spot improvement or decline over time.
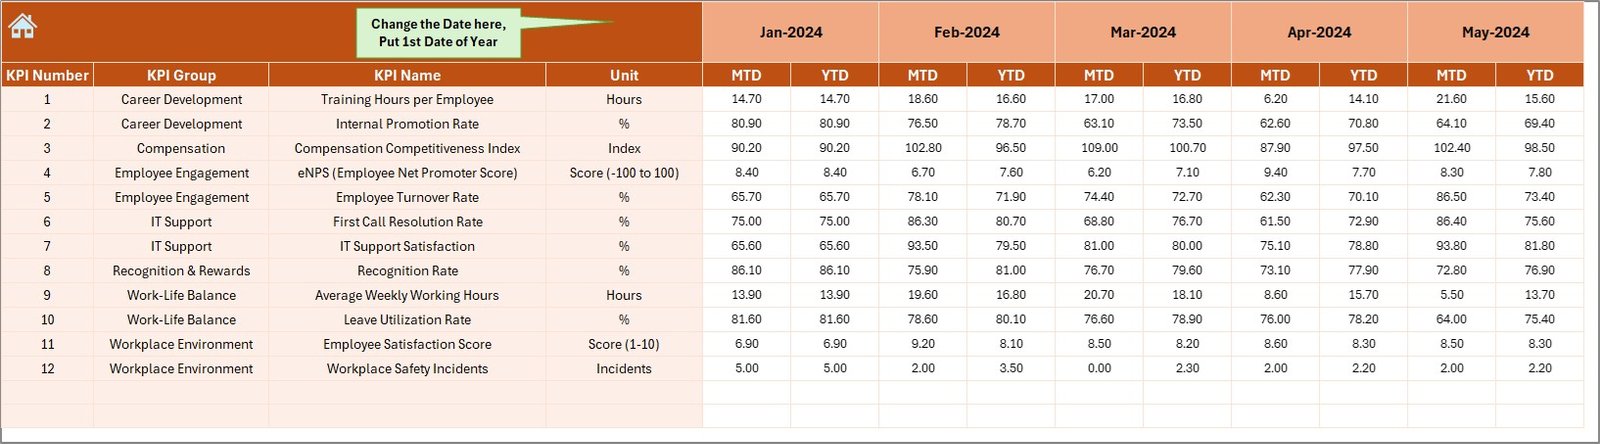
Actual Numbers Input Sheet – Keep Data Fresh
-
Enter actual KPI data monthly.
-
Update both MTD and YTD values.
-
Modify the starting month in cell
E1for flexible reporting.
Target Sheet Tab – Set Your Goals

Input monthly and yearly target values for each KPI. This acts as the benchmark for performance evaluation and enables comparisons with actual and past data.
Click to Purchases IT and Tech Employee Satisfaction KPI Dashboard in Excel
Previous Year Numbers Sheet – Compare with the Past

Enter the previous year’s performance data in this sheet. These values help in visualizing trends and understanding whether employee satisfaction has improved over time.
KPI Definition Sheet – Define What Matters

List out each KPI with:
-
KPI Name
-
KPI Group
-
Unit
-
Formula
-
Type (UTB or LTB)
-
Definition
This tab ensures everyone on your team understands each metric in the same way.
Why Is Employee Satisfaction Important in IT and Tech?
Click to Purchases IT and Tech Employee Satisfaction KPI Dashboard in Excel
Employee satisfaction directly affects:
-
Productivity
-
Innovation
-
Retention
-
Customer satisfaction
In high-stress, fast-paced IT environments, satisfied employees stay longer, contribute more ideas, and perform better. An Excel dashboard like this empowers you to measure and act on satisfaction indicators before it’s too late.
Advantages of the IT and Tech Employee Satisfaction KPI Dashboard
📊 Centralized View of All KPIs
Track all your satisfaction KPIs without switching tools or software.
🔄 MTD & YTD Comparisons
Compare monthly and year-to-date performance in one glance.
📈 Dynamic Trend Analysis
Use trend charts to visualize performance progression throughout the year.
🟢 Visual Cues for Fast Decision-Making
Conditional arrows show where KPIs are improving or dropping.
🧩 Fully Customizable
You can add or remove KPIs, modify formulas, and change data ranges easily.
🧠 Supports Informed Leadership Decisions
Leaders can use this dashboard to understand pain points and act faster.
Best Practices for Using the Dashboard
To make this dashboard a true game-changer, follow these tips:
✔ Keep It Updated Regularly
Update Actual, Target, and Previous Year values monthly to maintain accuracy.
✔ Use Well-Defined KPIs
Ensure every KPI has a clear definition and consistent formula to avoid confusion.
✔ Focus on Actionable Insights
Use the dashboard to identify trends, then take action based on what you see.
✔ Combine Quantitative with Qualitative Feedback
Use this dashboard alongside employee surveys to get a full picture.
✔ Segment Data for Deeper Analysis
Consider separating KPIs by department, location, or team to uncover specific issues.
✔ Align KPIs with Organizational Goals
Make sure every metric you track contributes to overall business success.
How to Customize This Excel Dashboard for Your Team?
Click to Purchases IT and Tech Employee Satisfaction KPI Dashboard in Excel
Here are a few ways to personalize it for your organization:
-
Add New KPIs in the KPI Definition tab. The dashboard will automatically pull them into the trends.
-
Change KPI Types (e.g., from UTB to LTB) based on your business logic.
-
Incorporate Department Filters using slicers or drop-downs.
-
Integrate with Power Query or VBA to automate data updates from HR systems.
This flexibility ensures the tool grows along with your company.
Sample KPIs You Can Track
Here are some KPIs commonly used in IT and Tech satisfaction tracking:
-
Employee Net Promoter Score (eNPS)
-
Training Effectiveness Score
-
Work-Life Balance Index
-
Absenteeism Rate
-
Burnout Rate
-
Internal Mobility Rate
-
Performance Recognition Frequency
-
IT Helpdesk Ticket Resolution Time Satisfaction
Each of these KPIs helps reveal a different angle of employee engagement and satisfaction.
Real-World Use Cases
Let’s say your team noticed a spike in absenteeism last quarter. You switch to the KPI Trend sheet, select “Absenteeism Rate”, and see a rising trend. Now you know it’s not just a one-off month—it’s a problem.
You then investigate further and find that the Training Satisfaction Score also declined. That insight might tell you employees feel unsupported and are disengaging.
Without the dashboard, this would have gone unnoticed until exit interviews—too late!
Conclusion
If you’re serious about retaining IT professionals, creating a supportive work environment, and building a top-performing team, then this tool is essential.
The IT and Tech Employee Satisfaction KPI Dashboard in Excel makes performance tracking effortless and insights immediate. It’s ready to use, simple to customize, and built for results.
Whether you’re an HR leader, team manager, or business analyst, this dashboard equips you to create a healthier, happier workplace.
Frequently Asked Questions (FAQs)
❓ What types of KPIs should I include in an IT employee satisfaction dashboard?
You should focus on engagement, retention, work-life balance, training, internal movement, and feedback-based KPIs like:
-
Employee Net Promoter Score (eNPS)
-
Absenteeism Rate
-
Training Satisfaction Score
-
Work-Life Balance Index
❓ Can I use this dashboard for remote teams?
Yes! This Excel-based tool works perfectly for remote and hybrid teams. You can even share it on cloud platforms like OneDrive or SharePoint for collaboration.
❓ How often should I update the dashboard?
Monthly updates are ideal. You can update both MTD and YTD figures to reflect the latest trends.
❓ Can I connect this dashboard to live data?
Yes, using Power Query or Excel VBA, you can automate data imports from external sources like databases, APIs, or cloud systems.
❓ Is this tool suitable for large organizations?
Absolutely. Although Excel is perfect for small to medium companies, larger organizations can use this dashboard as a prototype before moving to tools like Power BI for enterprise-scale insights.
Visit our YouTube channel to learn step-by-step video tutorials
Click to Purchases IT and Tech Employee Satisfaction KPI Dashboard in Excel