In the highly competitive construction and real estate industry, data-driven decision-making is no longer optional—it’s essential. From managing project timelines to improving resource utilization, every decision impacts profitability, client satisfaction, and long-term growth.
A Construction and Real Estate Process Improvement KPI Dashboard in Excel offers a comprehensive way to monitor, track, and analyze business performance. This powerful tool consolidates data into an easy-to-read visual format, empowering you to identify bottlenecks, optimize processes, and achieve your strategic goals.
In this detailed guide, we will explore everything you need to know about this dashboard, including its features, advantages, best practices, and frequently asked questions.
Click to Purchases Construction and Real Estate Process Improvement KPI Dashboard in Excel
What Is the Construction and Real Estate Process Improvement KPI Dashboard in Excel?
The Construction and Real Estate Process Improvement KPI Dashboard is a pre-designed Excel template that tracks and monitors key performance indicators (KPIs) across different areas of construction and real estate operations.
It is built for managers, contractors, engineers, and real estate developers who need a quick and accurate way to measure performance against targets, previous year benchmarks, and industry standards.
Unlike generic reporting tools, this Excel dashboard focuses specifically on process improvement metrics—helping businesses enhance efficiency, reduce costs, and improve quality.
Key Features of the Dashboard
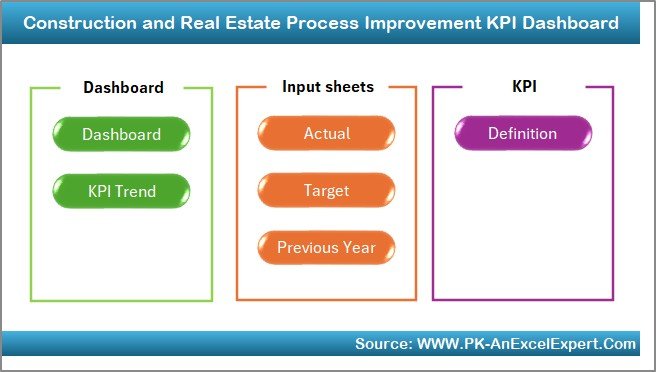
This dashboard is organized into seven well-structured worksheet tabs, each serving a specific purpose.
Home Sheet
-
Acts as the central navigation hub.
-
Contains six clickable buttons to jump to specific sheets instantly.
-
Saves time by eliminating the need to scroll through multiple sheets.
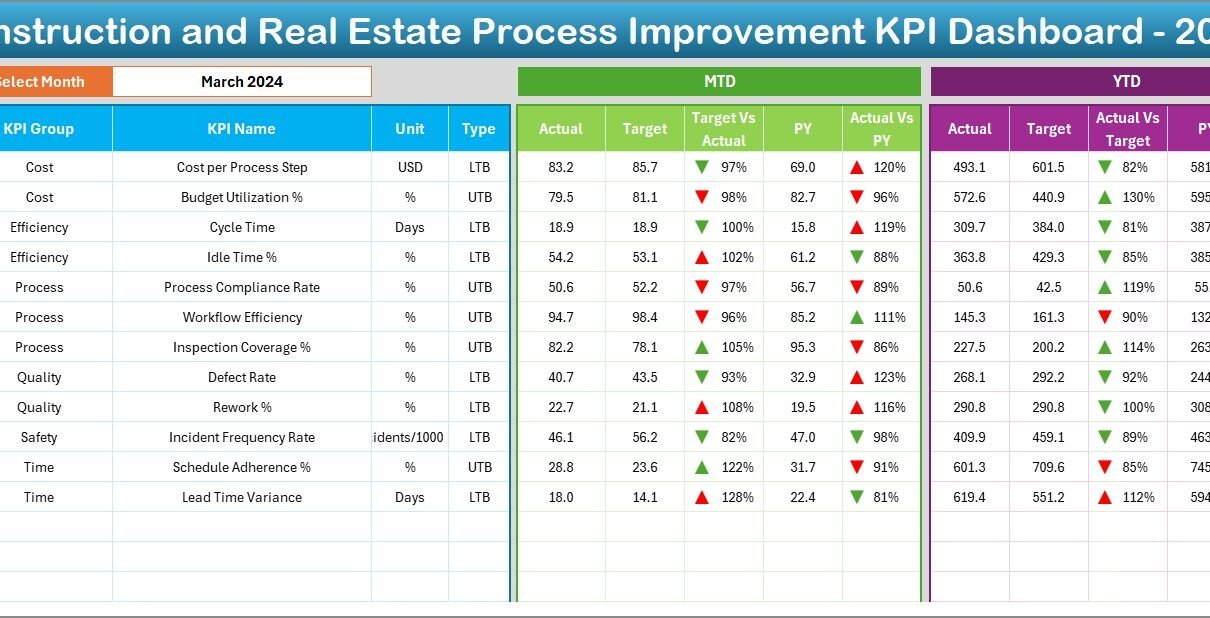
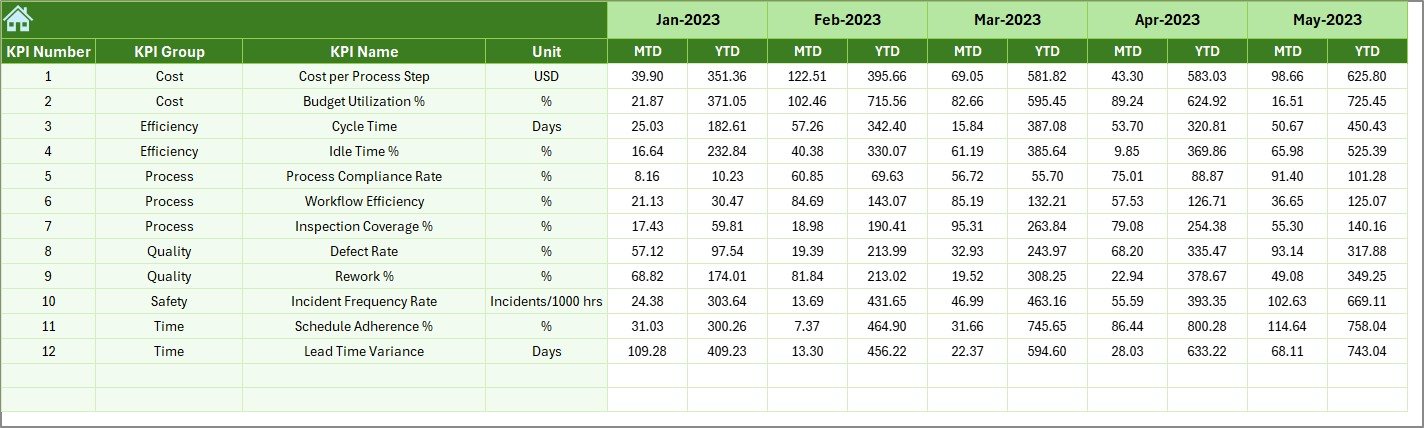
Dashboard Sheet Tab
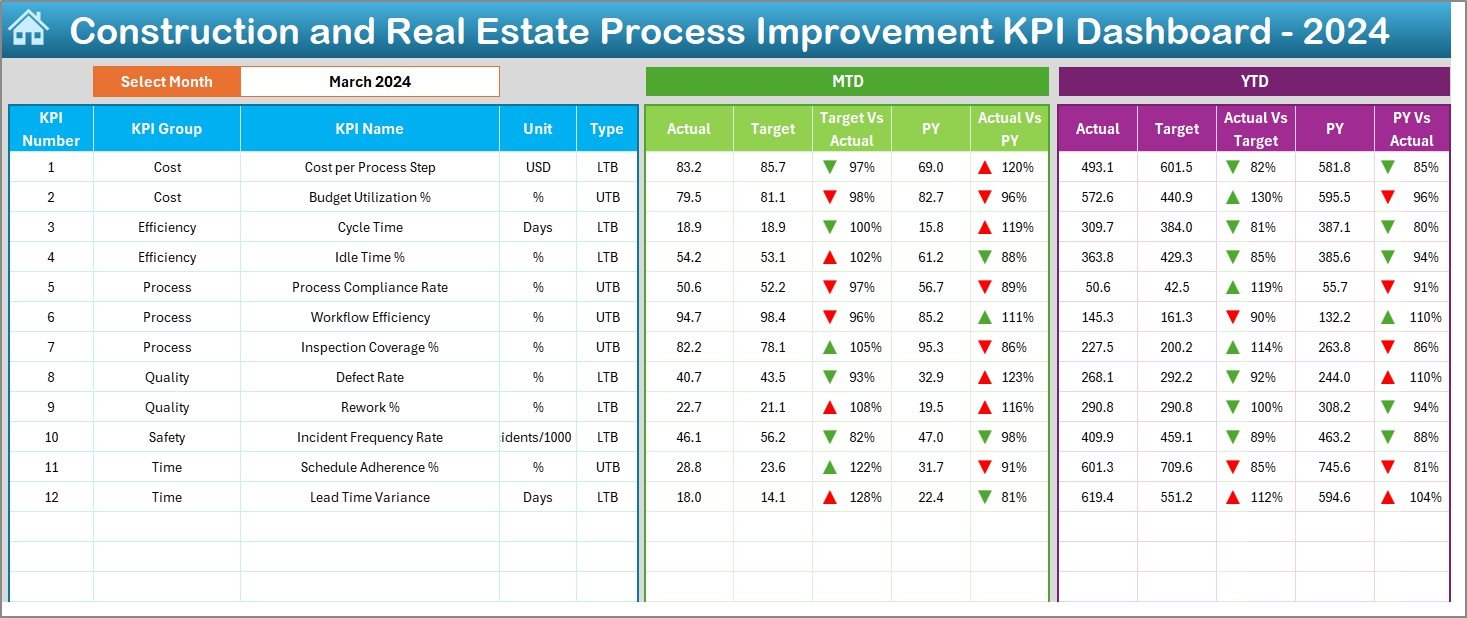
-
Displays all KPI information in one place.
-
Includes a month selector (Cell D3) for dynamic analysis—changing the month updates the entire dashboard automatically.
Shows Month-to-Date (MTD) and Year-to-Date (YTD):
- Actual values
- Targets
- Previous Year (PY) data
- Highlights Target vs Actual and PY vs Actual comparisons with conditional formatting arrows (up/down).
-
Ideal for quick performance reviews during meetings.
KPI Trend Sheet Tab
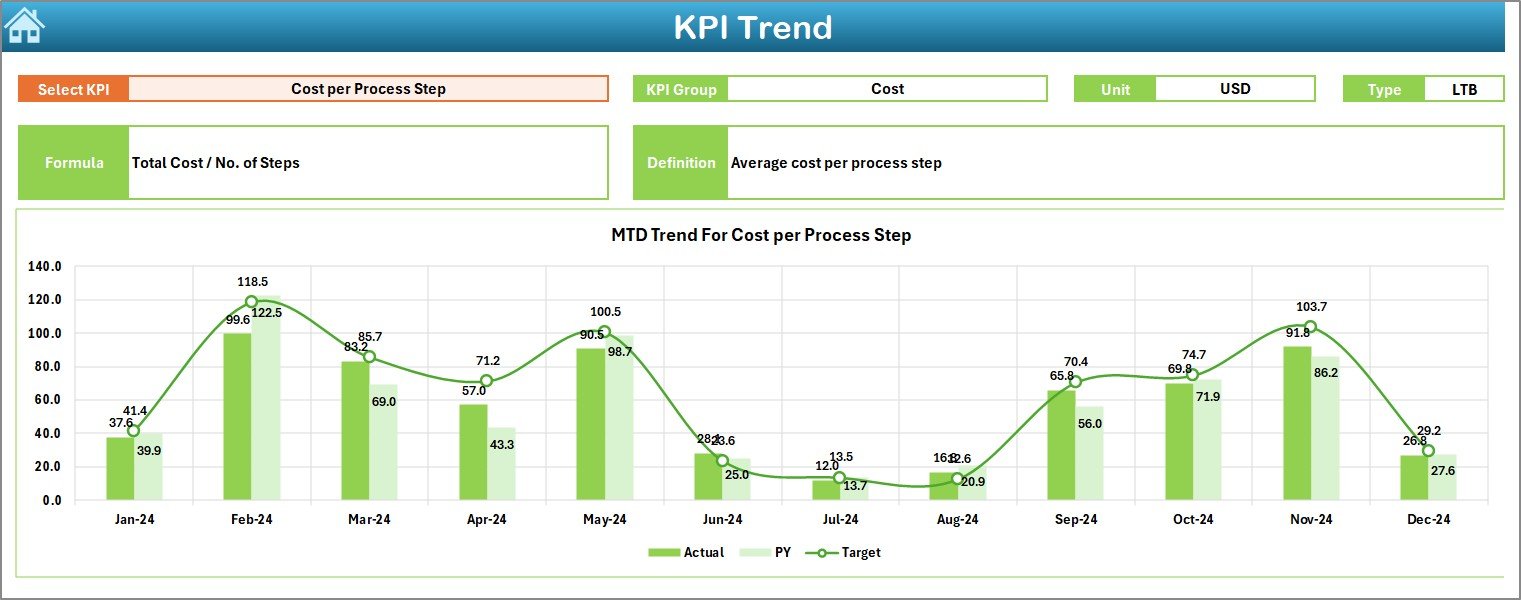
-
Lets you select a KPI from a drop-down (Cell C3).
Displays:
- KPI Group
- Unit of measurement
- KPI Type (Lower the Better or Upper the Better)
- Formula
- Definition
Features trend charts for MTD and YTD:
- Actual vs Target vs PY
- Helps spot performance patterns and areas for improvement.
Actual Numbers Input Sheet
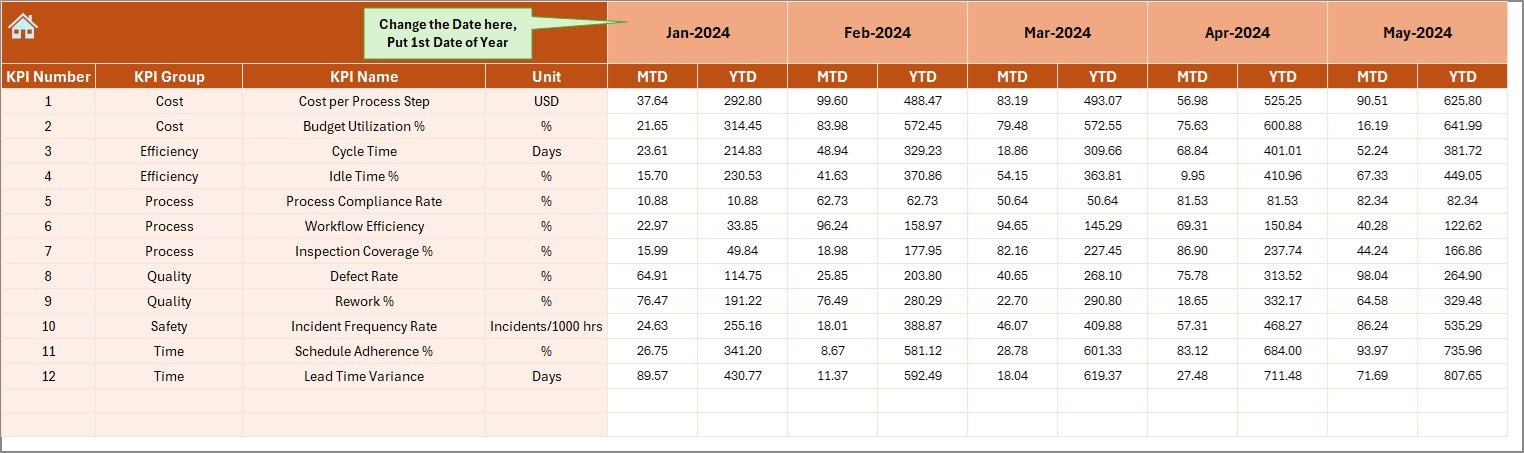
-
Designed for data entry of actual performance figures.
-
Separate fields for YTD and MTD values.
-
Month selection via Cell E1 to match the reporting period.
-
Ensures accuracy and consistency in the dashboard calculations.
Target Sheet Tab
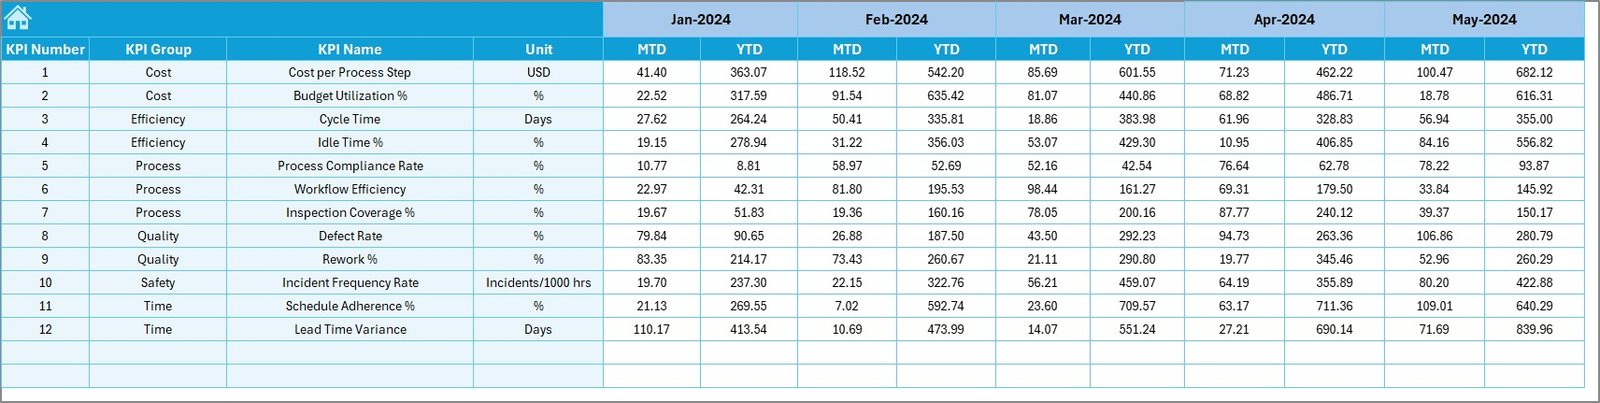
-
Used to enter monthly and yearly target values for each KPI.
-
Supports both MTD and YTD target setting.
-
Helps set realistic performance goals.
Previous Year Number Sheet Tab
-
Stores historical data for the previous year.
-
Structured like the actual numbers sheet for easy year-over-year comparison.
-
Crucial for understanding seasonal trends.
Click to Purchases Construction and Real Estate Process Improvement KPI Dashboard in Excel
KPI Definition Sheet Tab
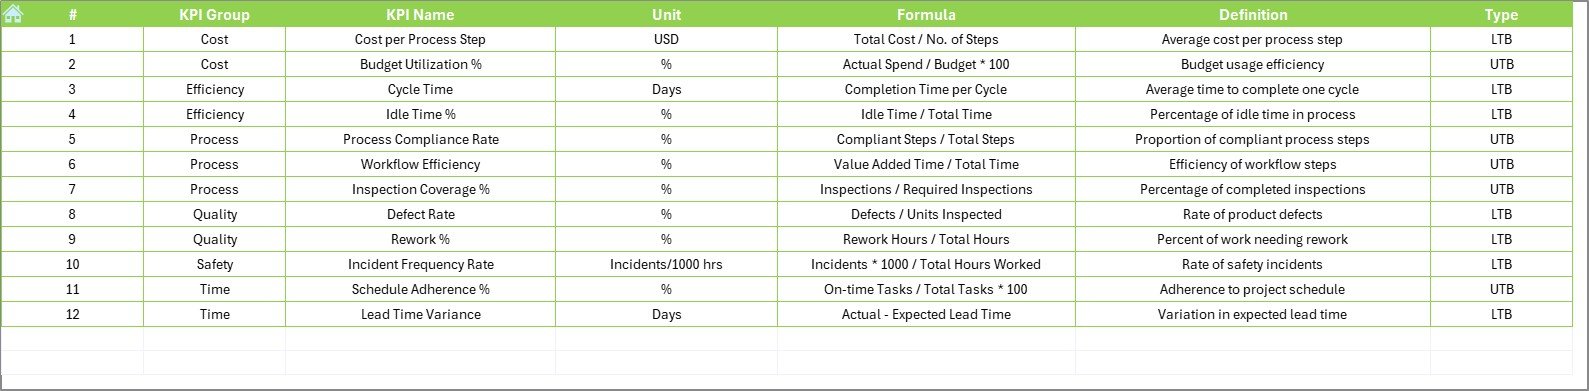
A reference guide containing:
- KPI Name
- KPI Group
- Unit of measurement
- Formula
- Definition
-
Ensures all team members have a shared understanding of each KPI.
Why Process Improvement KPIs Matter in Construction and Real Estate
In construction and real estate, small inefficiencies can snowball into major losses. Process improvement KPIs help:
-
Monitor operational performance
-
Identify delays or cost overruns early
-
Improve resource allocation
-
Enhance quality control
-
Boost client satisfaction
By integrating these KPIs into a visual dashboard, decision-makers can act faster and with greater confidence.
Advantages of the Construction and Real Estate Process Improvement KPI Dashboard
1. Centralized Performance Monitoring
All KPIs are in one location, eliminating the need to compile multiple reports.
2. Improved Decision-Making
Clear comparisons between actual, target, and previous year help identify performance gaps.
3. Time-Saving Navigation
The home sheet’s clickable buttons enable quick movement between sections.
4. Easy to Customize
You can add or remove KPIs based on your company’s specific needs.
5. Trend Tracking
The KPI Trend sheet makes it easy to spot performance improvements or declines over time.
6. Historical Comparisons
The previous year’s data provides valuable benchmarks for growth measurement.
Best Practices for Using the Dashboard
To maximize the benefits of your KPI dashboard, follow these best practices:
-
Define Clear KPIs
Ensure every KPI has a precise definition and formula to avoid confusion. -
Update Data Regularly
Input actual and target values consistently to maintain accuracy. -
Use Conditional Formatting Effectively
Color coding and arrows make it easier to interpret results quickly. -
Review Monthly and Yearly Trends
Don’t just focus on monthly performance—look at year-to-date trends for better insight. -
Train Your Team
Make sure every user understands how to read and update the dashboard.
Common KPIs in Construction and Real Estate Process Improvement
Here are some KPIs you can track using this dashboard:
-
Project Completion Rate (%)
-
Budget Variance (%)
-
Change Order Frequency
-
Safety Incidents Rate
-
Client Satisfaction Score
-
Equipment Utilization Rate
-
Employee Productivity Rate
-
Quality Defect Rate
-
On-Time Delivery Percentage
-
Cash Flow Variance
-
Material Waste Percentage
-
Workforce Turnover Rate
How This Dashboard Improves Efficiency
This dashboard acts as a real-time control center for your business operations. Instead of waiting for quarterly reports, you can monitor progress daily or monthly, enabling proactive decision-making.
For example:
-
If project delays occur, you can quickly spot them in the MTD performance view.
-
If budget overruns happen, you can identify which KPIs are contributing and take corrective action.
-
If quality issues increase, the defect rate KPI will flag the problem for immediate resolution.
Steps to Implement the Dashboard in Your Organization
-
Identify Your KPIs – Choose metrics that align with your business goals.
-
Collect Historical Data – Input previous year values for benchmarking.
-
Set Targets – Define monthly and yearly goals.
-
Train Users – Ensure your team knows how to update and interpret the dashboard.
-
Monitor & Adjust – Regularly review KPIs and refine targets as needed.
Opportunities for Improvement
While the dashboard is powerful, you can enhance it further by:
-
Adding automation through Excel macros for faster data updates.
-
Integrating with Power BI for advanced visualization.
-
Linking to project management software for real-time updates.
-
Adding forecasting models to predict future performance.
Conclusion
The Construction and Real Estate Process Improvement KPI Dashboard in Excel is a must-have tool for businesses that want to stay competitive. By tracking KPIs in an easy-to-understand visual format, it ensures better decision-making, process optimization, and performance improvement.
When used consistently, this dashboard becomes more than just a reporting tool—it transforms into a strategic asset for growth.
Frequently Asked Questions (FAQs)
1. Who can use this dashboard?
This dashboard is ideal for construction companies, real estate developers, project managers, and contractors.
2. Do I need advanced Excel skills to use it?
No. The dashboard is user-friendly and includes drop-down menus, buttons, and clear instructions.
3. Can I add my own KPIs?
Yes. The KPI Definition sheet allows you to add or modify KPIs as per your needs.
4. How often should I update the data?
It’s best to update the data monthly to keep the dashboard accurate and actionable.
5. Can I track both financial and non-financial metrics?
Absolutely. You can track metrics like budget variance and project completion rates alongside safety and quality indicators.
Visit our YouTube channel to learn step-by-step video tutorials
Click to Purchases Construction and Real Estate Process Improvement KPI Dashboard in Excel